Warehouse Management Systems Market Analysis North America, Europe, APAC, Middle East and Africa, South America - US, Germany, Canada, China, UK, France, Japan, India, The Netherlands, South Korea - Size and Forecast 2025-2029

Warehouse Management Systems Market Analysis North America, Europe, APAC, Middle East and Africa, South America - US, Germany, Canada, China, UK, France, Japan, India, The Netherlands, South Korea - Size and Forecast 2025-2029

Published: Feb 2025 246 Pages SKU: IRTNTR43628

Market Overview at a Glance

$3.87 B
Market Opportunity
14.8%
CAGR
12.6
YoY growth 2024-2025(%)

Warehouse Management Systems Market Size 2025-2029

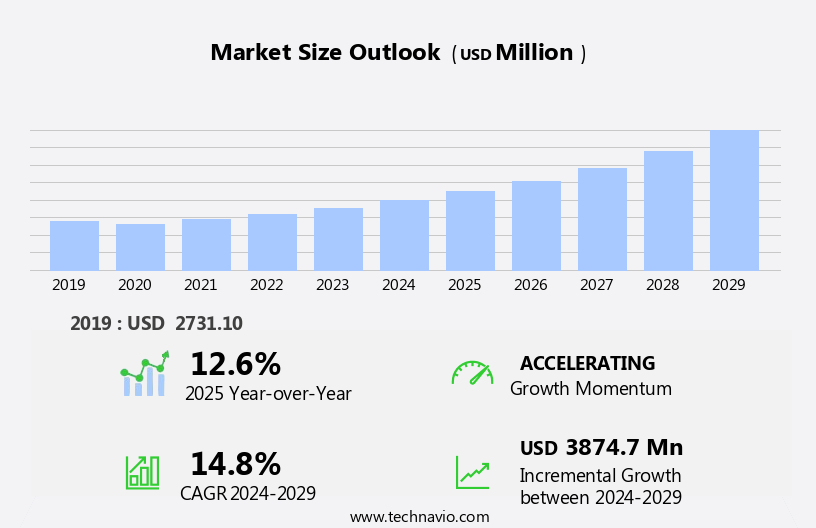
The warehouse management systems market size is forecast to increase by USD 3.87 billion at a CAGR of 14.8% between 2024 and 2029.

  • The Warehouse Management Systems (WMS) market is experiencing significant growth, driven by the increasing demand for inventory control and the expansion of e-commerce businesses. With the rise of e-commerce, there is a growing need for efficient and accurate warehouse management to meet the demands of online shoppers for fast and reliable delivery. WMS solutions enable businesses to streamline their warehouse operations, optimize inventory levels, and improve order fulfillment accuracy. However, the implementation cost of on-premises WMS remains a challenge for many businesses, particularly small and medium-sized enterprises (SMEs). These systems require significant upfront investment for hardware, software, and implementation, making them less accessible to some organizations.
  • As a result, there is growing interest in cloud-based WMS solutions, which offer lower upfront costs and greater scalability. Despite this challenge, the market's strategic landscape remains favorable for companies seeking to capitalize on the growing demand for efficient warehouse management solutions. By investing in innovative technologies and offering flexible pricing models, WMS companies can differentiate themselves and capture market share. Companies that can effectively navigate these challenges and leverage the opportunities presented by the growing e-commerce market will be well-positioned for success in the WMS market.

What will be the Size of the Warehouse Management Systems Market during the forecast period?

Warehouse Management Systems Market Size

 Request Free Sample

  • The warehouse management systems (WMS) market encompasses a range of solutions designed to optimize the day-to-day operations of various warehousing facilities. These systems facilitate inventory management, order fulfillment, and logistics processes for industries spanning retail, manufacturing, and logistics. The market's growth is driven by the increasing adoption of digital technologies, such as RFID, smart devices, smart tablets, and mobile phones, which enhance product tracking, lead time reduction, and product delivery speed. Small-scale industries are also embracing WMS solutions to streamline their operations and remain competitive.
  • The retail sector, in particular, is experiencing significant growth in the implementation of WMS, as consumer expectations for fast and accurate order fulfillment continue to rise. Overall, the WMS market is poised for continued expansion as businesses seek to improve their product markets' efficiency and competitiveness.

How is this Warehouse Management Systems Industry segmented?

The warehouse management systems industry research report provides comprehensive data (region-wise segment analysis), with forecasts and estimates in "USD million" for the period 2025-2029, as well as historical data from 2019-2023 for the following segments.

  • Component
    • Software
    • Hardware
    • Integrated WMS software
    • Services
    • Others
  • Application
    • Inventory management
    • Supply chain management
    • Purchase and order management
    • Asset management
    • Others
  • End-user
    • Retail and consumer goods
    • Transport and logistics
    • Automotive
    • Healthcare and pharmaceuticals
    • Others
  • Geography
    • North America
      • US
      • Canada
    • Europe
      • France
      • Germany
      • The Netherlands
      • UK
    • APAC
      • China
      • India
      • Japan
      • South Korea
    • Middle East and Africa
      • South America

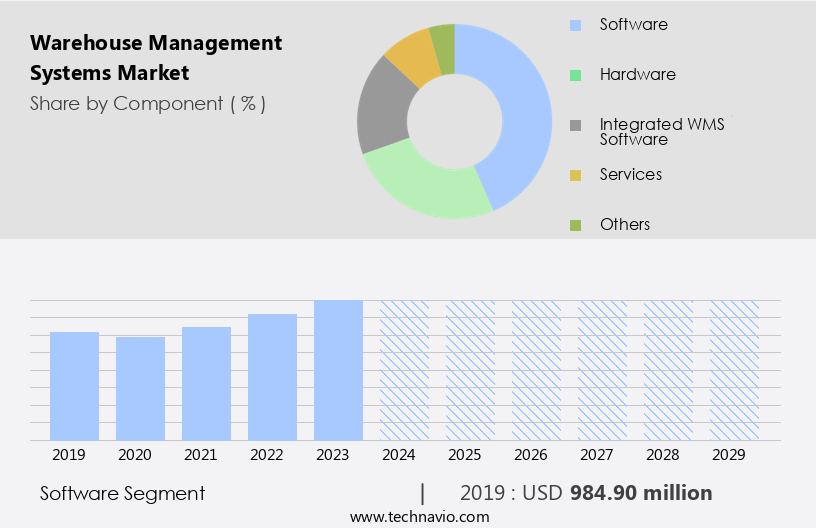
      By Component Insights

      The software segment is estimated to witness significant growth during the forecast period.

      The market encompasses software applications that streamline and manage warehouse operations for businesses. Warehouse management software automates and optimizes inventory processes, including inbound freight handling, put-away, picking, packing, shipping, and real-time inventory tracking. The market growth is fueled by the need for efficient supply chain management in various industries, such as retail, e-commerce, healthcare, and manufacturing. Advanced technologies, like IoT, AI, and ML, are revolutionizing warehouse management, leading to the development of sophisticated solutions. Digital technologies, including web-based portals, smart devices, and RFID technology, are transforming warehouse management systems. Small-scale industries and logistics companies are also adopting these solutions to enhance productivity and reduce costs.

      Additionally, renewable sources, such as solar energy and electric automotive, are being integrated into warehouse operations to promote sustainability. Business analytics, slotting management, yard management, and implementation cost are essential factors influencing the market. The cloud-based system offers flexibility and ease of access, while on-premises WMS ensures data security and control. E-commerce demand and automation technology further drive the market's growth.

      Warehouse Management Systems Market Size

      Get a glance at the market report of share of various segments Request Free Sample

      The Software segment was valued at USD 984.90 billion in 2019 and showed a gradual increase during the forecast period.

      Regional Analysis

      APAC is estimated to contribute 35% to the growth of the global market during the forecast period.Technavio’s analysts have elaborately explained the regional trends and drivers that shape the market during the forecast period.

      Warehouse Management Systems Market Share by Geography

      For more insights on the market size of various regions, Request Free Sample

      The North American the market is experiencing significant growth due to the increasing presence of multinational corporations with extensive warehousing and distribution networks, the expanding regional e-commerce industry, and advancements in third-party logistics (3PL) networks. The transformation of the North American supply chain market is impacting the fundamental aspects of distribution and warehousing in the warehouse management systems sector. This evolution is primarily driven by emerging digital technologies, such as on-premise WMS solutions, digital twin, cloud-based systems, RFID technology, artificial intelligence, and the Internet of Things. These innovations have bridged the gap between supply chain operations and customers, enabling real-time demand influence on order fulfillment.

      The integration of business analytics, slotting management, yard management, web-based portals, and automation technology in warehouse management systems is further enhancing product manufacturers' and logistics companies' capabilities to optimize inbound and outbound freight, manage labor and trade compliance, and ensure real-time visibility into inventory control.

      Market Dynamics

      Our researchers analyzed the data with 2024 as the base year, along with the key drivers, trends, and challenges. A holistic analysis of drivers will help companies refine their marketing strategies to gain a competitive advantage.

      What are the key market drivers leading to the rise in the adoption of Warehouse Management Systems Industry?

      • Rising need for inventory control is the key driver of the market. 
        • The market is experiencing significant growth due to the increasing demand for efficient inventory control. Warehouse management systems are essential software applications that optimize warehouse operations, including inventory management, order fulfillment, and shipping. Effective inventory control is crucial for businesses to maintain the right quantities of products at the right time, ensuring customer satisfaction and reducing costs. As businesses expand their operations and e-commerce continues to thrive, the need for streamlined inventory management becomes even more vital.
        • Warehouse management systems offer real-time inventory visibility, enabling businesses to track inventory movement and optimize warehouse space. By implementing these systems, businesses can increase operational efficiency and reduce costs, ultimately contributing to their overall success.

      What are the market trends shaping the Warehouse Management Systems Industry?

      • Growth of e-commerce is the upcoming market trend. 
        • The market is experiencing significant growth due to the increasing influence of e-commerce. As online shopping gains popularity, businesses are under increasing pressure to efficiently manage their inventory and fulfill orders promptly. Warehouse management systems software automates and optimizes various warehouse processes, from receiving and putting away to picking and shipping, enabling companies to streamline their operations and effectively manage their supply chain.
        • The pandemic has further accelerated the growth of e-commerce, making warehouse management systems an essential tool for businesses to meet customer demand. By implementing these systems, companies can enhance their operational efficiency, reduce errors, and improve customer satisfaction.

      What challenges does the Warehouse Management Systems Industry face during its growth?

      • Implementation cost of on-premises WMS is a key challenge affecting the industry growth. 
        • Warehouse Management Systems (WMS) are essential enterprise software solutions for managing and optimizing the day-to-day operations of a warehouse or distribution center. Two primary pricing models exist for WMS: perpetual licensing and subscription (typically monthly). The choice between these models significantly impacts both preliminary and annual budgets. Perpetual licenses, which are commonly used for on-premise solutions, involve a higher upfront cost but offer greater control and customization. In contrast, subscription models, operating under the Software-as-a-Service (SaaS) model, use the cloud for data storage or processing and require ongoing monthly payments.
        • Organizations and enterprises are responsible for managing and maintaining these systems on their premises with in-house IT staff. The decision between these pricing structures should be based on a thorough of the specific needs and resources of your business.

      Exclusive Customer Landscape

      The warehouse management systems market forecasting report includes the adoption lifecycle of the market, covering from the innovator’s stage to the laggard’s stage. It focuses on adoption rates in different regions based on penetration. Furthermore, the warehouse management systems market report also includes key purchase criteria and drivers of price sensitivity to help companies evaluate and develop their market growth analysis strategies.
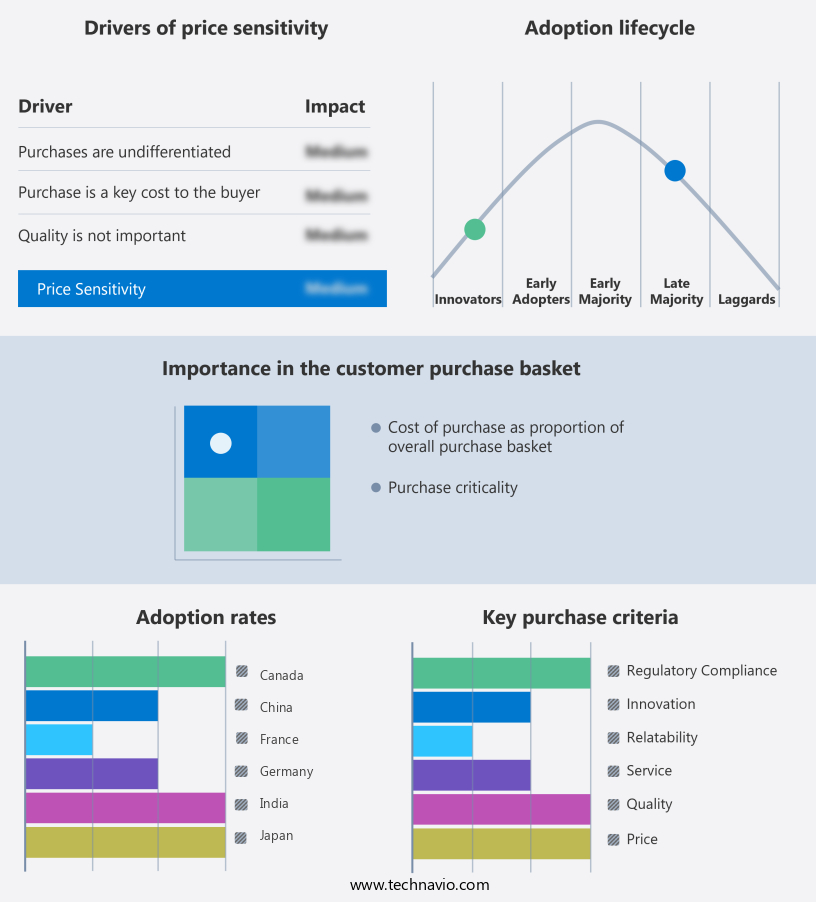
      Warehouse Management Systems Market Share by Geography

       Customer Landscape

      Key Companies & Market Insights

      Companies are implementing various strategies, such as strategic alliances, warehouse management systems market forecast, partnerships, mergers and acquisitions, geographical expansion, and product/service launches, to enhance their presence in the industry.

      3PL Central LLC - Third-party logistics providers require efficient warehouse management solutions to streamline their operations. Our company delivers a comprehensive system, incorporating inventory management, order fulfillment, and billing features, to optimize their logistics processes. This approach enhances search engine visibility and ensures a clear, informative message from a research analyst's perspective. Our warehouse management system is designed to cater to the unique needs of third-party logistics providers, aligning with our commitment to delivering innovative and effective solutions.

      The industry research and growth report includes detailed analyses of the competitive landscape of the market and information about key companies, including:

      • 3PL Central LLC
      • Blue Yonder Inc.
      • Daifuku Co. Ltd.
      • Datapel Systems
      • Epicor Software Corp.
      • Generix Group
      • Infor Inc.
      • Korber Supply Chain Software
      • Manhattan Associates Inc.
      • Mantis Informatics S.A
      • Microsoft (Dynamics 365 SCM)
      • Oracle Corp.
      • PSI Software AG
      • SAP SE
      • Softeon
      • SSI Schafer
      • Tecsys Inc.
      • Vinculum Solutions Pvt. Ltd.

      Qualitative and quantitative analysis of companies has been conducted to help clients understand the wider business environment as well as the strengths and weaknesses of key industry players. Data is qualitatively analyzed to categorize companies as pure play, category-focused, industry-focused, and diversified; it is quantitatively analyzed to categorize companies as dominant, leading, strong, tentative, and weak.

      Research Analyst Overview

      Warehouse Management Systems (WMS) have become an essential component of modern business operations, particularly in industries with high product turnover and complex supply chain models. The market for these systems continues to evolve, driven by digital technologies and the shifting demands of various product markets. Small-scale industries, in particular, have recognized the benefits of implementing WMS solutions to optimize their warehousing facilities. These systems enable efficient inbound and outbound freight management, inventory control, and real-time visibility into stock levels and order fulfillment. Digital technologies, such as business analytics, slotting management, yard management, and web-based portals, have revolutionized the way WMS functions.

      Renewable sources, like solar energy and electric automotive, are also gaining traction in the industry, contributing to more sustainable and cost-effective operations. Logistics companies are increasingly adopting WMS to streamline their operations and improve product delivery speed. Manufacturing companies, too, are recognizing the value of these systems in managing their supply chain models and ensuring trade compliance. The implementation cost of WMS has become a significant consideration for businesses, with cloud deployment becoming a popular option due to its affordability and flexibility. The shift towards cloud-based systems has also facilitated the integration of advanced technologies, such as RFID technology, artificial intelligence, and the Internet of Things (IoT).

      The digital twin, a virtual representation of a physical system, is another emerging trend in the WMS market. This technology enables real-time monitoring and analysis of warehouse operations, allowing for more informed decision-making and improved efficiency. The WMS market is dynamic, with multinational companies leading the charge in innovation and adoption. However, labor restrictions and movement restrictions, due to the ongoing global health crisis, have presented challenges to the industry. Despite these challenges, the market for WMS solutions remains , driven by e-commerce demand and automation technology. Smart devices, such as smart tablets, mobile phones, and handheld devices, have become essential tools for warehouse workers, further enhancing the functionality and accessibility of these systems.

      In , the WMS market is a critical component of modern business operations, driven by digital technologies and the evolving demands of various product markets. The trend towards cloud-based systems and advanced technologies, such as RFID, AI, and IoT, is set to continue, enabling more efficient, sustainable, and cost-effective warehousing solutions.

      Market Scope

      Report Coverage

      Details

      Page number

      246

      Base year

      2024

      Historic period

      2019-2023

      Forecast period

      2025-2029

      Growth momentum & CAGR

      Accelerate at a CAGR of 14.8%

      Market growth 2025-2029

      USD 3874.7 million

      Market structure

      Fragmented

      YoY growth 2024-2025(%)

      12.6

      Key countries

      US, Germany, Canada, China, UK, France, Japan, India, The Netherlands, and South Korea

      Competitive landscape

      Leading Companies, Market Positioning of Companies, Competitive Strategies, and Industry Risks

      Request Free Sample

      What are the Key Data Covered in this Warehouse Management Systems Market Research and Growth Report?

      • CAGR of the Warehouse Management Systems industry during the forecast period
      • Detailed information on factors that will drive the growth and forecasting between 2025 and 2029
      • Precise estimation of the size of the market and its contribution of the industry in focus to the parent market
      • Accurate predictions about upcoming growth and trends and changes in consumer behaviour
      • Growth of the market across North America, Europe, APAC, Middle East and Africa, and South America
      • Thorough analysis of the market’s competitive landscape and detailed information about companies
      • Comprehensive analysis of factors that will challenge the warehouse management systems market growth of industry companies

      We can help! Our analysts can customize this warehouse management systems market research report to meet your requirements.

      Get in touch


      1 Executive Summary

      • 1.1 Market overview
        • Executive Summary - Chart on Market Overview
        • Executive Summary - Data Table on Market Overview
        • Executive Summary - Chart on Global Market Characteristics
        • Executive Summary - Chart on Market by Geography
        • Executive Summary - Chart on Market Segmentation by Component
        • Executive Summary - Chart on Market Segmentation by Application
        • Executive Summary - Chart on Market Segmentation by End-user
        • Executive Summary - Chart on Incremental Growth
        • Executive Summary - Data Table on Incremental Growth
        • Executive Summary - Chart on Company Market Positioning

      2 Technavio Analysis

      • 2.1 Analysis of price sensitivity, lifecycle, customer purchase basket, adoption rates, and purchase criteria
        • Analysis of price sensitivity, lifecycle, customer purchase basket, adoption rates, and purchase criteria
      • 2.2 Criticality of inputs and Factors of differentiation
        • Overview on criticality of inputs and factors of differentiation
      • 2.3 Factors of disruption
        • Overview on factors of disruption
      • 2.4 Impact of drivers and challenges
        • Impact of drivers and challenges in 2024 and 2029

      3 Market Landscape

      • 3.1 Market ecosystem
        • Parent Market
        • Data Table on - Parent Market
      • 3.2 Market characteristics
        • Market characteristics analysis
      • 3.3 Value chain analysis
        • Value chain analysis

      4 Market Sizing

      • 4.1 Market definition
        • Offerings of companies included in the market definition
      • 4.2 Market segment analysis
        • Market segments
      • 4.3 Market size 2024
        • 4.4 Market outlook: Forecast for 2024-2029
          • Chart on Global - Market size and forecast 2024-2029 ($ million)
          • Data Table on Global - Market size and forecast 2024-2029 ($ million)
          • Chart on Global Market: Year-over-year growth 2024-2029 (%)
          • Data Table on Global Market: Year-over-year growth 2024-2029 (%)

        5 Historic Market Size

        • 5.1 Global Warehouse Management Systems Market 2019 - 2023
          • Historic Market Size - Data Table on Global Warehouse Management Systems Market 2019 - 2023 ($ million)
        • 5.2 Component segment analysis 2019 - 2023
          • Historic Market Size - Component Segment 2019 - 2023 ($ million)
        • 5.3 Application segment analysis 2019 - 2023
          • Historic Market Size - Application Segment 2019 - 2023 ($ million)
        • 5.4 End-user segment analysis 2019 - 2023
          • Historic Market Size - End-user Segment 2019 - 2023 ($ million)
        • 5.5 Geography segment analysis 2019 - 2023
          • Historic Market Size - Geography Segment 2019 - 2023 ($ million)
        • 5.6 Country segment analysis 2019 - 2023
          • Historic Market Size - Country Segment 2019 - 2023 ($ million)

        6 Qualitative Analysis

        • 6.1 The AI impact on global warehouse management systems market

          7 Five Forces Analysis

          • 7.1 Five forces summary
            • Five forces analysis - Comparison between 2024 and 2029
          • 7.2 Bargaining power of buyers
            • Bargaining power of buyers - Impact of key factors 2024 and 2029
          • 7.3 Bargaining power of suppliers
            • Bargaining power of suppliers - Impact of key factors in 2024 and 2029
          • 7.4 Threat of new entrants
            • Threat of new entrants - Impact of key factors in 2024 and 2029
          • 7.5 Threat of substitutes
            • Threat of substitutes - Impact of key factors in 2024 and 2029
          • 7.6 Threat of rivalry
            • Threat of rivalry - Impact of key factors in 2024 and 2029
          • 7.7 Market condition
            • Chart on Market condition - Five forces 2024 and 2029

          8 Market Segmentation by Component

          • 8.1 Market segments
            • Chart on Component - Market share 2024-2029 (%)
            • Data Table on Component - Market share 2024-2029 (%)
          • 8.2 Comparison by Component
            • Chart on Comparison by Component
            • Data Table on Comparison by Component
          • 8.3 Software - Market size and forecast 2024-2029
            • Chart on Software - Market size and forecast 2024-2029 ($ million)
            • Data Table on Software - Market size and forecast 2024-2029 ($ million)
            • Chart on Software - Year-over-year growth 2024-2029 (%)
            • Data Table on Software - Year-over-year growth 2024-2029 (%)
          • 8.4 Hardware - Market size and forecast 2024-2029
            • Chart on Hardware - Market size and forecast 2024-2029 ($ million)
            • Data Table on Hardware - Market size and forecast 2024-2029 ($ million)
            • Chart on Hardware - Year-over-year growth 2024-2029 (%)
            • Data Table on Hardware - Year-over-year growth 2024-2029 (%)
          • 8.5 Integrated WMS software - Market size and forecast 2024-2029
            • Chart on Integrated WMS software - Market size and forecast 2024-2029 ($ million)
            • Data Table on Integrated WMS software - Market size and forecast 2024-2029 ($ million)
            • Chart on Integrated WMS software - Year-over-year growth 2024-2029 (%)
            • Data Table on Integrated WMS software - Year-over-year growth 2024-2029 (%)
          • 8.6 Services - Market size and forecast 2024-2029
            • Chart on Services - Market size and forecast 2024-2029 ($ million)
            • Data Table on Services - Market size and forecast 2024-2029 ($ million)
            • Chart on Services - Year-over-year growth 2024-2029 (%)
            • Data Table on Services - Year-over-year growth 2024-2029 (%)
          • 8.7 Others - Market size and forecast 2024-2029
            • Chart on Others - Market size and forecast 2024-2029 ($ million)
            • Data Table on Others - Market size and forecast 2024-2029 ($ million)
            • Chart on Others - Year-over-year growth 2024-2029 (%)
            • Data Table on Others - Year-over-year growth 2024-2029 (%)
          • 8.8 Market opportunity by Component
            • Market opportunity by Component ($ million)
            • Data Table on Market opportunity by Component ($ million)

          9 Market Segmentation by Application

          • 9.1 Market segments
            • Chart on Application - Market share 2024-2029 (%)
            • Data Table on Application - Market share 2024-2029 (%)
          • 9.2 Comparison by Application
            • Chart on Comparison by Application
            • Data Table on Comparison by Application
          • 9.3 Inventory management - Market size and forecast 2024-2029
            • Chart on Inventory management - Market size and forecast 2024-2029 ($ million)
            • Data Table on Inventory management - Market size and forecast 2024-2029 ($ million)
            • Chart on Inventory management - Year-over-year growth 2024-2029 (%)
            • Data Table on Inventory management - Year-over-year growth 2024-2029 (%)
          • 9.4 Supply chain management - Market size and forecast 2024-2029
            • Chart on Supply chain management - Market size and forecast 2024-2029 ($ million)
            • Data Table on Supply chain management - Market size and forecast 2024-2029 ($ million)
            • Chart on Supply chain management - Year-over-year growth 2024-2029 (%)
            • Data Table on Supply chain management - Year-over-year growth 2024-2029 (%)
          • 9.5 Purchase and order management - Market size and forecast 2024-2029
            • Chart on Purchase and order management - Market size and forecast 2024-2029 ($ million)
            • Data Table on Purchase and order management - Market size and forecast 2024-2029 ($ million)
            • Chart on Purchase and order management - Year-over-year growth 2024-2029 (%)
            • Data Table on Purchase and order management - Year-over-year growth 2024-2029 (%)
          • 9.6 Asset management - Market size and forecast 2024-2029
            • Chart on Asset management - Market size and forecast 2024-2029 ($ million)
            • Data Table on Asset management - Market size and forecast 2024-2029 ($ million)
            • Chart on Asset management - Year-over-year growth 2024-2029 (%)
            • Data Table on Asset management - Year-over-year growth 2024-2029 (%)
          • 9.7 Others - Market size and forecast 2024-2029
            • Chart on Others - Market size and forecast 2024-2029 ($ million)
            • Data Table on Others - Market size and forecast 2024-2029 ($ million)
            • Chart on Others - Year-over-year growth 2024-2029 (%)
            • Data Table on Others - Year-over-year growth 2024-2029 (%)
          • 9.8 Market opportunity by Application
            • Market opportunity by Application ($ million)
            • Data Table on Market opportunity by Application ($ million)

          10 Market Segmentation by End-user

          • 10.1 Market segments
            • Chart on End-user - Market share 2024-2029 (%)
            • Data Table on End-user - Market share 2024-2029 (%)
          • 10.2 Comparison by End-user
            • Chart on Comparison by End-user
            • Data Table on Comparison by End-user
          • 10.3 Retail and consumer goods - Market size and forecast 2024-2029
            • Chart on Retail and consumer goods - Market size and forecast 2024-2029 ($ million)
            • Data Table on Retail and consumer goods - Market size and forecast 2024-2029 ($ million)
            • Chart on Retail and consumer goods - Year-over-year growth 2024-2029 (%)
            • Data Table on Retail and consumer goods - Year-over-year growth 2024-2029 (%)
          • 10.4 Transport and logistics - Market size and forecast 2024-2029
            • Chart on Transport and logistics - Market size and forecast 2024-2029 ($ million)
            • Data Table on Transport and logistics - Market size and forecast 2024-2029 ($ million)
            • Chart on Transport and logistics - Year-over-year growth 2024-2029 (%)
            • Data Table on Transport and logistics - Year-over-year growth 2024-2029 (%)
          • 10.5 Automotive - Market size and forecast 2024-2029
            • Chart on Automotive - Market size and forecast 2024-2029 ($ million)
            • Data Table on Automotive - Market size and forecast 2024-2029 ($ million)
            • Chart on Automotive - Year-over-year growth 2024-2029 (%)
            • Data Table on Automotive - Year-over-year growth 2024-2029 (%)
          • 10.6 Healthcare and pharmaceuticals - Market size and forecast 2024-2029
            • Chart on Healthcare and pharmaceuticals - Market size and forecast 2024-2029 ($ million)
            • Data Table on Healthcare and pharmaceuticals - Market size and forecast 2024-2029 ($ million)
            • Chart on Healthcare and pharmaceuticals - Year-over-year growth 2024-2029 (%)
            • Data Table on Healthcare and pharmaceuticals - Year-over-year growth 2024-2029 (%)
          • 10.7 Others - Market size and forecast 2024-2029
            • Chart on Others - Market size and forecast 2024-2029 ($ million)
            • Data Table on Others - Market size and forecast 2024-2029 ($ million)
            • Chart on Others - Year-over-year growth 2024-2029 (%)
            • Data Table on Others - Year-over-year growth 2024-2029 (%)
          • 10.8 Market opportunity by End-user
            • Market opportunity by End-user ($ million)
            • Data Table on Market opportunity by End-user ($ million)

          11 Customer Landscape

          • 11.1 Customer landscape overview
            • Analysis of price sensitivity, lifecycle, customer purchase basket, adoption rates, and purchase criteria

          12 Geographic Landscape

          • 12.1 Geographic segmentation
            • Chart on Market share by geography 2024-2029 (%)
            • Data Table on Market share by geography 2024-2029 (%)
          • 12.2 Geographic comparison
            • Chart on Geographic comparison
            • Data Table on Geographic comparison
          • 12.3 North America - Market size and forecast 2024-2029
            • Chart on North America - Market size and forecast 2024-2029 ($ million)
            • Data Table on North America - Market size and forecast 2024-2029 ($ million)
            • Chart on North America - Year-over-year growth 2024-2029 (%)
            • Data Table on North America - Year-over-year growth 2024-2029 (%)
          • 12.4 Europe - Market size and forecast 2024-2029
            • Chart on Europe - Market size and forecast 2024-2029 ($ million)
            • Data Table on Europe - Market size and forecast 2024-2029 ($ million)
            • Chart on Europe - Year-over-year growth 2024-2029 (%)
            • Data Table on Europe - Year-over-year growth 2024-2029 (%)
          • 12.5 APAC - Market size and forecast 2024-2029
            • Chart on APAC - Market size and forecast 2024-2029 ($ million)
            • Data Table on APAC - Market size and forecast 2024-2029 ($ million)
            • Chart on APAC - Year-over-year growth 2024-2029 (%)
            • Data Table on APAC - Year-over-year growth 2024-2029 (%)
          • 12.6 Middle East and Africa - Market size and forecast 2024-2029
            • Chart on Middle East and Africa - Market size and forecast 2024-2029 ($ million)
            • Data Table on Middle East and Africa - Market size and forecast 2024-2029 ($ million)
            • Chart on Middle East and Africa - Year-over-year growth 2024-2029 (%)
            • Data Table on Middle East and Africa - Year-over-year growth 2024-2029 (%)
          • 12.7 South America - Market size and forecast 2024-2029
            • Chart on South America - Market size and forecast 2024-2029 ($ million)
            • Data Table on South America - Market size and forecast 2024-2029 ($ million)
            • Chart on South America - Year-over-year growth 2024-2029 (%)
            • Data Table on South America - Year-over-year growth 2024-2029 (%)
          • 12.8 US - Market size and forecast 2024-2029
            • Chart on US - Market size and forecast 2024-2029 ($ million)
            • Data Table on US - Market size and forecast 2024-2029 ($ million)
            • Chart on US - Year-over-year growth 2024-2029 (%)
            • Data Table on US - Year-over-year growth 2024-2029 (%)
          • 12.9 Germany - Market size and forecast 2024-2029
            • Chart on Germany - Market size and forecast 2024-2029 ($ million)
            • Data Table on Germany - Market size and forecast 2024-2029 ($ million)
            • Chart on Germany - Year-over-year growth 2024-2029 (%)
            • Data Table on Germany - Year-over-year growth 2024-2029 (%)
          • 12.10 China - Market size and forecast 2024-2029
            • Chart on China - Market size and forecast 2024-2029 ($ million)
            • Data Table on China - Market size and forecast 2024-2029 ($ million)
            • Chart on China - Year-over-year growth 2024-2029 (%)
            • Data Table on China - Year-over-year growth 2024-2029 (%)
          • 12.11 Canada - Market size and forecast 2024-2029
            • Chart on Canada - Market size and forecast 2024-2029 ($ million)
            • Data Table on Canada - Market size and forecast 2024-2029 ($ million)
            • Chart on Canada - Year-over-year growth 2024-2029 (%)
            • Data Table on Canada - Year-over-year growth 2024-2029 (%)
          • 12.12 UK - Market size and forecast 2024-2029
            • Chart on UK - Market size and forecast 2024-2029 ($ million)
            • Data Table on UK - Market size and forecast 2024-2029 ($ million)
            • Chart on UK - Year-over-year growth 2024-2029 (%)
            • Data Table on UK - Year-over-year growth 2024-2029 (%)
          • 12.13 Japan - Market size and forecast 2024-2029
            • Chart on Japan - Market size and forecast 2024-2029 ($ million)
            • Data Table on Japan - Market size and forecast 2024-2029 ($ million)
            • Chart on Japan - Year-over-year growth 2024-2029 (%)
            • Data Table on Japan - Year-over-year growth 2024-2029 (%)
          • 12.14 France - Market size and forecast 2024-2029
            • Chart on France - Market size and forecast 2024-2029 ($ million)
            • Data Table on France - Market size and forecast 2024-2029 ($ million)
            • Chart on France - Year-over-year growth 2024-2029 (%)
            • Data Table on France - Year-over-year growth 2024-2029 (%)
          • 12.15 India - Market size and forecast 2024-2029
            • Chart on India - Market size and forecast 2024-2029 ($ million)
            • Data Table on India - Market size and forecast 2024-2029 ($ million)
            • Chart on India - Year-over-year growth 2024-2029 (%)
            • Data Table on India - Year-over-year growth 2024-2029 (%)
          • 12.16 South Korea - Market size and forecast 2024-2029
            • Chart on South Korea - Market size and forecast 2024-2029 ($ million)
            • Data Table on South Korea - Market size and forecast 2024-2029 ($ million)
            • Chart on South Korea - Year-over-year growth 2024-2029 (%)
            • Data Table on South Korea - Year-over-year growth 2024-2029 (%)
          • 12.17 The Netherlands - Market size and forecast 2024-2029
            • Chart on The Netherlands - Market size and forecast 2024-2029 ($ million)
            • Data Table on The Netherlands - Market size and forecast 2024-2029 ($ million)
            • Chart on The Netherlands - Year-over-year growth 2024-2029 (%)
            • Data Table on The Netherlands - Year-over-year growth 2024-2029 (%)
          • 12.18 Market opportunity by geography
            • Market opportunity by geography ($ million)
            • Data Tables on Market opportunity by geography ($ million)

          13 Drivers, Challenges, and Opportunity/Restraints

          • 13.1 Market drivers
            • 13.2 Market challenges
              • 13.3 Impact of drivers and challenges
                • Impact of drivers and challenges in 2024 and 2029
              • 13.4 Market opportunities/restraints

                14 Competitive Landscape

                • 14.1 Overview
                  • 14.2 Competitive Landscape
                    • Overview on criticality of inputs and factors of differentiation
                  • 14.3 Landscape disruption
                    • Overview on factors of disruption
                  • 14.4 Industry risks
                    • Impact of key risks on business

                  15 Competitive Analysis

                  • 15.1 Companies profiled
                    • Companies covered
                  • 15.2 Market positioning of companies
                    • Matrix on companies position and classification
                  • 3PL Central LLC
                    • 3PL Central LLC - Overview
                    • 3PL Central LLC - Product / Service
                    • 3PL Central LLC - Key offerings
                  • 15.4 Blue Yonder Inc.
                    • Blue Yonder Inc. - Overview
                    • Blue Yonder Inc. - Product / Service
                    • Blue Yonder Inc. - Key offerings
                  • 15.5 Daifuku Co. Ltd.
                    • Daifuku Co. Ltd. - Overview
                    • Daifuku Co. Ltd. - Product / Service
                    • Daifuku Co. Ltd. - Key offerings
                  • 15.6 Datapel Systems
                    • Datapel Systems - Overview
                    • Datapel Systems - Product / Service
                    • Datapel Systems - Key offerings
                  • 15.7 Epicor Software Corp.
                    • Epicor Software Corp. - Overview
                    • Epicor Software Corp. - Product / Service
                    • Epicor Software Corp. - Key offerings
                  • 15.8 Generix Group
                    • Generix Group - Overview
                    • Generix Group - Product / Service
                    • Generix Group - Key offerings
                  • 15.9 Infor Inc.
                    • Infor Inc. - Overview
                    • Infor Inc. - Product / Service
                    • Infor Inc. - Key offerings
                  • 15.10 Korber Supply Chain Software
                    • Korber Supply Chain Software - Overview
                    • Korber Supply Chain Software - Product / Service
                    • Korber Supply Chain Software - Key offerings
                  • 15.11 Manhattan Associates Inc.
                    • Manhattan Associates Inc. - Overview
                    • Manhattan Associates Inc. - Product / Service
                    • Manhattan Associates Inc. - Key offerings
                  • 15.12 Mantis Informatics S.A
                    • Mantis Informatics S.A - Overview
                    • Mantis Informatics S.A - Product / Service
                    • Mantis Informatics S.A - Key offerings
                  • 15.13 Microsoft (Dynamics 365 SCM)
                    • Microsoft (Dynamics 365 SCM) - Overview
                    • Microsoft (Dynamics 365 SCM) - Product / Service
                    • Microsoft (Dynamics 365 SCM) - Key offerings
                  • 15.14 Oracle Corp.
                    • Oracle Corp. - Overview
                    • Oracle Corp. - Product / Service
                    • Oracle Corp. - Key offerings
                  • 15.15 PSI Software AG
                    • PSI Software AG - Overview
                    • PSI Software AG - Product / Service
                    • PSI Software AG - Key offerings
                  • 15.16 SAP SE
                    • SAP SE - Overview
                    • SAP SE - Product / Service
                    • SAP SE - Key offerings
                  • 15.17 Softeon
                    • Softeon - Overview
                    • Softeon - Product / Service
                    • Softeon - Key offerings
                  • 15.18 SSI Schafer
                    • SSI Schafer - Overview
                    • SSI Schafer - Product / Service
                    • SSI Schafer - Key offerings
                  • 15.19 Tecsys Inc.
                    • Tecsys Inc. - Overview
                    • Tecsys Inc. - Product / Service
                    • Tecsys Inc. - Key offerings
                  • 15.20 Vinculum Solutions Pvt. Ltd.
                    • Vinculum Solutions Pvt. Ltd. - Overview
                    • Vinculum Solutions Pvt. Ltd. - Product / Service
                    • Vinculum Solutions Pvt. Ltd. - Key offerings

                  16 Appendix

                  • 16.1 Scope of the report
                    • 16.2 Inclusions and exclusions checklist
                      • Inclusions checklist
                      • Exclusions checklist
                    • 16.3 Currency conversion rates for US$
                      • Currency conversion rates for US$
                    • 16.4 Research methodology
                      • Research methodology
                    • 16.5 Data procurement
                      • Information sources
                    • 16.6 Data validation
                      • Data validation
                    • 16.7 Validation techniques employed for market sizing
                      • Validation techniques employed for market sizing
                    • 16.8 Data synthesis
                      • Data synthesis
                    • 16.9 360 degree market analysis
                      • 360 degree market analysis
                    • 16.10 List of abbreviations
                      • List of abbreviations

                    Research Methodology

                    Technavio presents a detailed picture of the market by way of study, synthesis, and summation of data from multiple sources. The analysts have presented the various facets of the market with a particular focus on identifying the key industry influencers. The data thus presented is comprehensive, reliable, and the result of extensive research, both primary and secondary.

                    INFORMATION SOURCES

                    Primary sources

                    • Manufacturers and suppliers
                    • Channel partners
                    • Industry experts
                    • Strategic decision makers

                    Secondary sources

                    • Industry journals and periodicals
                    • Government data
                    • Financial reports of key industry players
                    • Historical data
                    • Press releases

                    DATA ANALYSIS

                    Data Synthesis

                    • Collation of data
                    • Estimation of key figures
                    • Analysis of derived insights

                    Data Validation

                    • Triangulation with data models
                    • Reference against proprietary databases
                    • Corroboration with industry experts

                    REPORT WRITING

                    Qualitative

                    • Market drivers
                    • Market challenges
                    • Market trends
                    • Five forces analysis

                    Quantitative

                    • Market size and forecast
                    • Market segmentation
                    • Geographical insights
                    • Competitive landscape

                    Interested in this report?

                    Get your sample now to see our research methodology and insights!

                    Download Now

                    Frequently Asked Questions

                    Warehouse Management Systems market growth will increase by $ 3874.7 mn during 2025-2029 .

                    The Warehouse Management Systems market is expected to grow at a CAGR of 14.8% during 2025-2029 .

                    Warehouse Management Systems market is segmented by Component( Software, Hardware, Integrated WMS software, Services, Others) Application( Inventory management, Supply chain management, Purchase and order management, Asset management, Others) End-user( Retail and consumer goods, Transport and logistics, Automotive, Healthcare and pharmaceuticals, Others)

                    3PL Central LLC, Blue Yonder Inc., Daifuku Co. Ltd., Datapel Systems, Epicor Software Corp., Generix Group, Infor Inc., Korber Supply Chain Software, Manhattan Associates Inc., Mantis Informatics S.A, Microsoft (Dynamics 365 SCM), Oracle Corp., PSI Software AG, SAP SE, Softeon, SSI Schafer, Tecsys Inc., Vinculum Solutions Pvt. Ltd. are a few of the key vendors in the Warehouse Management Systems market.

                    APAC will register the highest growth rate of 35% among the other regions. Therefore, the Warehouse Management Systems market in APAC is expected to garner significant business opportunities for the vendors during the forecast period.

                    US, Germany, Canada, China, UK, France, Japan, India, The Netherlands, South Korea

                    • Rising need for inventory controlThe rising need for inventory control is a significant driver of the global warehouse management systems market. Warehouse management systems are software applications designed to manage and optimize warehouse operations is the driving factor this market.
                    • including inventory control is the driving factor this market.
                    • order fulfillment is the driving factor this market.
                    • and shipping. Effective inventory control is essential for any business to ensure that it has the right products in the right quantities available at the right time. By implementing a warehouse management system is the driving factor this market.
                    • businesses can gain real-time visibility into their inventory levels is the driving factor this market.
                    • track inventory movement is the driving factor this market.
                    • and optimize their warehouse space to increase efficiency and reduce costs.As businesses continue to expand their operations globally and e-commerce continues to grow is the driving factor this market.
                    • the demand for effective inventory control is increasing. Hence is the driving factor this market.
                    • this has led to a rise in the adoption of warehouse management systems by businesses of all sizes is the driving factor this market.
                    • leading to the growth of the global warehouse management systems market in the forecast period. is the driving factor this market.

                    The Warehouse Management Systems market vendors should focus on grabbing business opportunities from the Software segment as it accounted for the largest market share in the base year.