Water Parks Market Analysis, Size, and Forecast 2026-2030: North America (US, Canada, and Mexico), APAC (China, Japan, and India), Europe (Germany, UK, and France), Middle East and Africa (Saudi Arabia, UAE, and South Africa), South America (Brazil, Argentina, and Colombia), and Rest of World (ROW)

Water Parks Market Analysis, Size, and Forecast 2026-2030:
North America (US, Canada, and Mexico), APAC (China, Japan, and India), Europe (Germany, UK, and France), Middle East and Africa (Saudi Arabia, UAE, and South Africa), South America (Brazil, Argentina, and Colombia), and Rest of World (ROW)

Published: Apr 2026 309 Pages SKU: IRTNTR81414

Market Overview at a Glance

$3.28 B
Market Opportunity
7.8%
CAGR 2025 - 2030
33.8%
APAC Growth
$3.34 B
Outdoor water parks segment 2024

Water Parks Market Size 2026-2030

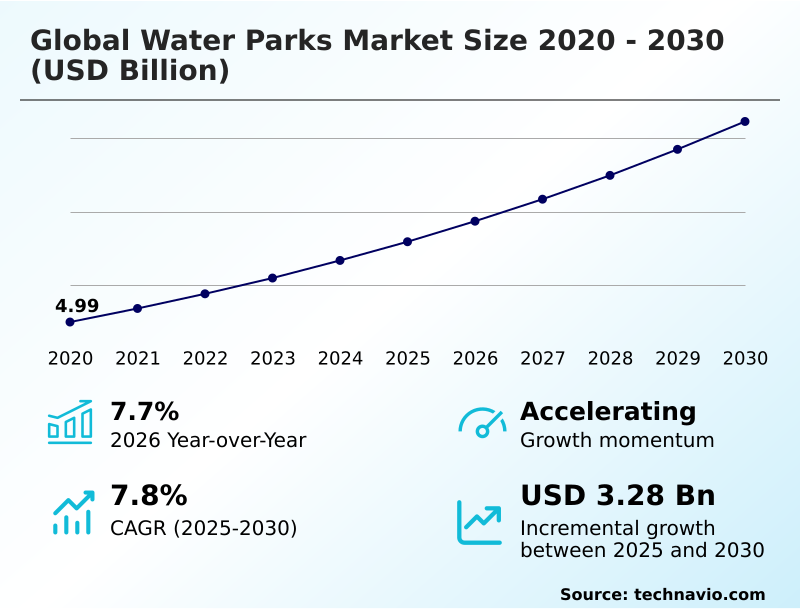
The water parks market size is valued to increase by USD 3.28 billion, at a CAGR of 7.8% from 2025 to 2030. Expansion of global travel and tourism sector and experiential leisure will drive the water parks market.

Major Market Trends & Insights

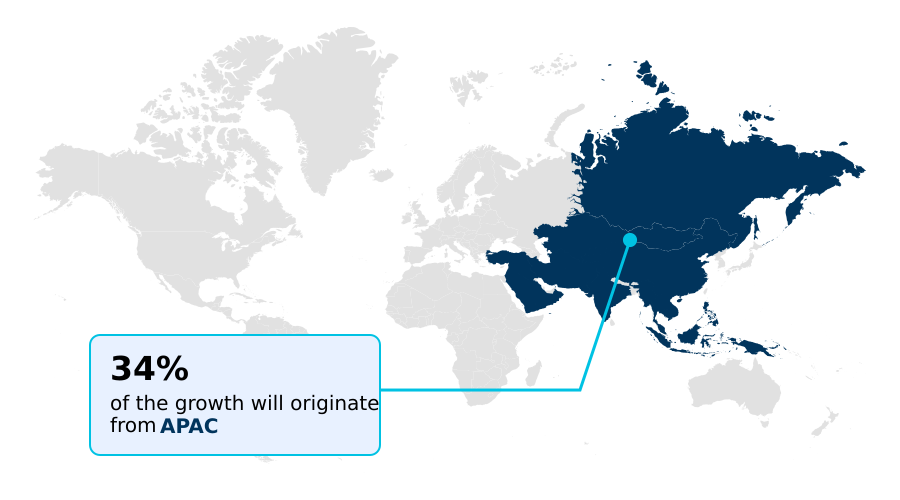
  • APAC dominated the market and accounted for a 33.8% growth during the forecast period.
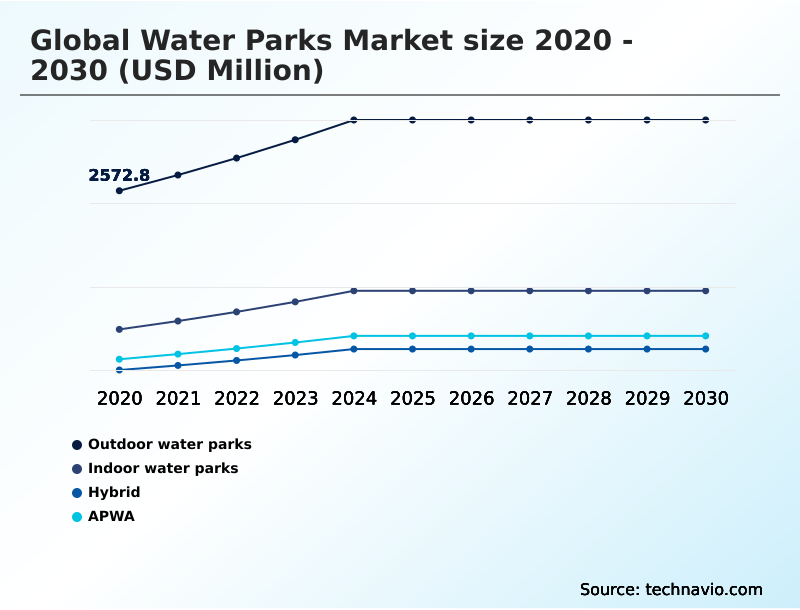
  • By Type - Outdoor water parks segment was valued at USD 3.34 billion in 2024
  • By Revenue Stream - Ticket sales segment accounted for the largest market revenue share in 2024

Market Size & Forecast

  • Market Opportunities: USD 5.47 billion
  • Market Future Opportunities: USD 3.28 billion
  • CAGR from 2025 to 2030 : 7.8%

Market Summary

  • The Water Parks Market is defined by a continuous push for innovation, balancing high-thrill attractions with operational efficiency. A core driver is the consumer shift toward experiential leisure, which has moved the industry beyond simple recreation to creating immersive, all-in-one entertainment hubs.
  • This is achieved through sophisticated thematic design integration and the deployment of advanced technologies like high-intensity propulsion systems and augmented reality slides. However, the industry grapples with significant capital expenditure management hurdles and the complexities of seasonal revenue volatility. In a typical business scenario, an operator leverages guest data analytics to implement dynamic pricing models.
  • This strategy helps manage crowd flow during peak times and optimizes ancillary revenue generation from services like gourmet dining options and luxury private cabanas, thereby maximizing profitability for the integrated resort experience. The focus on safety remains paramount, with advancements in automated monitoring systems and water treatment chemicals becoming standard.
  • As the market matures, the ability to deliver a unique, safe, and digitally connected experience will determine long-term success.

What will be the Size of the Water Parks Market during the forecast period?

Get Key Insights on Market Forecast (PDF) Request Free Sample

How is the Water Parks Market Segmented?

The water parks industry research report provides comprehensive data (region-wise segment analysis), with forecasts and estimates in "USD million" for the period 2026-2030, as well as historical data from 2020-2024 for the following segments.

  • Type
    • Outdoor water parks
    • Indoor water parks
    • APWA
    • Hybrid
  • Revenue stream
    • Ticket sales
    • Food and beverage
    • Hotel and resorts
    • Merchandise
    • Others
  • Ownership
    • Private owned
    • Public
    • Public private partnerships
  • Geography
    • North America
      • US
      • Canada
      • Mexico
    • APAC
      • China
      • Japan
      • India
    • Europe
      • Germany
      • UK
      • France
    • Middle East and Africa
      • Saudi Arabia
      • UAE
      • South Africa
    • South America
      • Brazil
      • Argentina
      • Colombia
    • Rest of World (ROW)

By Type Insights

The outdoor water parks segment is estimated to witness significant growth during the forecast period.

Outdoor water parks represent the industry's traditional segment, leveraging expansive land areas for high-capacity attractions. These seasonal aquatic facilities are engineered with robust filtration, using both ultraviolet filtration and ozone filtration systems, and must withstand environmental exposure.

The operational model faces challenges from weather dependency, prompting investment in water reclamation technology to improve efficiency. For instance, advanced water circulation systems have demonstrated the ability to reduce energy consumption by up to 30%.

To enhance guest experience and ancillary revenue generation, operators are integrating radio frequency identification for streamlined access and payments, alongside dynamic pricing models to manage crowd flow.

The deployment of computer vision monitoring for aquatic play systems and other high-capacity attractions is also becoming a standard for safety and operational oversight.

Request Free Sample

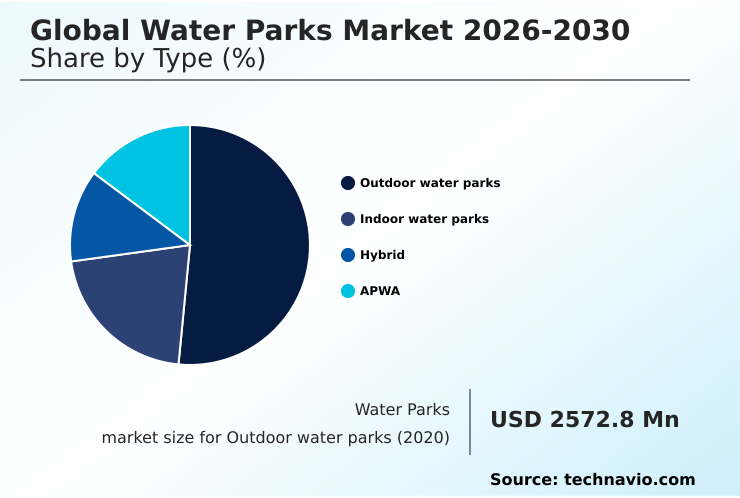
The Outdoor water parks segment was valued at USD 3.34 billion in 2024 and showed a gradual increase during the forecast period.

Request Free Sample

Regional Analysis

APAC is estimated to contribute 33.8% to the growth of the global market during the forecast period.Technavio’s analysts have elaborately explained the regional trends and drivers that shape the market during the forecast period.

See How Water Parks Market Demand is Rising in APAC Request Free Sample

The geographic landscape of the market is dual-faceted, defined by modernization in mature regions and explosive growth in emerging territories.

North America, with a market share of 33.76%, focuses on retrofitting existing amusement parks with water attractions and installing retractable roof enclosures to enable year-round operation.

In contrast, the APAC region, which is projected to account for 33.77% of market growth, is characterized by the development of massive new aquatic complex projects, often through public private partnerships.

These new destination resorts are key components of urban leisure integration. In these regions, a decentralized solar thermal grid or closed-loop water systems are often incorporated from the design phase to manage operational costs.

This regional diversification, with its focus on multi-generational appeal, ensures a robust and expanding global footprint.

Market Dynamics

Our researchers analyzed the data with 2025 as the base year, along with the key drivers, trends, and challenges. A holistic analysis of drivers will help companies refine their marketing strategies to gain a competitive advantage.

  • Strategic development in the water parks market is increasingly multifaceted, considering not only attractions but also operational and business model innovations. Understanding the impact of hydraulic engineering on water coaster design is crucial for creating thrilling yet safe experiences. Simultaneously, the integration of rfid technology for cashless water park transactions has become standard for improving guest spending and operational flow.
  • Digital integration for enhanced guest experiences now includes augmented reality integration in modern water slides and AI applications for water park crowd management. On the operational side, the benefits of uv and ozone water filtration systems are weighed against their costs, while strategies for managing high capital expenditure in parks remain a central boardroom concern.
  • The challenges of seasonal revenue in outdoor water parks are being mitigated by new indoor water park design for year-round revenue. Integrated resort strategies for water park success often involve the premiumization trends in water park hospitality and leveraging the role of IP in water park theming and marketing.
  • The growth in emerging economies underscores the impact of urbanization on water park development, with many operators now developing water parks in emerging tourism markets, sometimes through public-private partnerships for municipal water park projects. This growth is underpinned by technological innovations driving water park attractions and a focus on safety technology advancements in aquatic facilities.
  • Firms that succeed are those that master a complex model, comparing outdoor indoor and hybrid water park models while managing operational costs in water park facilities and embracing sustainability practices in water park resource management. Parks adopting advanced safety systems have seen incident rates drop by more than 20% compared to those with traditional protocols.

What are the key market drivers leading to the rise in the adoption of Water Parks Industry?

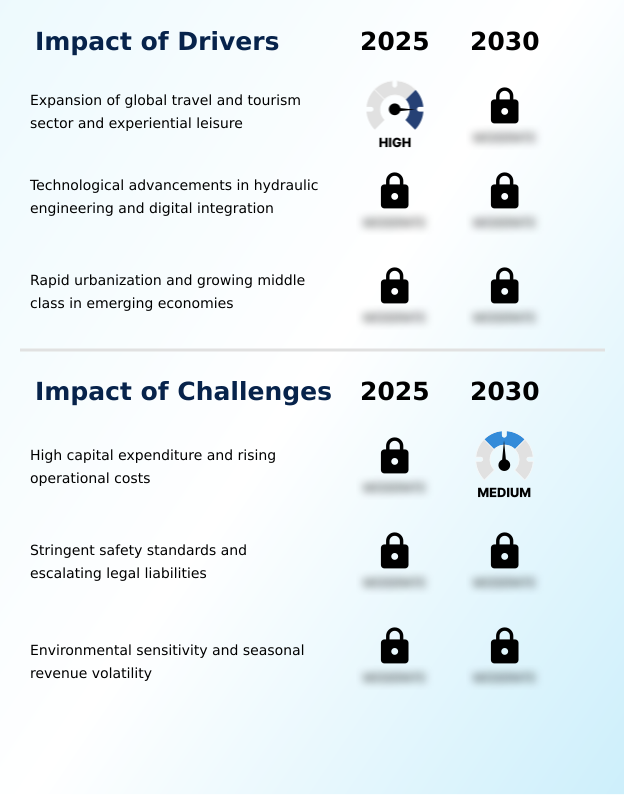
  • The expansion of the global travel and tourism sector, coupled with growing consumer demand for experiential leisure, serves as a key driver for market growth.

  • Market growth is significantly propelled by technological advancements in ride engineering and a consumer shift toward immersive entertainment.
  • Innovations in hydraulic engineering and water propulsion systems, including linear induction motors and electromagnetic propulsion, have enabled the creation of faster and more complex water coasters. These high-thrill water slides are central to the modern park's appeal.
  • The industry is capitalizing on the demand for experiential leisure by creating all-in-one entertainment hubs with strong thematic design integration. These high-thrill attractions are pivotal for attracting the family-oriented vacation market.
  • Furthermore, the use of guest data analytics allows for optimized park layouts and tailored marketing, which has led to operational efficiency gains, including a 10% improvement in resource allocation at some facilities.

What are the market trends shaping the Water Parks Industry?

  • The prioritization of sustainability and environmental engineering is an emerging market trend. This shift is influencing design, operations, and long-term investment strategies across the industry.

  • Key trends are reshaping the market, with a strong emphasis on sustainability and digital immersion. The move toward carbon-neutral operations is driving the adoption of sustainable building materials and circular energy systems. New facilities are incorporating biological water purification and high-capacity heat exchangers, with some advanced systems reducing heating energy needs by up to 25%.
  • This premiumization trend extends to the guest experience, with operators introducing luxury private cabanas and gourmet dining options. Digitally, guest engagement platforms are becoming standard, enabling cashless transactions and virtual queuing systems to manage visitor flow.
  • The integration of digital projection mapping and augmented reality slides is transforming passive rides into interactive adventures, a strategy that has been shown to increase repeat visitation rates by 15% in targeted demographics.

What challenges does the Water Parks Industry face during its growth?

  • High capital expenditure requirements and rising operational costs present a key challenge affecting the industry's growth trajectory and profitability.

  • The market faces considerable financial and operational hurdles that temper growth. The primary challenge is high capital expenditure management for constructing attractions that use high-intensity propulsion systems and gravity-driven aquatic slides, compounded by the ongoing cost of water treatment chemicals and rigorous structural inspections. This creates significant seasonal revenue volatility, as high fixed costs persist during off-peak periods.
  • Legal liability mitigation is another critical concern, driving investment in automated monitoring systems, computerized surveillance, and aquatic emergency response protocols, with some systems reducing incident response times by 40%.
  • Additionally, environmental sensitivity and the demands of seasonal staffing management require sophisticated asset management strategies to ensure long-term viability, as inefficient water management can increase operational costs by up to 20% in arid regions.

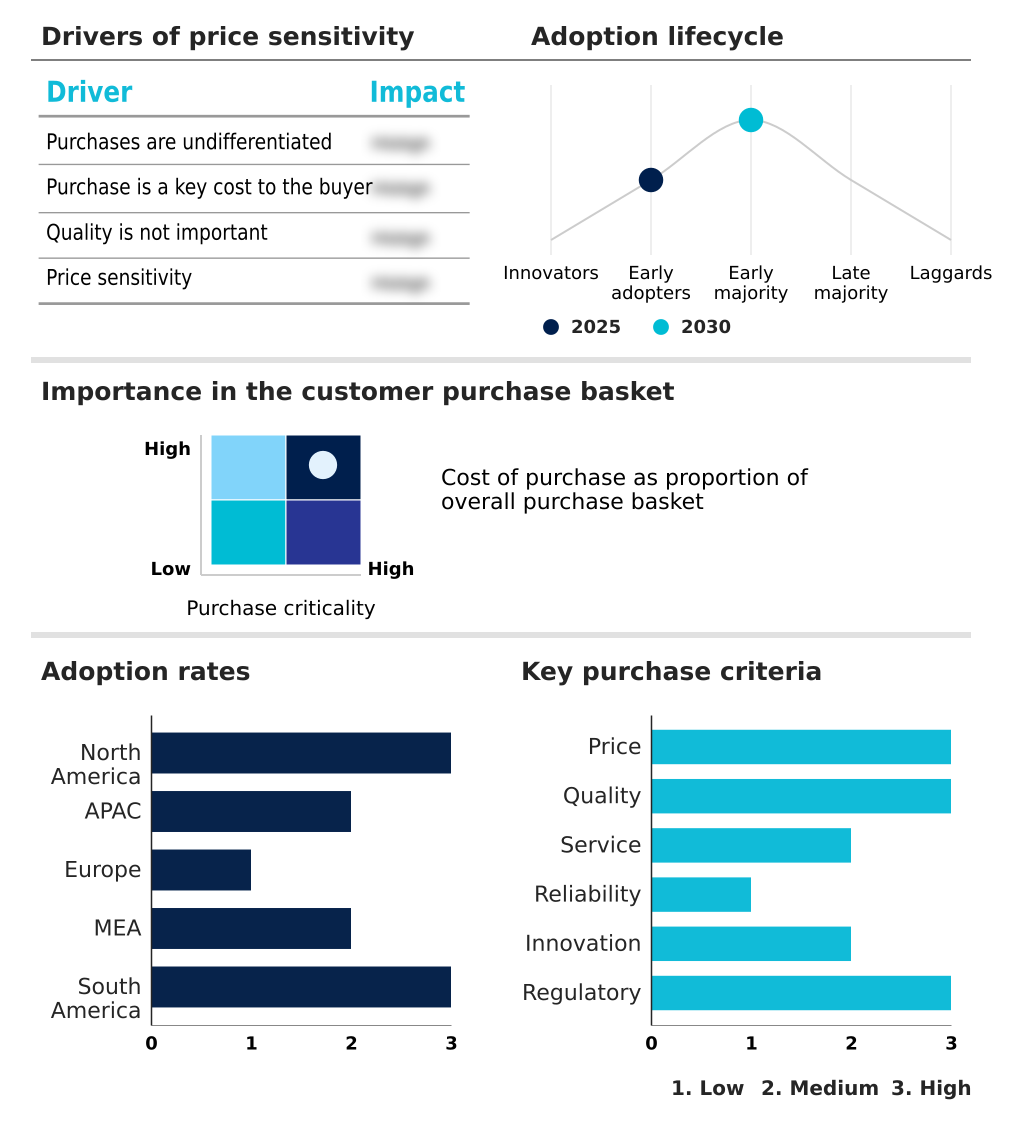
Exclusive Technavio Analysis on Customer Landscape

The water parks market forecasting report includes the adoption lifecycle of the market, covering from the innovator’s stage to the laggard’s stage. It focuses on adoption rates in different regions based on penetration. Furthermore, the water parks market report also includes key purchase criteria and drivers of price sensitivity to help companies evaluate and develop their market growth analysis strategies.

Customer Landscape of Water Parks Industry

Competitive Landscape

Companies are implementing various strategies, such as strategic alliances, water parks market forecast, partnerships, mergers and acquisitions, geographical expansion, and product/service launches, to enhance their presence in the industry.

Arihant Industrial Corp Ltd. - Specializes in the design and manufacture of water slides and comprehensive aquatic playground systems for the global amusement and leisure markets.

The industry research and growth report includes detailed analyses of the competitive landscape of the market and information about key companies, including:

  • Arihant Industrial Corp Ltd.
  • Aspro Parks SA
  • Chimelong Group Co. Ltd.
  • Cloward H2O
  • FLUIDRA SA
  • FORREC Ltd.
  • Great Wolf Resorts Inc.
  • Kerzner International Ltd.
  • Merlin Entertainments Ltd.
  • Murphys Waves Ltd.
  • OpenAire Inc.
  • Parques Reunidos SAU
  • Polin Waterparks
  • ProSlide Technology Inc.
  • Six Flags Entertainment Corp.
  • Splashtacular LLC.
  • United Parks and Resorts Inc.
  • Vortex International
  • WhiteWater West Industries Ltd
  • Wiegand.Waterrides Gmbh.

Qualitative and quantitative analysis of companies has been conducted to help clients understand the wider business environment as well as the strengths and weaknesses of key industry players. Data is qualitatively analyzed to categorize companies as pure play, category-focused, industry-focused, and diversified; it is quantitatively analyzed to categorize companies as dominant, leading, strong, tentative, and weak.

Recent Development and News in Water parks market

  • In May 2025, WhiteWater West launched a new generation of circular water slides that utilize recycled composite materials to reduce the environmental footprint of large scale installations.
  • In April 2025, a prominent engineering corporation in North America revealed a high-efficiency water reclamation system designed specifically for large-scale amusement parks that reduces the electrical consumption of circulation pumps by thirty percent.
  • In March 2025, a national safety standards organization in North America released a comprehensive update to the protocols for automated aquatic emergency response systems, requiring facilities to integrate artificial intelligence-driven surveillance that can detect submerged victims within seconds.
  • In October 2025, a major software company partnered with a Japanese aquatic park to launch a location-based mobile game that rewards visitors for physical movement and interaction within the facility.

Dive into Technavio’s robust research methodology, blending expert interviews, extensive data synthesis, and validated models for unparalleled Water Parks Market insights. See full methodology.

Market Scope
Page number 309
Base year 2025
Historic period 2020-2024
Forecast period 2026-2030
Growth momentum & CAGR Accelerate at a CAGR of 7.8%
Market growth 2026-2030 USD 3277.7 million
Market structure Fragmented
YoY growth 2025-2026(%) 7.7%
Key countries US, Canada, Mexico, China, Japan, India, South Korea, Australia, Indonesia, Germany, UK, France, Italy, The Netherlands, Spain, Saudi Arabia, UAE, South Africa, Israel, Turkey, Brazil, Argentina and Colombia
Competitive landscape Leading Companies, Market Positioning of Companies, Competitive Strategies, and Industry Risks

Request Free Sample

Research Analyst Overview

  • The water parks market is undergoing a significant transformation, driven by advancements in hydraulic engineering and a heightened focus on sustainability. The industry is moving beyond simple gravity-driven aquatic slides to embrace complex water coasters powered by linear induction motors and electromagnetic propulsion.
  • This evolution in high-thrill water slides is complemented by innovations in operational technology, including high-intensity propulsion systems and sophisticated water propulsion systems. Thematic design integration is critical for creating immersive environments, often seen in large aquatic complex projects. On the sustainability front, facilities are adopting circular energy systems, decentralized solar thermal grids, and closed-loop water systems.
  • Advanced water reclamation technology, alongside ultraviolet filtration, ozone filtration systems, and biological water purification, is becoming standard. These systems, supported by high-capacity heat exchangers, reduce reliance on water treatment chemicals and lower operational costs, with some parks reporting energy consumption reductions of 30%.
  • Safety is enhanced through automated monitoring systems, computerized surveillance, and rapid aquatic emergency response protocols, all requiring rigorous structural inspections. Digital enhancements such as radio frequency identification, virtual queuing systems, and augmented reality slides, combined with digital projection mapping, are reshaping the guest experience.
  • Furthermore, the development of amusement parks with water attractions, retractable roof enclosures, and diverse aquatic play systems using sustainable building materials reflects the market's adaptability. The creation of attractions featuring tidal wave equipment and advanced wave generation technology continues to be a key area of investment and differentiation.

What are the Key Data Covered in this Water Parks Market Research and Growth Report?

  • What is the expected growth of the Water Parks Market between 2026 and 2030?

    • USD 3.28 billion, at a CAGR of 7.8%

  • What segmentation does the market report cover?

    • The report is segmented by Type (Outdoor water parks, Indoor water parks, Hybrid, and APWA), Revenue Stream (Ticket sales, Food and beverage, Hotel and resorts, Merchandise, and Others), Ownership (Private owned, Public, and Public private partnerships) and Geography (North America, APAC, Europe, Middle East and Africa, South America)

  • Which regions are analyzed in the report?

    • North America, APAC, Europe, Middle East and Africa and South America

  • What are the key growth drivers and market challenges?

    • Expansion of global travel and tourism sector and experiential leisure, High capital expenditure and rising operational costs

  • Who are the major players in the Water Parks Market?

    • Arihant Industrial Corp Ltd., Aspro Parks SA, Chimelong Group Co. Ltd., Cloward H2O, FLUIDRA SA, FORREC Ltd., Great Wolf Resorts Inc., Kerzner International Ltd., Merlin Entertainments Ltd., Murphys Waves Ltd., OpenAire Inc., Parques Reunidos SAU, Polin Waterparks, ProSlide Technology Inc., Six Flags Entertainment Corp., Splashtacular LLC., United Parks and Resorts Inc., Vortex International, WhiteWater West Industries Ltd and Wiegand.Waterrides Gmbh.

Market Research Insights

  • Market dynamics are increasingly shaped by a strategic focus on premiumization and operational efficiency gains. The premiumization trend is evident as operators develop luxury private cabanas and gourmet dining options to boost ancillary revenue generation, which has been shown to increase per-capita spending by over 20% in some integrated resort experience models.
  • Concurrently, the deployment of guest engagement platforms that support cashless transactions and virtual queuing has improved guest throughput by 15% during peak hours. These digital tools provide valuable guest data analytics, enabling dynamic pricing models that enhance crowd flow management.
  • The push toward year-round operation in certain climates further diversifies revenue, mitigating the financial risks associated with environmental sensitivity and seasonal staffing management.

We can help! Our analysts can customize this water parks market research report to meet your requirements.

Get in touch

1. Executive Summary

1.1 Market overview

Executive Summary - Chart on Market Overview
Executive Summary - Data Table on Market Overview
Executive Summary - Chart on Global Market Characteristics
Executive Summary - Chart on Market by Geography
Executive Summary - Chart on Market Segmentation by Type
Executive Summary - Chart on Market Segmentation by Revenue Stream
Executive Summary - Chart on Market Segmentation by Ownership
Executive Summary - Chart on Incremental Growth
Executive Summary - Data Table on Incremental Growth
Executive Summary - Chart on Company Market Positioning

2. Technavio Analysis

2.1 Analysis of price sensitivity, lifecycle, customer purchase basket, adoption rates, and purchase criteria

2.2 Criticality of inputs and Factors of differentiation

Chart on Overview on criticality of inputs and factors of differentiation

2.3 Factors of disruption

Chart on Overview on factors of disruption

2.4 Impact of drivers and challenges

Chart on Impact of drivers and challenges in 2025 and 2030

3. Market Landscape

3.1 Market ecosystem

Chart on Parent Market
Data Table on - Parent Market

3.2 Market characteristics

Chart on Market characteristics analysis

3.3 Value chain analysis

Chart on Value chain analysis

4. Market Sizing

4.1 Market definition

Data Table on Offerings of companies included in the market definition

4.2 Market segment analysis

Market segments

4.3 Market size 2025

4.4 Market outlook: Forecast for 2025-2030

Chart on Global - Market size and forecast 2025-2030 ($ million)
Data Table on Global - Market size and forecast 2025-2030 ($ million)
Chart on Global Market: Year-over-year growth 2025-2030 (%)
Data Table on Global Market: Year-over-year growth 2025-2030 (%)

5. Historic Market Size

5.1 Global Water Parks Market 2020 - 2024

Historic Market Size - Data Table on Global Water Parks Market 2020 - 2024 ($ million)

5.2 Type segment analysis 2020 - 2024

Historic Market Size - Type Segment 2020 - 2024 ($ million)

5.3 Revenue Stream segment analysis 2020 - 2024

Historic Market Size - Revenue Stream Segment 2020 - 2024 ($ million)

5.4 Ownership segment analysis 2020 - 2024

Historic Market Size - Ownership Segment 2020 - 2024 ($ million)

5.5 Geography segment analysis 2020 - 2024

Historic Market Size - Geography Segment 2020 - 2024 ($ million)

5.6 Country segment analysis 2020 - 2024

Historic Market Size - Country Segment 2020 - 2024 ($ million)

6. Qualitative Analysis

6.1 Impact of AI on the Global Water Parks Market

6.2 Impact of geopolitical conflicts on Global Water Parks Market

7. Five Forces Analysis

7.1 Five forces summary

Five forces analysis - Comparison between 2025 and 2030

7.2 Bargaining power of buyers

Bargaining power of buyers - Impact of key factors 2025 and 2030

7.3 Bargaining power of suppliers

Bargaining power of suppliers - Impact of key factors in 2025 and 2030

7.4 Threat of new entrants

Threat of new entrants - Impact of key factors in 2025 and 2030

7.5 Threat of substitutes

Threat of substitutes - Impact of key factors in 2025 and 2030

7.6 Threat of rivalry

Threat of rivalry - Impact of key factors in 2025 and 2030

7.7 Market condition

Chart on Market condition - Five forces 2025 and 2030

8. Market Segmentation by Type

8.1 Market segments

Chart on Type - Market share 2025-2030 (%)
Data Table on Type - Market share 2025-2030 (%)

8.2 Comparison by Type

Chart on Comparison by Type
Data Table on Comparison by Type

8.3 Outdoor water parks - Market size and forecast 2025-2030

Chart on Outdoor water parks - Market size and forecast 2025-2030 ($ million)
Data Table on Outdoor water parks - Market size and forecast 2025-2030 ($ million)
Chart on Outdoor water parks - Year-over-year growth 2025-2030 (%)
Data Table on Outdoor water parks - Year-over-year growth 2025-2030 (%)

8.4 Indoor water parks - Market size and forecast 2025-2030

Chart on Indoor water parks - Market size and forecast 2025-2030 ($ million)
Data Table on Indoor water parks - Market size and forecast 2025-2030 ($ million)
Chart on Indoor water parks - Year-over-year growth 2025-2030 (%)
Data Table on Indoor water parks - Year-over-year growth 2025-2030 (%)

8.5 APWA - Market size and forecast 2025-2030

Chart on APWA - Market size and forecast 2025-2030 ($ million)
Data Table on APWA - Market size and forecast 2025-2030 ($ million)
Chart on APWA - Year-over-year growth 2025-2030 (%)
Data Table on APWA - Year-over-year growth 2025-2030 (%)

8.6 Hybrid - Market size and forecast 2025-2030

Chart on Hybrid - Market size and forecast 2025-2030 ($ million)
Data Table on Hybrid - Market size and forecast 2025-2030 ($ million)
Chart on Hybrid - Year-over-year growth 2025-2030 (%)
Data Table on Hybrid - Year-over-year growth 2025-2030 (%)

8.7 Market opportunity by Type

Market opportunity by Type ($ million)
Data Table on Market opportunity by Type ($ million)

9. Market Segmentation by Revenue Stream

9.1 Market segments

Chart on Revenue Stream - Market share 2025-2030 (%)
Data Table on Revenue Stream - Market share 2025-2030 (%)

9.2 Comparison by Revenue Stream

Chart on Comparison by Revenue Stream
Data Table on Comparison by Revenue Stream

9.3 Ticket sales - Market size and forecast 2025-2030

Chart on Ticket sales - Market size and forecast 2025-2030 ($ million)
Data Table on Ticket sales - Market size and forecast 2025-2030 ($ million)
Chart on Ticket sales - Year-over-year growth 2025-2030 (%)
Data Table on Ticket sales - Year-over-year growth 2025-2030 (%)

9.4 Food and beverage - Market size and forecast 2025-2030

Chart on Food and beverage - Market size and forecast 2025-2030 ($ million)
Data Table on Food and beverage - Market size and forecast 2025-2030 ($ million)
Chart on Food and beverage - Year-over-year growth 2025-2030 (%)
Data Table on Food and beverage - Year-over-year growth 2025-2030 (%)

9.5 Hotel and resorts - Market size and forecast 2025-2030

Chart on Hotel and resorts - Market size and forecast 2025-2030 ($ million)
Data Table on Hotel and resorts - Market size and forecast 2025-2030 ($ million)
Chart on Hotel and resorts - Year-over-year growth 2025-2030 (%)
Data Table on Hotel and resorts - Year-over-year growth 2025-2030 (%)

9.6 Merchandise - Market size and forecast 2025-2030

Chart on Merchandise - Market size and forecast 2025-2030 ($ million)
Data Table on Merchandise - Market size and forecast 2025-2030 ($ million)
Chart on Merchandise - Year-over-year growth 2025-2030 (%)
Data Table on Merchandise - Year-over-year growth 2025-2030 (%)

9.7 Others - Market size and forecast 2025-2030

Chart on Others - Market size and forecast 2025-2030 ($ million)
Data Table on Others - Market size and forecast 2025-2030 ($ million)
Chart on Others - Year-over-year growth 2025-2030 (%)
Data Table on Others - Year-over-year growth 2025-2030 (%)

9.8 Market opportunity by Revenue Stream

Market opportunity by Revenue Stream ($ million)
Data Table on Market opportunity by Revenue Stream ($ million)

10. Market Segmentation by Ownership

10.1 Market segments

Chart on Ownership - Market share 2025-2030 (%)
Data Table on Ownership - Market share 2025-2030 (%)

10.2 Comparison by Ownership

Chart on Comparison by Ownership
Data Table on Comparison by Ownership

10.3 Private owned - Market size and forecast 2025-2030

Chart on Private owned - Market size and forecast 2025-2030 ($ million)
Data Table on Private owned - Market size and forecast 2025-2030 ($ million)
Chart on Private owned - Year-over-year growth 2025-2030 (%)
Data Table on Private owned - Year-over-year growth 2025-2030 (%)

10.4 Public - Market size and forecast 2025-2030

Chart on Public - Market size and forecast 2025-2030 ($ million)
Data Table on Public - Market size and forecast 2025-2030 ($ million)
Chart on Public - Year-over-year growth 2025-2030 (%)
Data Table on Public - Year-over-year growth 2025-2030 (%)

10.5 Public private partnerships - Market size and forecast 2025-2030

Chart on Public private partnerships - Market size and forecast 2025-2030 ($ million)
Data Table on Public private partnerships - Market size and forecast 2025-2030 ($ million)
Chart on Public private partnerships - Year-over-year growth 2025-2030 (%)
Data Table on Public private partnerships - Year-over-year growth 2025-2030 (%)

10.6 Market opportunity by Ownership

Market opportunity by Ownership ($ million)
Data Table on Market opportunity by Ownership ($ million)

11. Customer Landscape

11.1 Customer landscape overview

Analysis of price sensitivity, lifecycle, customer purchase basket, adoption rates, and purchase criteria

12. Geographic Landscape

12.1 Geographic segmentation

Chart on Market share by geography 2025-2030 (%)
Data Table on Market share by geography 2025-2030 (%)

12.2 Geographic comparison

Chart on Geographic comparison
Data Table on Geographic comparison

12.3 North America - Market size and forecast 2025-2030

Chart on North America - Market size and forecast 2025-2030 ($ million)
Data Table on North America - Market size and forecast 2025-2030 ($ million)
Chart on North America - Year-over-year growth 2025-2030 (%)
Data Table on North America - Year-over-year growth 2025-2030 (%)
Chart on Regional Comparison - North America
Data Table on Regional Comparison - North America

12.3.1 US - Market size and forecast 2025-2030

Chart on US - Market size and forecast 2025-2030 ($ million)
Data Table on US - Market size and forecast 2025-2030 ($ million)
Chart on US - Year-over-year growth 2025-2030 (%)
Data Table on US - Year-over-year growth 2025-2030 (%)

12.3.2 Canada - Market size and forecast 2025-2030

Chart on Canada - Market size and forecast 2025-2030 ($ million)
Data Table on Canada - Market size and forecast 2025-2030 ($ million)
Chart on Canada - Year-over-year growth 2025-2030 (%)
Data Table on Canada - Year-over-year growth 2025-2030 (%)

12.3.3 Mexico - Market size and forecast 2025-2030

Chart on Mexico - Market size and forecast 2025-2030 ($ million)
Data Table on Mexico - Market size and forecast 2025-2030 ($ million)
Chart on Mexico - Year-over-year growth 2025-2030 (%)
Data Table on Mexico - Year-over-year growth 2025-2030 (%)

12.4 APAC - Market size and forecast 2025-2030

Chart on APAC - Market size and forecast 2025-2030 ($ million)
Data Table on APAC - Market size and forecast 2025-2030 ($ million)
Chart on APAC - Year-over-year growth 2025-2030 (%)
Data Table on APAC - Year-over-year growth 2025-2030 (%)
Chart on Regional Comparison - APAC
Data Table on Regional Comparison - APAC

12.4.1 China - Market size and forecast 2025-2030

Chart on China - Market size and forecast 2025-2030 ($ million)
Data Table on China - Market size and forecast 2025-2030 ($ million)
Chart on China - Year-over-year growth 2025-2030 (%)
Data Table on China - Year-over-year growth 2025-2030 (%)

12.4.2 Japan - Market size and forecast 2025-2030

Chart on Japan - Market size and forecast 2025-2030 ($ million)
Data Table on Japan - Market size and forecast 2025-2030 ($ million)
Chart on Japan - Year-over-year growth 2025-2030 (%)
Data Table on Japan - Year-over-year growth 2025-2030 (%)

12.4.3 India - Market size and forecast 2025-2030

Chart on India - Market size and forecast 2025-2030 ($ million)
Data Table on India - Market size and forecast 2025-2030 ($ million)
Chart on India - Year-over-year growth 2025-2030 (%)
Data Table on India - Year-over-year growth 2025-2030 (%)

12.4.4 South Korea - Market size and forecast 2025-2030

Chart on South Korea - Market size and forecast 2025-2030 ($ million)
Data Table on South Korea - Market size and forecast 2025-2030 ($ million)
Chart on South Korea - Year-over-year growth 2025-2030 (%)
Data Table on South Korea - Year-over-year growth 2025-2030 (%)

12.4.5 Australia - Market size and forecast 2025-2030

Chart on Australia - Market size and forecast 2025-2030 ($ million)
Data Table on Australia - Market size and forecast 2025-2030 ($ million)
Chart on Australia - Year-over-year growth 2025-2030 (%)
Data Table on Australia - Year-over-year growth 2025-2030 (%)

12.4.6 Indonesia - Market size and forecast 2025-2030

Chart on Indonesia - Market size and forecast 2025-2030 ($ million)
Data Table on Indonesia - Market size and forecast 2025-2030 ($ million)
Chart on Indonesia - Year-over-year growth 2025-2030 (%)
Data Table on Indonesia - Year-over-year growth 2025-2030 (%)

12.5 Europe - Market size and forecast 2025-2030

Chart on Europe - Market size and forecast 2025-2030 ($ million)
Data Table on Europe - Market size and forecast 2025-2030 ($ million)
Chart on Europe - Year-over-year growth 2025-2030 (%)
Data Table on Europe - Year-over-year growth 2025-2030 (%)
Chart on Regional Comparison - Europe
Data Table on Regional Comparison - Europe

12.5.1 Germany - Market size and forecast 2025-2030

Chart on Germany - Market size and forecast 2025-2030 ($ million)
Data Table on Germany - Market size and forecast 2025-2030 ($ million)
Chart on Germany - Year-over-year growth 2025-2030 (%)
Data Table on Germany - Year-over-year growth 2025-2030 (%)

12.5.2 UK - Market size and forecast 2025-2030

Chart on UK - Market size and forecast 2025-2030 ($ million)
Data Table on UK - Market size and forecast 2025-2030 ($ million)
Chart on UK - Year-over-year growth 2025-2030 (%)
Data Table on UK - Year-over-year growth 2025-2030 (%)

12.5.3 France - Market size and forecast 2025-2030

Chart on France - Market size and forecast 2025-2030 ($ million)
Data Table on France - Market size and forecast 2025-2030 ($ million)
Chart on France - Year-over-year growth 2025-2030 (%)
Data Table on France - Year-over-year growth 2025-2030 (%)

12.5.4 Italy - Market size and forecast 2025-2030

Chart on Italy - Market size and forecast 2025-2030 ($ million)
Data Table on Italy - Market size and forecast 2025-2030 ($ million)
Chart on Italy - Year-over-year growth 2025-2030 (%)
Data Table on Italy - Year-over-year growth 2025-2030 (%)

12.5.5 The Netherlands - Market size and forecast 2025-2030

Chart on The Netherlands - Market size and forecast 2025-2030 ($ million)
Data Table on The Netherlands - Market size and forecast 2025-2030 ($ million)
Chart on The Netherlands - Year-over-year growth 2025-2030 (%)
Data Table on The Netherlands - Year-over-year growth 2025-2030 (%)

12.5.6 Spain - Market size and forecast 2025-2030

Chart on Spain - Market size and forecast 2025-2030 ($ million)
Data Table on Spain - Market size and forecast 2025-2030 ($ million)
Chart on Spain - Year-over-year growth 2025-2030 (%)
Data Table on Spain - Year-over-year growth 2025-2030 (%)

12.6 Middle East and Africa - Market size and forecast 2025-2030

Chart on Middle East and Africa - Market size and forecast 2025-2030 ($ million)
Data Table on Middle East and Africa - Market size and forecast 2025-2030 ($ million)
Chart on Middle East and Africa - Year-over-year growth 2025-2030 (%)
Data Table on Middle East and Africa - Year-over-year growth 2025-2030 (%)
Chart on Regional Comparison - Middle East and Africa
Data Table on Regional Comparison - Middle East and Africa

12.6.1 Saudi Arabia - Market size and forecast 2025-2030

Chart on Saudi Arabia - Market size and forecast 2025-2030 ($ million)
Data Table on Saudi Arabia - Market size and forecast 2025-2030 ($ million)
Chart on Saudi Arabia - Year-over-year growth 2025-2030 (%)
Data Table on Saudi Arabia - Year-over-year growth 2025-2030 (%)

12.6.2 UAE - Market size and forecast 2025-2030

Chart on UAE - Market size and forecast 2025-2030 ($ million)
Data Table on UAE - Market size and forecast 2025-2030 ($ million)
Chart on UAE - Year-over-year growth 2025-2030 (%)
Data Table on UAE - Year-over-year growth 2025-2030 (%)

12.6.3 South Africa - Market size and forecast 2025-2030

Chart on South Africa - Market size and forecast 2025-2030 ($ million)
Data Table on South Africa - Market size and forecast 2025-2030 ($ million)
Chart on South Africa - Year-over-year growth 2025-2030 (%)
Data Table on South Africa - Year-over-year growth 2025-2030 (%)

12.6.4 Israel - Market size and forecast 2025-2030

Chart on Israel - Market size and forecast 2025-2030 ($ million)
Data Table on Israel - Market size and forecast 2025-2030 ($ million)
Chart on Israel - Year-over-year growth 2025-2030 (%)
Data Table on Israel - Year-over-year growth 2025-2030 (%)

12.6.5 Turkey - Market size and forecast 2025-2030

Chart on Turkey - Market size and forecast 2025-2030 ($ million)
Data Table on Turkey - Market size and forecast 2025-2030 ($ million)
Chart on Turkey - Year-over-year growth 2025-2030 (%)
Data Table on Turkey - Year-over-year growth 2025-2030 (%)

12.7 South America - Market size and forecast 2025-2030

Chart on South America - Market size and forecast 2025-2030 ($ million)
Data Table on South America - Market size and forecast 2025-2030 ($ million)
Chart on South America - Year-over-year growth 2025-2030 (%)
Data Table on South America - Year-over-year growth 2025-2030 (%)
Chart on Regional Comparison - South America
Data Table on Regional Comparison - South America

12.7.1 Brazil - Market size and forecast 2025-2030

Chart on Brazil - Market size and forecast 2025-2030 ($ million)
Data Table on Brazil - Market size and forecast 2025-2030 ($ million)
Chart on Brazil - Year-over-year growth 2025-2030 (%)
Data Table on Brazil - Year-over-year growth 2025-2030 (%)

12.7.2 Argentina - Market size and forecast 2025-2030

Chart on Argentina - Market size and forecast 2025-2030 ($ million)
Data Table on Argentina - Market size and forecast 2025-2030 ($ million)
Chart on Argentina - Year-over-year growth 2025-2030 (%)
Data Table on Argentina - Year-over-year growth 2025-2030 (%)

12.7.3 Colombia - Market size and forecast 2025-2030

Chart on Colombia - Market size and forecast 2025-2030 ($ million)
Data Table on Colombia - Market size and forecast 2025-2030 ($ million)
Chart on Colombia - Year-over-year growth 2025-2030 (%)
Data Table on Colombia - Year-over-year growth 2025-2030 (%)

12.8 Market opportunity by geography

Market opportunity by geography ($ million)
Data Tables on Market opportunity by geography ($ million)

13. Drivers, Challenges, and Opportunity

13.1 Market drivers

Expansion of global travel and tourism sector and experiential leisure
Technological advancements in hydraulic engineering and digital integration
Rapid urbanization and growing middle class in emerging economies

13.2 Market challenges

High capital expenditure and rising operational costs
Stringent safety standards and escalating legal liabilities
Environmental sensitivity and seasonal revenue volatility

13.3 Impact of drivers and challenges

Impact of drivers and challenges in 2025 and 2030

13.4 Market opportunities

Prioritization of sustainability and environmental engineering
Immersive digital experiences and gamification of attractions
Transition toward high-end hospitality and holistic wellness

14. Competitive Landscape

14.1 Overview

14.2

Overview on criticality of inputs and factors of differentiation

14.3 Landscape disruption

Overview on factors of disruption

14.4 Industry risks

Impact of key risks on business

15. Competitive Analysis

15.1 Companies profiled

Companies covered

15.2 Company ranking index

15.3 Market positioning of companies

Matrix on companies position and classification

15.4 Arihant Industrial Corp Ltd.

Arihant Industrial Corp Ltd. - Overview
Arihant Industrial Corp Ltd. - Product / Service
Arihant Industrial Corp Ltd. - Key offerings
SWOT

15.5 Aspro Parks SA

Aspro Parks SA - Overview
Aspro Parks SA - Product / Service
Aspro Parks SA - Key offerings
SWOT

15.6 Chimelong Group Co. Ltd.

Chimelong Group Co. Ltd. - Overview
Chimelong Group Co. Ltd. - Product / Service
Chimelong Group Co. Ltd. - Key offerings
SWOT

15.7 Cloward H2O

Cloward H2O - Overview
Cloward H2O - Product / Service
Cloward H2O - Key offerings
SWOT

15.8 FLUIDRA SA

FLUIDRA SA - Overview
FLUIDRA SA - Product / Service
FLUIDRA SA - Key offerings
SWOT

15.9 FORREC Ltd.

FORREC Ltd. - Overview
FORREC Ltd. - Product / Service
FORREC Ltd. - Key offerings
SWOT

15.10 Great Wolf Resorts Inc.

Great Wolf Resorts Inc. - Overview
Great Wolf Resorts Inc. - Product / Service
Great Wolf Resorts Inc. - Key offerings
SWOT

15.11 Kerzner International Ltd.

Kerzner International Ltd. - Overview
Kerzner International Ltd. - Product / Service
Kerzner International Ltd. - Key offerings
SWOT

15.12 Merlin Entertainments Ltd.

Merlin Entertainments Ltd. - Overview
Merlin Entertainments Ltd. - Product / Service
Merlin Entertainments Ltd. - Key offerings
SWOT

15.13 Murphys Waves Ltd.

Murphys Waves Ltd. - Overview
Murphys Waves Ltd. - Product / Service
Murphys Waves Ltd. - Key offerings
SWOT

15.14 OpenAire Inc.

OpenAire Inc. - Overview
OpenAire Inc. - Product / Service
OpenAire Inc. - Key offerings
SWOT

15.15 Parques Reunidos SAU

Parques Reunidos SAU - Overview
Parques Reunidos SAU - Product / Service
Parques Reunidos SAU - Key offerings
SWOT

15.16 Polin Waterparks

Polin Waterparks - Overview
Polin Waterparks - Product / Service
Polin Waterparks - Key offerings
SWOT

15.17 ProSlide Technology Inc.

ProSlide Technology Inc. - Overview
ProSlide Technology Inc. - Product / Service
ProSlide Technology Inc. - Key offerings
SWOT

15.18 Six Flags Entertainment Corp.

Six Flags Entertainment Corp. - Overview
Six Flags Entertainment Corp. - Product / Service
Six Flags Entertainment Corp. - Key offerings
SWOT

16. Appendix

16.1 Scope of the report

Market definition
Objectives
Notes and caveats

16.2 Inclusions and exclusions checklist

Inclusions checklist
Exclusions checklist

16.3 Currency conversion rates for US$

16.4 Research methodology

16.5 Data procurement

Information sources

16.6 Data validation

16.7 Validation techniques employed for market sizing

16.8 Data synthesis

16.9 360 degree market analysis

16.10 List of abbreviations

Research Methodology

Technavio presents a detailed picture of the market by way of study, synthesis, and summation of data from multiple sources. The analysts have presented the various facets of the market with a particular focus on identifying the key industry influencers. The data thus presented is comprehensive, reliable, and the result of extensive research, both primary and secondary.

INFORMATION SOURCES

Primary sources

  • Manufacturers and suppliers
  • Channel partners
  • Industry experts
  • Strategic decision makers

Secondary sources

  • Industry journals and periodicals
  • Government data
  • Financial reports of key industry players
  • Historical data
  • Press releases

DATA ANALYSIS

Data Synthesis

  • Collation of data
  • Estimation of key figures
  • Analysis of derived insights

Data Validation

  • Triangulation with data models
  • Reference against proprietary databases
  • Corroboration with industry experts

REPORT WRITING

Qualitative

  • Market drivers
  • Market challenges
  • Market trends
  • Five forces analysis

Quantitative

  • Market size and forecast
  • Market segmentation
  • Geographical insights
  • Competitive landscape

Interested in this report?

Get your sample now to see our research methodology and insights!

Download Now

Frequently Asked Questions

Water Parks market growth will increase by USD 3277.7 million during 2026-2030.

The Water Parks market is expected to grow at a CAGR of 7.8% during 2026-2030.

Water Parks market is segmented by Type (Outdoor water parks, Indoor water parks, APWA, Hybrid) Revenue stream (Ticket sales, Food and beverage, Hotel and resorts, Merchandise, Others) Ownership (Private owned, Public, Public private partnerships)

Arihant Industrial Corp Ltd., Aspro Parks SA, Chimelong Group Co. Ltd., Cloward H2O, FLUIDRA SA, FORREC Ltd., Great Wolf Resorts Inc., Kerzner International Ltd., Merlin Entertainments Ltd., Murphys Waves Ltd., OpenAire Inc., Parques Reunidos SAU, Polin Waterparks, ProSlide Technology Inc., Six Flags Entertainment Corp., Splashtacular LLC., United Parks and Resorts Inc., Vortex International, WhiteWater West Industries Ltd, Wiegand.Waterrides Gmbh. are a few of the key vendors in the Water Parks market.

APAC will register the highest growth rate of 33.8% among the other regions. Therefore, the Water Parks market in APAC is expected to garner significant business opportunities for the vendors during the forecast period.

US, Canada, Mexico, China, Japan, India, South Korea, Australia, Indonesia, Germany, UK, France, Italy, The Netherlands, Spain, Saudi Arabia, UAE, South Africa, Israel, Turkey, Brazil, Argentina, Colombia

  • Expansion of global travel and tourism sector and experiential leisure is the driving factor this market.

The Water Parks market vendors should focus on grabbing business opportunities from the Type segment as it accounted for the largest market share in the base year.
RIA - Research AI Assistant
Ask RIA