Wet Tissue And Wipe Market Size and Forecast 2025-2029
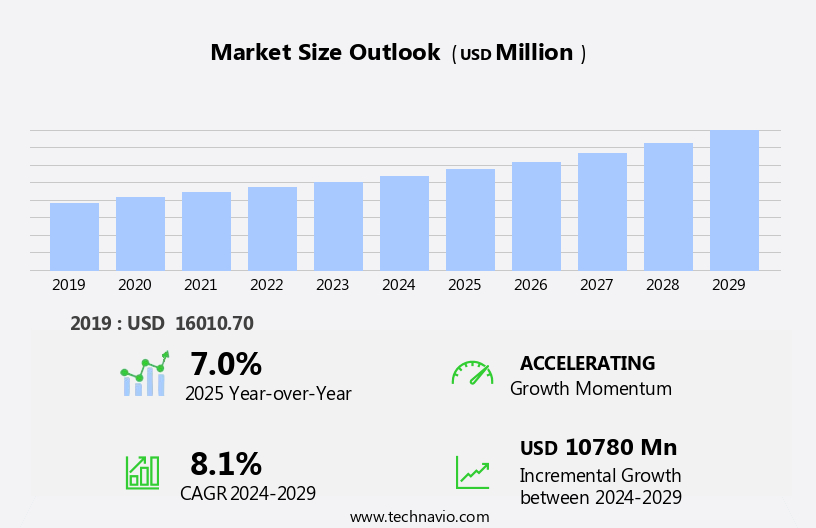
The wet tissue and wipe market size estimates the market to reach by USD 10.78 billion, at a CAGR of 8.1% between 2024 and 2029.Europe is expected to account for 34% of the growth contribution to the global market during this period. In 2019 the personal care segment was valued at USD 11.85 billion and has demonstrated steady growth since then.
|
Report Coverage |
Details |
|
Base year |
2024 |
|
Historic period |
2019-2023 |
|
Forecast period |
2025-2029 |
| Market structure | Fragmented |
|
Market growth 2025-2029 |
USD 10780 million |
- The market is driven by the growing concern for personal hygiene and increasing pollution, leading to a deteriorating environmental condition. The market is further propelled by the rising demand for multi-functional wet wipes that cater to various personal and household needs. However, the market faces challenges with the disposal of wet wipes, which poses a significant environmental threat due to their non-biodegradable nature.
- Companies must navigate this challenge by investing in research and development to create eco-friendly alternatives or biodegradable wet wipes to meet the growing demand while mitigating environmental concerns. The market's strategic landscape is shaped by these dynamics, offering opportunities for companies to innovate and cater to consumers' evolving needs while addressing the environmental challenges.
What will be the Size of the Wet Tissue And Wipe Market during the forecast period?
The market continues to evolve, with innovative product offerings and shifting consumer preferences shaping its dynamics. One notable trend is the increasing demand for flushable wipes with biodegradable base materials, such as non-woven fabric, to address concerns over wipe saturation levels in sewage systems. High absorbency wipes, often used in personal care applications, are another popular choice, with sales expected to grow by 5% annually. For instance, a leading cosmetics company reported a 15% increase in sales of individual wipe dispensing systems for their hypoallergenic, fragrance-free, and low lint wipes. The market also caters to various industries, with sterile wipes used extensively in medical applications and heavy-duty cleaning wipes preferred in industrial settings.
The composition of wipes varies, with some featuring antibacterial formulas and others made from cellulose or a blend of tissue paper. Wet wipe packaging plays a crucial role in maintaining product quality and freshness, with various designs and materials used to ensure optimal dispensing and storage. Moreover, wipe manufacturing processes continue to advance, with spunlace non-woven and airlaid non-woven technologies used to create soft, skin-friendly textures. The market also offers a wide range of wipe types, including polypropylene wipes, embossed wipe textures, and sensitive skin wipes, catering to diverse consumer needs. The ongoing development of wet wipe technology and consumer preferences result in a dynamic market landscape, with continuous innovation and adaptation to meet evolving demands.
How is this Wet Tissue And Wipe Industry segmented?
The wet tissue and wipe industry research report provides comprehensive data (region-wise segment analysis), with forecasts and estimates in "USD million" for the period 2025-2029, as well as historical data from 2019-2023 for the following segments.
- Application
- Personal care
- Household
- Industrial commercial and institutional
- Distribution Channel
- Offline
- Online
- Product Type
- Baby Wipes
- Facial Wipes
- Hand and Body Wipes
- Surface Disinfectant Wipes
- Technology
- Spunlace
- Airlaid
- Wetlaid
- Geography
- North America
- US
- Canada
- Europe
- France
- Germany
- Italy
- UK
- APAC
- China
- India
- Japan
- South Korea
- Rest of World (ROW)
- North America
By Application Insights
The personal care segment is estimated to witness significant growth during the forecast period.
The global market for wet tissues and wipes has witnessed significant growth, particularly in the personal care segment, which encompasses baby wipes, facial wipes, and feminine wipes. Regulations are stringent for personal use wet tissues and wipes due to health concerns. Manufacturers primarily use non-woven fabrics and natural fibers, such as cotton, in production. The preference for eco-friendly, natural, and chemical-free wipes is escalating due to their safety and lack of side effects, leading to increased consumer investment. Baby wipes dominate the personal care segment. In the realm of household and industrial applications, wet wipes cater to various industries, including healthcare, automotive, and heavy-duty cleaning.
Compositions range from biodegradable bases and high absorbency materials to antibacterial formulas and hypoallergenic options. Wipe dispensing systems ensure easy and individual use, while various textures, such as embossed and low lint, cater to diverse consumer needs. Wet wipe production involves various materials, including spunlace non-woven, polypropylene, and airlaid non-woven. The concentration of cleaning solutions and the choice of tissue paper blends also impact the final product's performance. Wet wipes are finding extensive use in automotive applications and as skin-friendly options for sensitive skin. In summary, the wet tissues and wipes market is dynamic, with evolving trends toward eco-friendly and natural products, diverse applications, and advanced technologies.
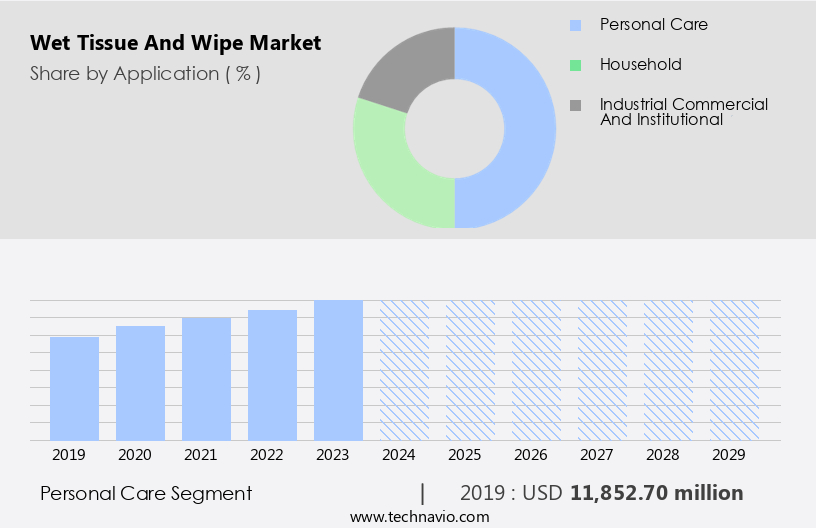
As of 2019 the Personal care segment estimated at USD 11.85 billion, and it is forecast to see a moderate upward trend through the forecast period.
Regional Analysis
During the forecast period, Europe is projected to contribute 34% to the overall growth of the global market. Technavio's analysts have elaborately explained the regional trends and drivers that shape the market during the forecast period.
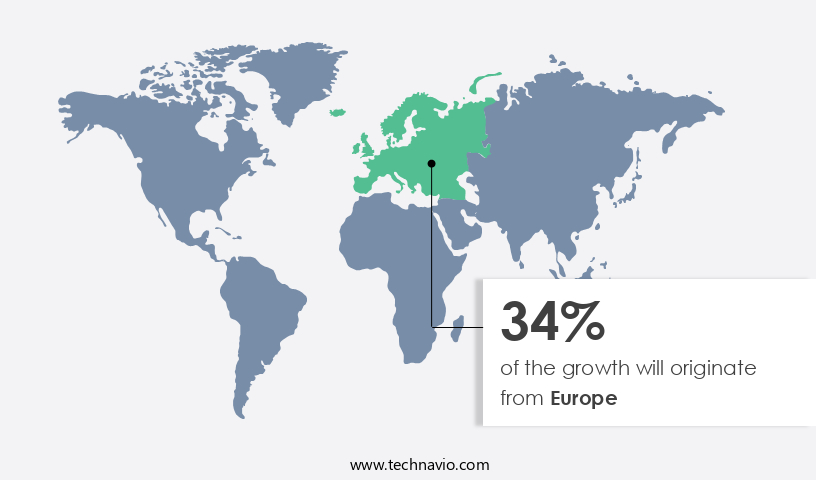
The European market is driven by the high living standards and increasing consumer preference for innovative, premium products. Major contributors to this market include Germany, Russia, and the UK. companies in Europe offer a wide range of wet tissue and wipe variants and price points. Additionally, there is a growing demand for organic and eco-friendly options, leading companies to introduce natural personal care products. Wet wipes come in various compositions, such as flushable and biodegradable, with high absorbency and hypoallergenic properties. Non-woven fabrics, like spunlace and airlaid, are commonly used in their production. Wipe dispensing systems ensure easy use and individual packaging maintains hygiene.
Personal care wipes include cosmetic, antibacterial, and sensitive skin varieties, while household and industrial wipes cater to cleaning needs. Heavy-duty wipes are used in automotive applications, and medical wipes are sterile and chemical composition specific. Wet wipe materials include cellulose, polypropylene, and tissue paper blends. Wet wipe packaging is designed to maintain the product's quality and extend its shelf life. Alcohol-free and fragrance-free wipes cater to specific consumer preferences.
Market Dynamics
Our researchers analyzed the data with 2024 as the base year, along with the key drivers, trends, and challenges. A holistic analysis of drivers will help companies refine their marketing strategies to gain a competitive advantage.
The wet wipes market is transforming through innovations like polypropylene spunlace wet wipe production, cellulose based wet wipe manufacturing process, and high absorbency non-woven wet wipes material. Focus on testing methods for wet wipe strength and absorbency, formulation of fragrance free hypoallergenic wet wipes, and cost effective production of biodegradable wet wipes drives sustainability. Key processes include efficient wet wipe dispensing system design, quality control parameters for wet wipes manufacturing, and chemical free wet wipe applications in personal care. Trends like innovative wet wipe material for better absorbency, low lint wipe fabric for sensitive skin applications, and impact of raw material on wet wipe cost and quality are crucial. Manufacturers consider different types of wet wipe formulations and their uses, future trends in the development of sustainable wet wipes, consumer preference for wet wipe features and packaging, and sustainable packaging solutions for wet wipes. Also critical: recycling processes for wet wipe material waste, new technological advancements in wet wipe production, comparative study of various wet wipe materials, and regulatory compliance for wet wipe products.
What are the key market drivers leading to the rise in the adoption of Wet Tissue And Wipe Industry?
- The deterioration of the environment due to increasing pollution serves as the primary catalyst for market growth. The global market for wet tissues and wipes is experiencing significant growth due to increasing consumer concerns over skin issues caused by pollution and deteriorating environmental conditions. With urbanization leading to the spread of diseases, customers are turning to these products for regular skin cleansing. This trend towards personal hygiene and skin care is driving the market, with a focus on high-quality ingredients leading to product premiumization and line extensions. According to industry reports, the market is expected to grow by over 5% annually in the coming years, reflecting the increasing demand for these products.
- For instance, sales of facial cleansing wipes have seen a surge in recent years, with some brands reporting a 20% increase in sales due to their effectiveness in removing impurities and providing a refreshed feeling.
What are the market trends shaping the Wet Tissue And Wipe Industry?
- The trend in the market is toward an increasing demand for multi-functional wet wipes. These versatile products offer convenience and effectiveness in various applications.
- The consumer products market, specifically the wet tissue and wipe sector, is experiencing a significant surge due to several market dynamics. Rising disposable incomes, urbanization, and technological advancements are key factors fueling this robust growth. Furthermore, consumers' increasing focus on health and sustainability has led to a shift towards innovative and eco-friendly wipe solutions. This market trend presents opportunities for companies to innovate their product offerings and packaging. For instance, Kimberly Clark's introduction of multipurpose professional wipes has gained popularity among consumers, removing the need for various wipes for different applications.
- According to market analysis firm Technavio, the wet wipes market is expected to grow by over 5% in the upcoming year. This growth is a testament to the market's potential and the increasing demand for convenient, effective, and sustainable wipe solutions.
What challenges does the Wet Tissue And Wipe Industry face during its growth?
- The disposal of wet wipes poses a significant challenge to the industry's growth, as concerns surrounding their proper disposal continue to mount due to potential environmental and health implications.
- The market is experiencing significant growth due to increasing consumer awareness about personal hygiene and the rising prevalence of incontinence and skin-related issues. However, this growth comes with environmental concerns. Disposable wipes and tissues, which are often made of non-biodegradable materials, contribute to landfill waste and pose a threat to water bodies when disposed of improperly. These products, which contain plastics in their lining and petrochemical-based polymers as filling, can be toxic if not treated properly. Moreover, non-woven fabrics used in disposable tissues and wipes, such as moist toilet tissues, facial wipes, and baby wipes, can cause sewer pipeline blockages and massive clogs.
- For instance, a study revealed that wet wipes accounted for 45% of sewer blockages in the UK in 2017. Despite these concerns, the market is expected to grow at a robust rate, with industry analysts projecting a 5% annual increase in sales over the next five years. Companies are responding to these challenges by developing eco-friendly alternatives, such as biodegradable wipes and tissues, to mitigate the environmental impact.
Exclusive Customer Landscape
The wet tissue and wipe market forecasting report includes the adoption lifecycle of the market, covering from the innovator's stage to the laggard's stage. It focuses on adoption rates in different regions based on penetration. Furthermore, the wet tissue and wipe market report also includes key purchase criteria and drivers of price sensitivity to help companies evaluate and develop their market growth analysis strategies.

Customer Landscape
Key Companies & Market Insights
Companies are implementing various strategies, such as strategic alliances, wet tissue and wipe market forecast, partnerships, mergers and acquisitions, geographical expansion, and product/service launches, to enhance their presence in the industry.
Beiersdorf AG - The company provides innovative cleaning solutions, including wet tissues such as the Instant Microbe Removing Wipes, which effectively eliminate 99.9 percent of microbes using only water.
The industry research and growth report includes detailed analyses of the competitive landscape of the market and information about key companies, including:
- Beiersdorf AG
- Coterie Baby Inc.
- Daio Paper Corp.
- Diamond Wipes International Inc.
- DR. Fischer Ltd.
- Edgewell Personal Care Co.
- Essity AB
- GAMA Healthcare Ltd.
- Henkel AG & Co. KGaA
- Kimberly-Clark Corp.
- Nice-Pak Products Inc.
- Ontex BV
- PDI Inc.
- Pigeon Corp.
- Rockline Industries
- S.C. Johnson & Son Inc.
- The Clorox Co.
- The Procter & Gamble Co.
- Unicharm Corp.
- Unilever PLC
Qualitative and quantitative analysis of companies has been conducted to help clients understand the wider business environment as well as the strengths and weaknesses of key industry players. Data is qualitatively analyzed to categorize companies as pure play, category-focused, industry-focused, and diversified; it is quantitatively analyzed to categorize companies as dominant, leading, strong, tentative, and weak.
Recent Development and News in Wet Tissue And Wipe Market
- In January 2024, Kimberly-Clark, a leading consumer goods company, announced the launch of its new line of eco-friendly wet wipes called "Urban Care," which is free from plastic packaging. This move was a strategic response to increasing consumer demand for sustainable products (Kimberly-Clark Press Release).
- In March 2024, Procter & Gamble (P&G) and Unicharm Corporation, a Japanese diaper and hygiene products manufacturer, entered into a joint venture to expand their wet wipes business in Asia. The partnership aimed to leverage P&G's global branding expertise and Unicharm's local market knowledge (Reuters).
- In May 2024, Clorox, a leading American producer of consumer and professional products, completed the acquisition of RenewLife, a company specializing in digestive health and wellness products, including flushable wipes. The acquisition was a strategic move to expand Clorox's portfolio beyond traditional cleaning products (Clorox Press Release).
- In January 2025, the European Union (EU) approved new regulations on single-use plastics, including wet wipes, which will ban their production and sale by 2030. This policy change is expected to significantly impact the market, pushing companies to develop biodegradable alternatives (European Commission Press Release).
Research Analyst Overview
- The market for wet tissues and wipes continues to evolve, with innovations and trends shaping its dynamics. Perforated wipes have gained popularity for their convenience and ease of use, while wipe strength testing ensures product reliability. Single use wipes remain a staple in various sectors, including healthcare industry and food service, but sustainability is becoming a key consideration. Recycling wipe material and sustainable production methods are on the rise, with chemical-free wipes and compressed wipes reducing environmental impact. Unscented wipes cater to sensitive consumers, while quality control wipes ensure hygiene and safety. Packaging design, refillable containers, and portable wipe containers add to the market's versatility.
- Natural fiber wipes and plant-based wipes offer eco-friendly alternatives. The industry is expected to grow by over 5% annually, driven by increasing demand for convenient and eco-friendly solutions. For instance, a leading manufacturer reported a 15% increase in sales of thick, unscented, and natural fiber wipes in the past year.
Dive into Technavio's robust research methodology, blending expert interviews, extensive data synthesis, and validated models for unparalleled Wet Tissue And Wipe Market insights. See full methodology.
Wet Tissue And Wipe Market Scope |
|
|
Report Coverage |
Details |
|
Page number |
206 |
|
Base year |
2024 |
|
Historic period |
2019-2023 |
|
Forecast period |
2025-2029 |
|
Growth momentum & CAGR |
Accelerate at a CAGR of 8.1% |
|
Market growth 2025-2029 |
USD 10780 million |
|
Market structure |
Fragmented |
|
YoY growth 2024-2025(%) |
7.0 |
|
Key countries |
US, Germany, France, China, India, Canada, UK, Japan, Italy, and South Korea |
|
Competitive landscape |
Leading Companies, Market Positioning of Companies, Competitive Strategies, and Industry Risks |
What are the Key Data Covered in this Wet Tissue And Wipe Market Research and Growth Report?
- CAGR of the Wet Tissue And Wipe industry during the forecast period
- Detailed information on factors that will drive the growth and forecasting between 2025 and 2029
- Precise estimation of the size of the market and its contribution of the industry in focus to the parent market
- Accurate predictions about upcoming growth and trends and changes in consumer behaviour
- Growth of the market across Europe, North America, APAC, South America, and Middle East and Africa
- Thorough analysis of the market's competitive landscape and detailed information about companies
- Comprehensive analysis of factors that will challenge the wet tissue and wipe market growth of industry companies
We can help! Our analysts can customize this wet tissue and wipe market research report to meet your requirements.
 RIA -
RIA - 
