Wind Energy Cables Market Analysis, Size, and Forecast 2025-2029: North America (US and Canada), Europe (France, Germany, Spain, and UK), APAC (China, India, and Taiwan), South America (Brazil), and Rest of World (ROW)

Wind Energy Cables Market Analysis, Size, and Forecast 2025-2029:
North America (US and Canada), Europe (France, Germany, Spain, and UK), APAC (China, India, and Taiwan), South America (Brazil), and Rest of World (ROW)

Published: Jun 2025 226 Pages SKU: IRTNTR76888

Market Overview at a Glance

$5.42 B
Market Opportunity
8.6%
CAGR
8.0
YoY growth 2024-2025(%)

Wind Energy Cables Market Size 2025-2029

The wind energy cables market size is forecast to increase by USD 5.42 billion, at a CAGR of 8.6% between 2024 and 2029.

  • The market is witnessing significant growth, driven by the increasing investment in offshore wind turbines. The shift towards renewable energy sources, particularly wind energy, is gaining momentum due to the need to reduce carbon emissions and mitigate climate change. Power grid electronics play a crucial role in optimizing the performance of wind turbines and transmitting electricity through submarine cable  systems. Offshore wind farms offer higher capacity and more consistent wind speeds compared to onshore installations, making them an attractive investment for energy companies. Another key trend in the market is the adoption of High Voltage Direct Current (HVDC) technology for wind energy transmission. HVDC technology enables the efficient transmission of electricity over long distances, reducing energy losses and increasing the viability of offshore wind farms.
  • However, the market also faces challenges, including the high installation and maintenance costs of wind energy cables. The high costs are due to the complex installation process, which involves laying cables underwater and ensuring their protection from harsh marine environments. Companies operating in the market must navigate these challenges to capitalize on the growing opportunities in the renewable energy sector. Effective cost management and innovation in cable technology will be crucial for companies seeking to remain competitive and meet the increasing demand for wind energy. The market is experiencing significant growth due to the rising investment in offshore wind turbines and the adoption of High Voltage Direct Current (HVDC) technology.

What will be the Size of the Wind Energy Cables Market during the forecast period?

Wind Energy Cables Market Size

Explore in-depth regional segment analysis with market size data - historical 2019-2023 and forecasts 2025-2029 - in the full report.  
 Request Free Sample

  • The market is experiencing significant growth due to the global energy transition and the increasing demand for green energy. Cable failure prevention is a key concern for the industry, with marine surveys and fiber optic cables enabling real-time monitoring and fault analysis. Cable design software, cable engineering, and cable laying simulation tools facilitate efficient cable manufacturing processes and cable routing optimization. Grid modernization and transformer stations require stringent cable safety regulations and environmental impact assessments. Carbon footprint reduction is a priority, with cable sustainability and recycling gaining importance.
  • Cable industry associations collaborate to establish cable regulations and safety standards. Direct current (DC) cable systems offer advantages in energy transmission efficiency, while AC cables continue to dominate the market. Cable testing laboratories ensure compliance with cable safety regulations and provide certification services. Seabed monitoring and cable maintenance schedules help prevent cable damage and minimize downtime. Hybrid cables and cable routing optimization strategies further enhance the efficiency and sustainability of wind energy cable systems.
  • Soil investigation and cable environmental regulations are essential components of wind energy cable projects, ensuring minimal impact on the environment. Cable end-of-life management and cable project management solutions enable effective planning, execution, and decommissioning of wind energy cable projects. The electrical infrastructure required for offshore wind power generation is extensive, and wind energy cables play a crucial role in transmitting electricity from turbines to the shore.

How is this Wind Energy Cables Industry segmented?

The wind energy cables industry research report provides comprehensive data (region-wise segment analysis), with forecasts and estimates in "USD million" for the period 2025-2029, as well as historical data from 2019-2023 for the following segments.

  • Application
    • Offshore
    • Onshore
  • End-user
    • Utility
    • Industrial
    • Commercial
  • Material
    • Copper
    • Aluminum
    • Others
  • Type
    • Power cables
    • Control cables
    • Communication cables
  • Geography
    • North America
      • US
      • Canada
    • Europe
      • France
      • Germany
      • Spain
      • UK
    • APAC
      • China
      • India
      • Taiwan
    • South America
      • Brazil
    • Rest of World (ROW)

By Application Insights

The offshore segment is estimated to witness significant growth during the forecast period. The offshore market is experiencing notable growth in 2024 due to escalating investments in offshore wind projects worldwide. Offshore wind farms, which generate electricity from wind in large bodies of water, offer advantages such as higher wind speeds and reduced environmental and noise impact compared to onshore installations. However, they necessitate specialized cable systems capable of withstanding harsh marine conditions and transmitting electricity over extended distances. Two primary types of cables, export cables and array cables, are indispensable for offshore wind projects. Export cables, also known as inter-array cables or transmission cables, connect the wind turbines to the offshore substation and then to the onshore grid.

These cables must ensure minimal power loss and high current capacity to maintain efficient power transmission. Array cables, on the other hand, connect individual wind turbines within the wind farm. They are subjected to considerable strain due to the dynamic nature of the sea and must be flexible enough to accommodate cable bending during installation and operation. Cable technology plays a crucial role in offshore wind energy projects. High-voltage direct current (HVDC) cables are increasingly preferred due to their ability to transmit power over long distances with minimal losses. Insulation materials, such as XLPE (cross-linked polyethylene), are used to ensure proper insulation and prevent cable faults. Wind energy cables play a crucial role in the transmission of electricity from offshore wind projects to the electrical infrastructure, enabling the integration of clean energy into the grid. 

Cable certification and testing are essential to ensure compliance with industry standards, including DNV GL and IEEE. Cable manufacturing and innovation are key to meeting the demands of the offshore wind energy market. Cable armoring and protection coatings are essential for shielding cables from marine growth and corrosion. Cable installation depth, cable burial depth, and cable protection systems are crucial factors in ensuring the longevity and reliability of offshore wind energy cables. Cable logistics and inventory management are also vital to ensure timely and cost-effective cable procurement and installation. The offshore market is witnessing significant growth due to the increasing number of offshore wind projects.

The market requires specialized cable systems capable of withstanding harsh marine conditions and transmitting electricity efficiently over long distances. Export and array cables are essential components of offshore wind farms, and advancements in cable technology, insulation materials, and installation techniques are driving innovation in the market. Governments and utility companies in the region are investing heavily in the development of electrical infrastructure and offshore wind projects to meet their renewable energy goals.

Wind Energy Cables Market Size

Request Free Sample

The Offshore segment was valued at USD 4.75 billion in 2019 and showed a gradual increase during the forecast period.

The Wind Energy Cables Market is evolving with advancements in alternating current (AC) transmission, ensuring efficient power delivery from wind farms to the grid. Comprehensive environmental impact assessment supports sustainable cable deployment, minimizing ecological disruption. Innovations in cable fault analysis enhance reliability, reducing downtime in offshore and onshore installations. The integration of cable simulation software improves system performance, enabling precise modeling for operational efficiency. Focus on cable recycling drives sustainability, reducing waste and supporting a circular economy. Wind power solutions play a vital role in climate change mitigation, promoting clean energy adoption and reducing carbon footprints. Cable accessories cost optimization is a critical factor in wind energy projects, with cable risk assessment and cable cost optimization tools assisting project managers in minimizing expenses. 

Regional Analysis

APAC is estimated to contribute 45% to the growth of the global market during the forecast period. Technavio's analysts have elaborately explained the regional trends and drivers that shape the market during the forecast period.

Wind Energy Cables Market Share by Geography

Download Free Sample Report

The Asia-Pacific (APAC) region is witnessing significant growth in the market, fueled by renewable energy targets, infrastructure investments, and technological advancements. Countries like China, India, Japan, and South Korea are spearheading this development, with government initiatives promoting energy security and carbon reduction. The region's robust manufacturing ecosystem facilitates cost-effective production and deployment of high-quality wind energy cables. These cables must meet the stringent requirements of onshore and offshore wind farms, including corrosion protection, cable bending radius, cable strain, insulator materials, and DNV standards. Advancements in cable technology, such as high-voltage and submarine cables, enable efficient power transmission from wind farms to the grid, mitigating power losses and connectivity challenges.

Cable certification, testing, and documentation are crucial for ensuring cable reliability and safety. Cable manufacturing innovations include cable armoring, conductor materials, and cable termination technologies. Cable installation depth, cable burial depth, and cable protection systems are essential considerations for offshore wind farms. Offshore energy and renewable energy applications are driving the demand for specialized cable solutions, such as HVDC cables and cable protection coatings. Cable market trends include cable inventory management, cable monitoring, and cable supply chain optimization. Cable installation, cable repair, and cable maintenance are ongoing concerns, requiring effective cable tension control, cable design, and cable capacity management. To stay competitive, market participants must continuously innovate and improve cable technology to meet the evolving demands of the wind energy sector.

ISO and IEEE standards govern cable voltage rating, cable sheathing, and cable trenching. Cable marking and cable identification systems facilitate cable routing and cable resistance management. Marine growth prevention and cable capacitance are critical factors for subsea cable systems. Cable inductance and cable impedance impact cable ampacity and grid connection efficiency. The market in APAC is characterized by a dynamic ecosystem of technological innovation, government initiatives, and cost-effective manufacturing. The market's growth is driven by the increasing demand for renewable energy and the need for efficient power transmission from wind farms to the grid. Cable technology advancements, regulatory compliance, and effective cable management are key challenges and opportunities for market participants.

Market Dynamics

Our researchers analyzed the data with 2024 as the base year, along with the key drivers, trends, and challenges. A holistic analysis of drivers will help companies refine their marketing strategies to gain a competitive advantage.

What are the Wind Energy Cables market drivers leading to the rise in the adoption of Industry?

  • Offshore wind turbines have seen significant investment growth, serving as the primary market catalyst. The market is experiencing significant growth due to increasing investments in offshore wind energy projects. Offshore wind power capacity expansion is driving this demand, with governments and energy companies committing substantial funds to develop wind farms. Advanced cable documentation and installation depth are crucial for efficient electricity transmission from offshore turbines to onshore grids. Technological innovations in high voltage cables, cable protection coatings, and cable impedance have enhanced the economic viability of offshore wind projects. These advancements include larger and more efficient turbines, as well as improvements in cable materials and transmission technologies. As a result, there is a growing need for specialized cables capable of handling higher voltages and long transmission distances.
  • Cable fault detection and cable current rating are essential for cable installation and maintenance. Cable burial depth and cable protection systems are also crucial for ensuring cable durability and longevity. Cable inventory management and cable repair are ongoing requirements for wind energy projects, making cable manufacturing a continuous process. The market is experiencing robust growth due to the increasing adoption of offshore wind energy. Technological advancements and the need for high-performance cables capable of handling larger voltages and long transmission distances are key market drivers. Cable documentation, installation, and maintenance remain critical aspects of wind energy projects, making cable innovations an ongoing priority.

What are the Wind Energy Cables market trends shaping the Industry?

  • HVDC (High Voltage Direct Current) technology is gaining significant traction in the energy market, with its adoption becoming an emerging trend. This advancement in power transmission technology offers numerous benefits, including efficient energy transfer and reduced power losses. In the wind energy cable industry, HVDC (High-Voltage Direct Current) technology is a notable trend in 2024 due to its increasing application in offshore wind farms. Offshore wind farms, which are typically located far from the coast, necessitate dependable transmission systems to transport electricity to onshore substations. HVDC cables are favored over traditional AC cables due to their higher transmission capacity and lower power losses, making them suitable for offshore applications. One of the primary advantages of HVDC technology is its ability to merge multiple wind farms into a unified grid system, ensuring efficient power distribution.
  • This attribute is particularly valuable for wind farms situated in remote locations or across international borders, as it facilitates effortless connectivity and optimized energy flow. Cable materials, such as XLPE insulation and jacket materials, play a crucial role in cable reliability and safety. Cable ampacity, cable termination, and cable identification are essential aspects of cable standards in the cable industry. Cable monitoring and cable inductance are essential for maintaining cable performance and ensuring grid connection. ISO standards ensure cable safety and quality across the supply chain. Cable trends include the development of smaller, lighter, and more flexible cables to minimize installation costs and improve cable pulling and marine construction processes.

How does Wind Energy Cables market face challenges during its growth?

  • The high installation and maintenance costs associated with wind energy cables pose a significant challenge to the industry's growth trajectory. The market experiences substantial challenges in 2024, primarily concerning installation and maintenance costs. The installation process for wind energy cables involves high expenses due to the premium cost of materials, labor, and specialized equipment necessary for laying long-distance, high-voltage cables. Offshore wind farms encounter even greater costs due to the complexities of functioning in marine environments. Maintenance and repairs pose another significant issue, as wind energy cables must endure harsh environmental conditions, including strong winds, extreme temperatures, and seawater exposure in offshore applications.
  • Cable pricing is influenced by several factors, including cable jointing, subsea cables, cable qualification, IEEE and IEC standards, cable voltage rating, cable sheathing, cable trenching, cable marking, cable materials, marine growth prevention, cable capacitance, cable tension, cable design, cable capacity, cable resistance, and cable routing. Ensuring cable durability and reliability in these challenging conditions is crucial for the wind energy industry's success. These environmental factors increase the probability of cable damage and malfunctions, necessitating frequent maintenance and repairs, thereby adding to operational expenses.

Exclusive Customer Landscape

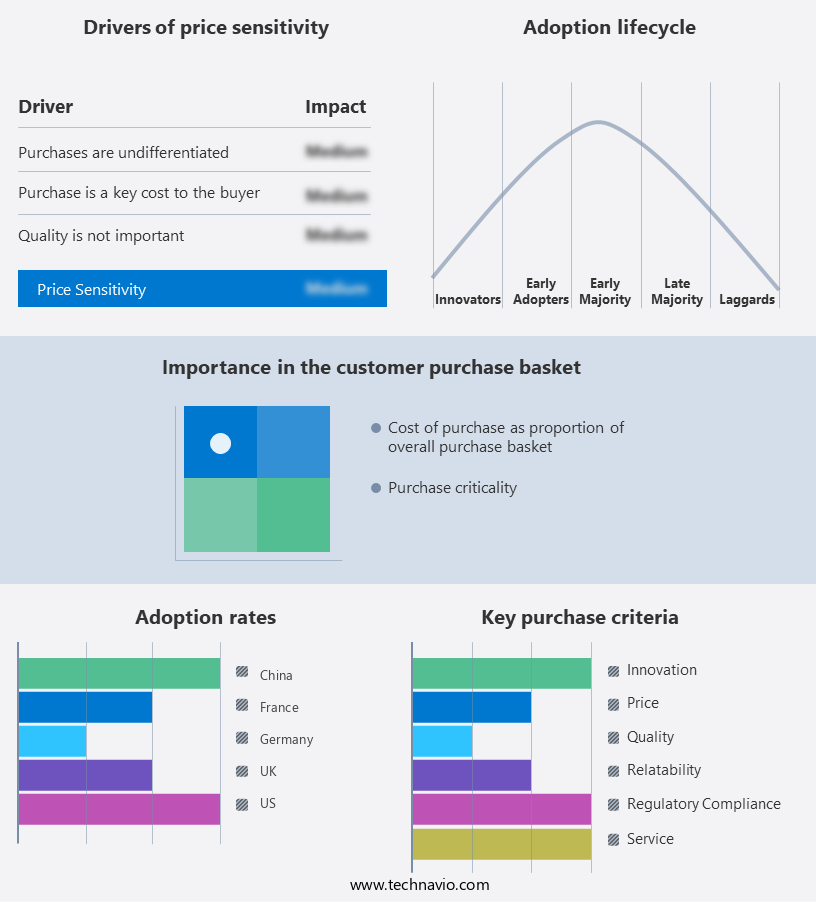
The wind energy cables market forecasting report includes the adoption lifecycle of the market, covering from the innovator's stage to the laggard's stage. It focuses on adoption rates in different regions based on penetration. Furthermore, the wind energy cables market report also includes key purchase criteria and drivers of price sensitivity to help companies evaluate and develop their market growth analysis strategies.

Wind Energy Cables Market Share by Geography

 Customer Landscape

Key Companies & Market Insights

Companies are implementing various strategies, such as strategic alliances, wind energy cables market forecast, partnerships, mergers and acquisitions, geographical expansion, and product/service launches, to enhance their presence in the industry.

ABB Ltd. - The company specializes in wind energy solutions, providing advanced cable offerings designed for efficiency and reliability.

The industry research and growth report includes detailed analyses of the competitive landscape of the market and information about key companies, including:

  • ABB Ltd.
  • Belden Inc.
  • Finolex Cables Ltd.
  • Fujikura Ltd.
  • Furukawa Electric Co. Ltd.
  • Hengtong Group Co. Ltd.
  • Hydro Group
  • KEI Industries Ltd.
  • LS Corp.
  • Nexans SA
  • Ningbo Orient Wires and Cables Co. Ltd.
  • NKT AS
  • Prysmian SpA
  • Southwire Co. LLC
  • Subsea 7 SA
  • Sumitomo Electric Industries Ltd.
  • Tele Fonika Kable SA
  • Viohalco S.A.

Qualitative and quantitative analysis of companies has been conducted to help clients understand the wider business environment as well as the strengths and weaknesses of key industry players. Data is qualitatively analyzed to categorize companies as pure play, category-focused, industry-focused, and diversified; it is quantitatively analyzed to categorize companies as dominant, leading, strong, tentative, and weak.

Recent Development and News in Wind Energy Cables Market

  • In February 2023, Prysmian Group, a leading cable manufacturer, announced the launch of its new high-voltage direct current (HVDC) wind energy cable, named "GreenX," designed to enhance the efficiency and durability of wind energy transmission. This innovation is expected to reduce energy losses and improve the overall performance of wind farms (Prysmian Group Press Release, 2023).
  • In March 2024, Siemens Energy and Nexans, two major players in the market, entered into a strategic partnership to jointly develop and manufacture high-performance cables for offshore wind farms. This collaboration aims to strengthen their market position and cater to the growing demand for renewable energy solutions (Siemens Energy Press Release, 2024).
  • In May 2024, General Cable, a global leader in power and communications infrastructure solutions, secured a significant contract from Ørsted, a Danish renewable energy company, to supply and install over 1,000 kilometers of subsea and land cables for the Hornsea Three offshore wind farm project. This project is expected to add approximately 2.85 GW of renewable energy capacity to the UK grid (General Cable Press Release, 2024).

Research Analyst Overview

The market is characterized by continuous evolution and dynamism, driven by the expanding offshore wind farm sector and the ongoing development of renewable energy sources. Offshore wind farms require specialized AC cables for power transmission, with conductor materials and cable pulling techniques playing crucial roles in their installation. Marine construction firms employ various cable standards, including DNV and ISO, to ensure safety and reliability during cable laying. In the cable industry, advancements in cable technology have led to innovations such as high voltage cables, XLPE insulation, and HVDC cables, which offer increased efficiency and capacity. Cable ampacity, cable reliability, and cable impedance are key considerations for grid connection and cable monitoring.

Cable manufacturing involves various processes, including cable termination, cable jointing, and cable burial, to ensure cable durability and functionality. Cable pricing, inventory management, and cable documentation are essential aspects of cable procurement. Cable safety is paramount, with cable protection systems, cable protection coatings, and cable identification crucial for preventing cable damage and ensuring safe cable operation. Cable temperature rise, cable sag, and cable tension are important factors in cable design and installation. Subsea cables face unique challenges, such as cable bending radius, cable laying vessels, and marine growth prevention, which require specialized cable technology and cable installation techniques. Cable qualification, IEEE and IEC standards, and cable voltage rating are essential for ensuring cable performance and safety in these environments.

Cable market trends include cable inductance, cable capacitance, and cable resistance, which impact cable performance and efficiency. Cable current rating, cable installation depth, and cable protection systems are critical for optimizing cable performance and minimizing cable losses. Cable maintenance, cable repair, and cable replacement are ongoing activities in the market, ensuring the reliability and longevity of cable infrastructure. Cable manufacturing innovations, cable industry collaborations, and cable market growth continue to shape the evolving landscape of this dynamic sector.

Dive into Technavio's strong research methodology, blending expert interviews, extensive data synthesis, and validated models for unparalleled Wind Energy Cables Market insights. See full methodology.

Market Scope

Report Coverage

Details

Page number

226

Base year

2024

Historic period

2019-2023

Forecast period

2025-2029

Growth momentum & CAGR

Accelerate at a CAGR of 8.6%

Market growth 2025-2029

USD 5.42 billion

Market structure

Fragmented

YoY growth 2024-2025(%)

8.0

Key countries

China, US, Germany, UK, India, Spain, Taiwan, Canada, France, and Brazil

Competitive landscape

Leading Companies, Market Positioning of Companies, Competitive Strategies, and Industry Risks

Request Free Sample

What are the Key Data Covered in this Wind Energy Cables Market Research and Growth Report?

  • CAGR of the Wind Energy Cables industry during the forecast period
  • Detailed information on factors that will drive the growth and forecasting between 2025 and 2029
  • Precise estimation of the size of the market and its contribution of the industry in focus to the parent market
  • Accurate predictions about upcoming growth and trends and changes in consumer behaviour
  • Growth of the market across APAC, Europe, North America, South America, and Middle East and Africa
  • Thorough analysis of the market's competitive landscape and detailed information about companies
  • Comprehensive analysis of factors that will challenge the wind energy cables market growth of industry companies

We can help! Our analysts can customize this wind energy cables market research report to meet your requirements.

Get in touch

1 Executive Summary

  • 1.1 Market overview
    • Executive Summary - Chart on Market Overview
    • Executive Summary - Data Table on Market Overview
    • Executive Summary - Chart on Global Market Characteristics
    • Executive Summary - Chart on Market by Geography
    • Executive Summary - Chart on Market Segmentation by Application
    • Executive Summary - Chart on Market Segmentation by End-user
    • Executive Summary - Chart on Market Segmentation by Material
    • Executive Summary - Chart on Market Segmentation by Type
    • Executive Summary - Chart on Incremental Growth
    • Executive Summary - Data Table on Incremental Growth
    • Executive Summary - Chart on Company Market Positioning

2 Technavio Analysis

  • 2.1 Analysis of price sensitivity, lifecycle, customer purchase basket, adoption rates, and purchase criteria
    • Analysis of price sensitivity, lifecycle, customer purchase basket, adoption rates, and purchase criteria
  • 2.2 Criticality of inputs and Factors of differentiation
    • Overview on criticality of inputs and factors of differentiation
  • 2.3 Factors of disruption
    • Overview on factors of disruption
  • 2.4 Impact of drivers and challenges
    • Impact of drivers and challenges in 2024 and 2029

3 Market Landscape

  • 3.1 Market ecosystem
    • Parent Market
    • Data Table on - Parent Market
  • 3.2 Market characteristics
    • Market characteristics analysis
  • 3.3 Value chain analysis
    • Value chain analysis

4 Market Sizing

  • 4.1 Market definition
    • Offerings of companies included in the market definition
  • 4.2 Market segment analysis
    • Market segments
  • 4.3 Market size 2024
    • 4.4 Market outlook: Forecast for 2024-2029
      • Chart on Global - Market size and forecast 2024-2029 ($ million)
      • Data Table on Global - Market size and forecast 2024-2029 ($ million)
      • Chart on Global Market: Year-over-year growth 2024-2029 (%)
      • Data Table on Global Market: Year-over-year growth 2024-2029 (%)

    5 Historic Market Size

    • 5.1 Global Wind Energy Cables Market 2019 - 2023
      • Historic Market Size - Data Table on Global Wind Energy Cables Market 2019 - 2023 ($ million)
    • 5.2 Application segment analysis 2019 - 2023
      • Historic Market Size - Application Segment 2019 - 2023 ($ million)
    • 5.3 End-user segment analysis 2019 - 2023
      • Historic Market Size - End-user Segment 2019 - 2023 ($ million)
    • 5.4 Material segment analysis 2019 - 2023
      • Historic Market Size - Material Segment 2019 - 2023 ($ million)
    • 5.5 Type segment analysis 2019 - 2023
      • Historic Market Size - Type Segment 2019 - 2023 ($ million)
    • 5.6 Geography segment analysis 2019 - 2023
      • Historic Market Size - Geography Segment 2019 - 2023 ($ million)
    • 5.7 Country segment analysis 2019 - 2023
      • Historic Market Size - Country Segment 2019 - 2023 ($ million)

    6 Qualitative Analysis

    • 6.1 The AI impact on global wind energy cables market

      7 Five Forces Analysis

      • 7.1 Five forces summary
        • Five forces analysis - Comparison between 2024 and 2029
      • 7.2 Bargaining power of buyers
        • Bargaining power of buyers - Impact of key factors 2024 and 2029
      • 7.3 Bargaining power of suppliers
        • Bargaining power of suppliers - Impact of key factors in 2024 and 2029
      • 7.4 Threat of new entrants
        • Threat of new entrants - Impact of key factors in 2024 and 2029
      • 7.5 Threat of substitutes
        • Threat of substitutes - Impact of key factors in 2024 and 2029
      • 7.6 Threat of rivalry
        • Threat of rivalry - Impact of key factors in 2024 and 2029
      • 7.7 Market condition
        • Chart on Market condition - Five forces 2024 and 2029

      8 Market Segmentation by Application

      • 8.1 Market segments
        • Chart on Application - Market share 2024-2029 (%)
        • Data Table on Application - Market share 2024-2029 (%)
      • 8.2 Comparison by Application
        • Chart on Comparison by Application
        • Data Table on Comparison by Application
      • 8.3 Offshore - Market size and forecast 2024-2029
        • Chart on Offshore - Market size and forecast 2024-2029 ($ million)
        • Data Table on Offshore - Market size and forecast 2024-2029 ($ million)
        • Chart on Offshore - Year-over-year growth 2024-2029 (%)
        • Data Table on Offshore - Year-over-year growth 2024-2029 (%)
      • 8.4 Onshore - Market size and forecast 2024-2029
        • Chart on Onshore - Market size and forecast 2024-2029 ($ million)
        • Data Table on Onshore - Market size and forecast 2024-2029 ($ million)
        • Chart on Onshore - Year-over-year growth 2024-2029 (%)
        • Data Table on Onshore - Year-over-year growth 2024-2029 (%)
      • 8.5 Market opportunity by Application
        • Market opportunity by Application ($ million)
        • Data Table on Market opportunity by Application ($ million)

      9 Market Segmentation by End-user

      • 9.1 Market segments
        • Chart on End-user - Market share 2024-2029 (%)
        • Data Table on End-user - Market share 2024-2029 (%)
      • 9.2 Comparison by End-user
        • Chart on Comparison by End-user
        • Data Table on Comparison by End-user
      • 9.3 Utility - Market size and forecast 2024-2029
        • Chart on Utility - Market size and forecast 2024-2029 ($ million)
        • Data Table on Utility - Market size and forecast 2024-2029 ($ million)
        • Chart on Utility - Year-over-year growth 2024-2029 (%)
        • Data Table on Utility - Year-over-year growth 2024-2029 (%)
      • 9.4 Industrial - Market size and forecast 2024-2029
        • Chart on Industrial - Market size and forecast 2024-2029 ($ million)
        • Data Table on Industrial - Market size and forecast 2024-2029 ($ million)
        • Chart on Industrial - Year-over-year growth 2024-2029 (%)
        • Data Table on Industrial - Year-over-year growth 2024-2029 (%)
      • 9.5 Commercial - Market size and forecast 2024-2029
        • Chart on Commercial - Market size and forecast 2024-2029 ($ million)
        • Data Table on Commercial - Market size and forecast 2024-2029 ($ million)
        • Chart on Commercial - Year-over-year growth 2024-2029 (%)
        • Data Table on Commercial - Year-over-year growth 2024-2029 (%)
      • 9.6 Market opportunity by End-user
        • Market opportunity by End-user ($ million)
        • Data Table on Market opportunity by End-user ($ million)

      10 Market Segmentation by Material

      • 10.1 Market segments
        • Chart on Material - Market share 2024-2029 (%)
        • Data Table on Material - Market share 2024-2029 (%)
      • 10.2 Comparison by Material
        • Chart on Comparison by Material
        • Data Table on Comparison by Material
      • 10.3 Copper - Market size and forecast 2024-2029
        • Chart on Copper - Market size and forecast 2024-2029 ($ million)
        • Data Table on Copper - Market size and forecast 2024-2029 ($ million)
        • Chart on Copper - Year-over-year growth 2024-2029 (%)
        • Data Table on Copper - Year-over-year growth 2024-2029 (%)
      • 10.4 Aluminum - Market size and forecast 2024-2029
        • Chart on Aluminum - Market size and forecast 2024-2029 ($ million)
        • Data Table on Aluminum - Market size and forecast 2024-2029 ($ million)
        • Chart on Aluminum - Year-over-year growth 2024-2029 (%)
        • Data Table on Aluminum - Year-over-year growth 2024-2029 (%)
      • 10.5 Others - Market size and forecast 2024-2029
        • Chart on Others - Market size and forecast 2024-2029 ($ million)
        • Data Table on Others - Market size and forecast 2024-2029 ($ million)
        • Chart on Others - Year-over-year growth 2024-2029 (%)
        • Data Table on Others - Year-over-year growth 2024-2029 (%)
      • 10.6 Market opportunity by Material
        • Market opportunity by Material ($ million)
        • Data Table on Market opportunity by Material ($ million)

      11 Market Segmentation by Type

      • 11.1 Market segments
        • Chart on Type - Market share 2024-2029 (%)
        • Data Table on Type - Market share 2024-2029 (%)
      • 11.2 Comparison by Type
        • Chart on Comparison by Type
        • Data Table on Comparison by Type
      • 11.3 Power cables - Market size and forecast 2024-2029
        • Chart on Power cables - Market size and forecast 2024-2029 ($ million)
        • Data Table on Power cables - Market size and forecast 2024-2029 ($ million)
        • Chart on Power cables - Year-over-year growth 2024-2029 (%)
        • Data Table on Power cables - Year-over-year growth 2024-2029 (%)
      • 11.4 Control cables - Market size and forecast 2024-2029
        • Chart on Control cables - Market size and forecast 2024-2029 ($ million)
        • Data Table on Control cables - Market size and forecast 2024-2029 ($ million)
        • Chart on Control cables - Year-over-year growth 2024-2029 (%)
        • Data Table on Control cables - Year-over-year growth 2024-2029 (%)
      • 11.5 Communication cables - Market size and forecast 2024-2029
        • Chart on Communication cables - Market size and forecast 2024-2029 ($ million)
        • Data Table on Communication cables - Market size and forecast 2024-2029 ($ million)
        • Chart on Communication cables - Year-over-year growth 2024-2029 (%)
        • Data Table on Communication cables - Year-over-year growth 2024-2029 (%)
      • 11.6 Market opportunity by Type
        • Market opportunity by Type ($ million)
        • Data Table on Market opportunity by Type ($ million)

      12 Customer Landscape

      • 12.1 Customer landscape overview
        • Analysis of price sensitivity, lifecycle, customer purchase basket, adoption rates, and purchase criteria

      13 Geographic Landscape

      • 13.1 Geographic segmentation
        • Chart on Market share by geography 2024-2029 (%)
        • Data Table on Market share by geography 2024-2029 (%)
      • 13.2 Geographic comparison
        • Chart on Geographic comparison
        • Data Table on Geographic comparison
      • 13.3 APAC - Market size and forecast 2024-2029
        • Chart on APAC - Market size and forecast 2024-2029 ($ million)
        • Data Table on APAC - Market size and forecast 2024-2029 ($ million)
        • Chart on APAC - Year-over-year growth 2024-2029 (%)
        • Data Table on APAC - Year-over-year growth 2024-2029 (%)
      • 13.4 Europe - Market size and forecast 2024-2029
        • Chart on Europe - Market size and forecast 2024-2029 ($ million)
        • Data Table on Europe - Market size and forecast 2024-2029 ($ million)
        • Chart on Europe - Year-over-year growth 2024-2029 (%)
        • Data Table on Europe - Year-over-year growth 2024-2029 (%)
      • 13.5 North America - Market size and forecast 2024-2029
        • Chart on North America - Market size and forecast 2024-2029 ($ million)
        • Data Table on North America - Market size and forecast 2024-2029 ($ million)
        • Chart on North America - Year-over-year growth 2024-2029 (%)
        • Data Table on North America - Year-over-year growth 2024-2029 (%)
      • 13.6 South America - Market size and forecast 2024-2029
        • Chart on South America - Market size and forecast 2024-2029 ($ million)
        • Data Table on South America - Market size and forecast 2024-2029 ($ million)
        • Chart on South America - Year-over-year growth 2024-2029 (%)
        • Data Table on South America - Year-over-year growth 2024-2029 (%)
      • 13.7 Middle East and Africa - Market size and forecast 2024-2029
        • Chart on Middle East and Africa - Market size and forecast 2024-2029 ($ million)
        • Data Table on Middle East and Africa - Market size and forecast 2024-2029 ($ million)
        • Chart on Middle East and Africa - Year-over-year growth 2024-2029 (%)
        • Data Table on Middle East and Africa - Year-over-year growth 2024-2029 (%)
      • 13.8 China - Market size and forecast 2024-2029
        • Chart on China - Market size and forecast 2024-2029 ($ million)
        • Data Table on China - Market size and forecast 2024-2029 ($ million)
        • Chart on China - Year-over-year growth 2024-2029 (%)
        • Data Table on China - Year-over-year growth 2024-2029 (%)
      • 13.9 US - Market size and forecast 2024-2029
        • Chart on US - Market size and forecast 2024-2029 ($ million)
        • Data Table on US - Market size and forecast 2024-2029 ($ million)
        • Chart on US - Year-over-year growth 2024-2029 (%)
        • Data Table on US - Year-over-year growth 2024-2029 (%)
      • 13.10 Germany - Market size and forecast 2024-2029
        • Chart on Germany - Market size and forecast 2024-2029 ($ million)
        • Data Table on Germany - Market size and forecast 2024-2029 ($ million)
        • Chart on Germany - Year-over-year growth 2024-2029 (%)
        • Data Table on Germany - Year-over-year growth 2024-2029 (%)
      • 13.11 India - Market size and forecast 2024-2029
        • Chart on India - Market size and forecast 2024-2029 ($ million)
        • Data Table on India - Market size and forecast 2024-2029 ($ million)
        • Chart on India - Year-over-year growth 2024-2029 (%)
        • Data Table on India - Year-over-year growth 2024-2029 (%)
      • 13.12 UK - Market size and forecast 2024-2029
        • Chart on UK - Market size and forecast 2024-2029 ($ million)
        • Data Table on UK - Market size and forecast 2024-2029 ($ million)
        • Chart on UK - Year-over-year growth 2024-2029 (%)
        • Data Table on UK - Year-over-year growth 2024-2029 (%)
      • 13.13 Spain - Market size and forecast 2024-2029
        • Chart on Spain - Market size and forecast 2024-2029 ($ million)
        • Data Table on Spain - Market size and forecast 2024-2029 ($ million)
        • Chart on Spain - Year-over-year growth 2024-2029 (%)
        • Data Table on Spain - Year-over-year growth 2024-2029 (%)
      • 13.14 Taiwan - Market size and forecast 2024-2029
        • Chart on Taiwan - Market size and forecast 2024-2029 ($ million)
        • Data Table on Taiwan - Market size and forecast 2024-2029 ($ million)
        • Chart on Taiwan - Year-over-year growth 2024-2029 (%)
        • Data Table on Taiwan - Year-over-year growth 2024-2029 (%)
      • 13.15 Canada - Market size and forecast 2024-2029
        • Chart on Canada - Market size and forecast 2024-2029 ($ million)
        • Data Table on Canada - Market size and forecast 2024-2029 ($ million)
        • Chart on Canada - Year-over-year growth 2024-2029 (%)
        • Data Table on Canada - Year-over-year growth 2024-2029 (%)
      • 13.16 France - Market size and forecast 2024-2029
        • Chart on France - Market size and forecast 2024-2029 ($ million)
        • Data Table on France - Market size and forecast 2024-2029 ($ million)
        • Chart on France - Year-over-year growth 2024-2029 (%)
        • Data Table on France - Year-over-year growth 2024-2029 (%)
      • 13.17 Brazil - Market size and forecast 2024-2029
        • Chart on Brazil - Market size and forecast 2024-2029 ($ million)
        • Data Table on Brazil - Market size and forecast 2024-2029 ($ million)
        • Chart on Brazil - Year-over-year growth 2024-2029 (%)
        • Data Table on Brazil - Year-over-year growth 2024-2029 (%)
      • 13.18 Market opportunity by geography
        • Market opportunity by geography ($ million)
        • Data Tables on Market opportunity by geography ($ million)

      14 Drivers, Challenges, and Opportunity/Restraints

      • 14.1 Market drivers
        • 14.2 Market challenges
          • 14.3 Impact of drivers and challenges
            • Impact of drivers and challenges in 2024 and 2029
          • 14.4 Market opportunities/restraints

            15 Competitive Landscape

            • 15.1 Overview
              • 15.2 Competitive Landscape
                • Overview on criticality of inputs and factors of differentiation
              • 15.3 Landscape disruption
                • Overview on factors of disruption
              • 15.4 Industry risks
                • Impact of key risks on business

              16 Competitive Analysis

              • 16.1 Companies profiled
                • Companies covered
              • 16.2 Company ranking index
                • Company ranking index
              • 16.3 Market positioning of companies
                • Matrix on companies position and classification
              • 16.4 ABB Ltd.
                • ABB Ltd. - Overview
                • ABB Ltd. - Business segments
                • ABB Ltd. - Key news
                • ABB Ltd. - Key offerings
                • ABB Ltd. - Segment focus
                • SWOT
              • 16.5 Belden Inc.
                • Belden Inc. - Overview
                • Belden Inc. - Business segments
                • Belden Inc. - Key news
                • Belden Inc. - Key offerings
                • Belden Inc. - Segment focus
                • SWOT
              • 16.6 Fujikura Ltd.
                • Fujikura Ltd. - Overview
                • Fujikura Ltd. - Business segments
                • Fujikura Ltd. - Key offerings
                • Fujikura Ltd. - Segment focus
                • SWOT
              • 16.7 Furukawa Electric Co. Ltd.
                • Furukawa Electric Co. Ltd. - Overview
                • Furukawa Electric Co. Ltd. - Business segments
                • Furukawa Electric Co. Ltd. - Key offerings
                • Furukawa Electric Co. Ltd. - Segment focus
                • SWOT
              • 16.8 Hengtong Group Co. Ltd.
                • Hengtong Group Co. Ltd. - Overview
                • Hengtong Group Co. Ltd. - Product / Service
                • Hengtong Group Co. Ltd. - Key offerings
                • SWOT
              • 16.9 Hydro Group
                • Hydro Group - Overview
                • Hydro Group - Product / Service
                • Hydro Group - Key offerings
                • SWOT
              • 16.10 LS Corp.
                • LS Corp. - Overview
                • LS Corp. - Product / Service
                • LS Corp. - Key offerings
                • SWOT
              • 16.11 Nexans SA
                • Nexans SA - Overview
                • Nexans SA - Business segments
                • Nexans SA - Key news
                • Nexans SA - Key offerings
                • Nexans SA - Segment focus
                • SWOT
              • 16.12 Ningbo Orient Wires and Cables Co. Ltd.
                • Ningbo Orient Wires and Cables Co. Ltd. - Overview
                • Ningbo Orient Wires and Cables Co. Ltd. - Product / Service
                • Ningbo Orient Wires and Cables Co. Ltd. - Key offerings
                • SWOT
              • 16.13 NKT AS
                • NKT AS - Overview
                • NKT AS - Business segments
                • NKT AS - Key news
                • NKT AS - Key offerings
                • NKT AS - Segment focus
                • SWOT
              • 16.14 Prysmian SpA
                • Prysmian SpA - Overview
                • Prysmian SpA - Business segments
                • Prysmian SpA - Key news
                • Prysmian SpA - Key offerings
                • Prysmian SpA - Segment focus
                • SWOT
              • 16.15 Subsea 7 SA
                • Subsea 7 SA - Overview
                • Subsea 7 SA - Business segments
                • Subsea 7 SA - Key offerings
                • Subsea 7 SA - Segment focus
                • SWOT
              • 16.16 Sumitomo Electric Industries Ltd.
                • Sumitomo Electric Industries Ltd. - Overview
                • Sumitomo Electric Industries Ltd. - Business segments
                • Sumitomo Electric Industries Ltd. - Key news
                • Sumitomo Electric Industries Ltd. - Key offerings
                • Sumitomo Electric Industries Ltd. - Segment focus
                • SWOT
              • 16.17 Tele Fonika Kable SA
                • Tele Fonika Kable SA - Overview
                • Tele Fonika Kable SA - Product / Service
                • Tele Fonika Kable SA - Key offerings
                • SWOT
              • 16.18 Viohalco S.A.
                • Viohalco S.A. - Overview
                • Viohalco S.A. - Business segments
                • Viohalco S.A. - Key offerings
                • Viohalco S.A. - Segment focus
                • SWOT

              17 Appendix

              • 17.1 Scope of the report
                • 17.2 Inclusions and exclusions checklist
                  • Inclusions checklist
                  • Exclusions checklist
                • 17.3 Currency conversion rates for US$
                  • Currency conversion rates for US$
                • 17.4 Research methodology
                  • Research methodology
                • 17.5 Data procurement
                  • Information sources
                • 17.6 Data validation
                  • Data validation
                • 17.7 Validation techniques employed for market sizing
                  • Validation techniques employed for market sizing
                • 17.8 Data synthesis
                  • Data synthesis
                • 17.9 360 degree market analysis
                  • 360 degree market analysis
                • 17.10 List of abbreviations
                  • List of abbreviations

                Research Methodology

                Technavio presents a detailed picture of the market by way of study, synthesis, and summation of data from multiple sources. The analysts have presented the various facets of the market with a particular focus on identifying the key industry influencers. The data thus presented is comprehensive, reliable, and the result of extensive research, both primary and secondary.

                INFORMATION SOURCES

                Primary sources

                • Manufacturers and suppliers
                • Channel partners
                • Industry experts
                • Strategic decision makers

                Secondary sources

                • Industry journals and periodicals
                • Government data
                • Financial reports of key industry players
                • Historical data
                • Press releases

                DATA ANALYSIS

                Data Synthesis

                • Collation of data
                • Estimation of key figures
                • Analysis of derived insights

                Data Validation

                • Triangulation with data models
                • Reference against proprietary databases
                • Corroboration with industry experts

                REPORT WRITING

                Qualitative

                • Market drivers
                • Market challenges
                • Market trends
                • Five forces analysis

                Quantitative

                • Market size and forecast
                • Market segmentation
                • Geographical insights
                • Competitive landscape

                Interested in this report?

                Get your sample now to see our research methodology and insights!

                Download Now

                Frequently Asked Questions

                Wind Energy Cables market growth will increase by $ 5422.4 mn during 2025-2029 .

                The Wind Energy Cables market is expected to grow at a CAGR of 8.6% during 2025-2029 .

                Wind Energy Cables market is segmented by Application( Offshore, Onshore) End-user( Utility, Industrial, Commercial) Material( Copper, Aluminum, Others, Middle East and Africa, South America)

                ABB Ltd., Belden Inc., Finolex Cables Ltd., Fujikura Ltd., Furukawa Electric Co. Ltd., Hengtong Group Co. Ltd., Hydro Group, KEI Industries Ltd., LS Corp., Nexans SA, Ningbo Orient Wires and Cables Co. Ltd., NKT AS, Prysmian SpA, Southwire Co. LLC, Subsea 7 SA, Sumitomo Electric Industries Ltd., Tele Fonika Kable SA, Viohalco S.A. are a few of the key vendors in the Wind Energy Cables market.

                APAC will register the highest growth rate of 45% among the other regions. Therefore, the Wind Energy Cables market in APAC is expected to garner significant business opportunities for the vendors during the forecast period.

                China, US, Germany, UK, India, Spain, Taiwan, Canada, France, Brazil

                • Increasing investment in offshore wind turbinesThe global wind energy cables market continues to expand is the driving factor this market.
                • driven by increasing investments in offshore wind turbines. As offshore wind power capacity grows is the driving factor this market.
                • governments and energy companies are making substantial financial commitments to develop wind farms is the driving factor this market.
                • leading to a rising demand for specialized cables that can efficiently transmit electricity from offshore turbines to onshore grids.Technological advancements in offshore wind energy have further strengthened the market. Larger and more efficient turbines is the driving factor this market.
                • along with improvements in cable materials and transmission technologies is the driving factor this market.
                • have enhanced the economic viability of offshore wind projects. These developments necessitate high-performance cables capable of handling higher voltages and long transmission distances.Government policies and incentives play a crucial role in supporting offshore wind energy expansion. Many governments worldwide implement favorable regulations is the driving factor this market.
                • tax credits is the driving factor this market.
                • and financial incentives to encourage private investment in renewable energy. These measures have led to an increase in offshore wind installations is the driving factor this market.
                • further driving the demand for wind energy cables.Environmental considerations also contribute to market growth. Offshore wind energy is recognized as a cleaner alternative to fossil fuel-based electricity generation is the driving factor this market.
                • aligning with global sustainability goals. The need to integrate offshore wind power into national grids and provide clean energy to consumers continues to fuel demand for wind energy cables.Additionally is the driving factor this market.
                • the economic benefits of offshore wind energy extend beyond power generation. The industry creates job opportunities in cable manufacturing is the driving factor this market.
                • installation is the driving factor this market.
                • and maintenance is the driving factor this market.
                • supporting regional economies. As offshore wind projects expand is the driving factor this market.
                • the demand for skilled labor and resources in the wind energy cable sector remains strong.Overall is the driving factor this market.
                • the market for wind energy cables is expected to grow as investments in offshore wind turbines increase. Continued research and development is the driving factor this market.
                • along with government support for renewable energy initiatives is the driving factor this market.
                • will further drive demand for advanced cable solutions. Thus is the driving factor this market.
                • increasing investment in offshore wind turbines will drive the growth of the global wind energy cables market during the forecast period. is the driving factor this market.

                The Wind Energy Cables market vendors should focus on grabbing business opportunities from the Offshore segment as it accounted for the largest market share in the base year.