Offshore Wind Power Market Analysis Europe, APAC, North America, South America, Middle East and Africa - UK, Germany, Belgium, US, Japan - Size and Forecast 2024-2028

Offshore Wind Power Market Analysis Europe, APAC, North America, South America, Middle East and Africa - UK, Germany, Belgium, US, Japan - Size and Forecast 2024-2028

Published: Aug 2024 174 Pages SKU: IRTNTR45310

Market Overview at a Glance

$33.96 B
Market Opportunity
17.17%
CAGR
14.88
YoY growth 2023-2024(%)

Offshore Wind Power Market Size 2024-2028

The offshore wind power market size is estimated to increase by USD 33.96 billion, at a CAGR of 17.17% between 2023 and 2028. Market expansion in the wind power generation sector is underpinned by several key factors. There is a notable increase in global energy demand, propelling the adoption of wind energy as a sustainable solution. Governments worldwide are increasingly supportive, offering incentives and regulatory frameworks that favour renewable energy development. Moreover, the decreasing Levelized Cost of Energy (LCOE) for wind power enhances its competitiveness in the energy mix. However, challenges persist, including competition from alternative energy sources, environmental concerns, and the substantial capital required for offshore wind projects. Despite these obstacles, the market remains dynamic, driven by ongoing advancements in technology, evolving energy needs, and the commitment to reducing carbon footprints globally. As the industry navigates these challenges.

What will be the size of the Market During the Forecast Period?

Offshore Wind Power Market Size

To learn more about this report, Download Report Sample

Market Segmentation

By Type

The market share growth by the monopile segment will be significant during the forecast period. The monopile offshore wind structure is made up of a cylindrical steel tube and has a relatively simple design wherein the tower is supported by the monopile either directly or through a transition piece. The monopile runs down into the seabed. The penetration of the monopile can be adjusted based on the seabed and environmental conditions. Monopile is the most commonly used foundation structure in the market, owing to its ease of installation in shallow water depths ranging from 0 to 98.42 feet (0 to 30 meters). These factors will facilitate segment growth during the forecast period.

Offshore Wind Power Market Size

Get a glance at the market contribution of various segments Request a PDF Sample

The monopile segment was valued at USD 13.48 billion in 2018There are several variations of monopiles, such as drilled monopiles and drilled concrete monopiles. A drilled monopile structure consists of a fixed steel monopile with concrete in a deep drilled hole inside the seabed rock. Such an arrangement helps keep the weight of the foundation relatively low. As a result, the foundation can be towed to the site using a normal tugboat and lifted into place by a relatively low lifting capacity. On the other hand, drilled monopiles consist of prefabricated concrete monopiles, which are installed using a vertical drilling technique and eliminate the use of a transition piece. Hence, owing to the advantages of monopile structures, technological advances, and the rapid deployment of monopile structures across the world due to the presence of prominent companies with requisite technological expertise, the market is expected to grow significantly during the forecast period.

Key Regions

Offshore Wind Power Market Share by Geography

For more insights on the market share of various regions Request PDF Sample now!

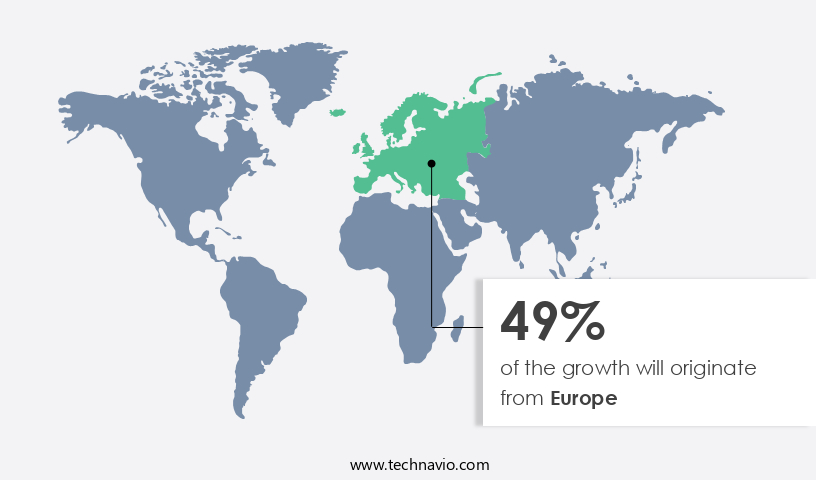
Europe is estimated to contribute 49% to the growth of the global market during the forecast period. Technavio's analysts have elaborately explained the regional trends and drivers that shape the market during the forecast period. In Europe, the UK registered the highest share of offshore wind installations, followed by Germany. However, as the prices of international offshore power have reduced by more than 50%, the auctions are expected to resume, and tariffs are anticipated to reduce to around USD 0.18 per kW in the upcoming projects. Hence, the rapid deployment of renewable sources in the region, the technological developments reducing the cost per unit, and the government initiatives to boost the efficiency of offshore farms are expected to support the growth of the market in Europe during the forecast period.

Market Dynamics and Customer Landscape

The market is booming, driven by the increasing electricity demand and the shift towards clean energy infrastructure. Despite occasional challenges like cable failure and environmental concerns, the industry thrives on continuous technological advancements and supply chains. With significant investment pouring in and installed capacity steadily rising, offshore farms and projects are becoming integral to meeting energy demand sustainably. Leading industry players are pushing boundaries with innovative floating foundation types and cutting-edge ocean energy technologies. As the world embraces renewable power sources, offshore wind turbines, especially in salt water environments, are set to play a pivotal role in shaping the future of production and addressing global environmental challenges.  

Key Market Driver

The market experiences significant growth driven by the electricity demand globally. As per the International Energy Agency (IEA), economic growth in 2021 led to a 4.6% increase in global demand, notably fuelled by countries like China, the US, and India. The global electricity demand has doubled since 1990, outpacing other fuel sources. Forecasts indicate a twofold increase in electricity demand by 2040, driven by emerging economies and population growth. This escalating demand underscores the importance of investing in offshore wind projects and advancing technological advancements in floating foundation types and ocean energy technologies to meet the demand sustainably while addressing environmental concerns and ensuring a clean energy infrastructure.

Significant Market Trends

The rising popularity of clean energy technologies is the primary trend in the global market. Owing to the rapid growth in the global demand for electricity and the extensive use of fossil fuels such as coal and natural gas to fulfill the demand, there has been substantial growth in global carbon dioxide (CO2) emissions resulting from fuel combustion. Moreover, electricity and heat generation have been the largest sources of CO2 emissions and accounted for more than 42% of the global CO2 emissions in 2022.

Hence, there has been a rising demand for clean sources globally to reduce carbon emissions. Thus, there has been a rise in the adoption of renewable sources for power generation, which has been boosting wind power generation. Wind and solar power registered a double-digit growth rate in 2021, mainly fuelled by China, Europe, and the US. Hence, with the rising adoption of clean sources, the market is expected to grow during the forecast period.

Major Market Challenge

The competition from alternative energy sources is a major challenge to global market growth. Despite the rapid growth in the adoption of renewable energy sources such as offshore wind power generation, the use of fossil fuels such as oil, coal, and natural gas still accounts for a substantial portion of the global energy mix. Moreover, clean coal technologies such as supercritical and ultra-supercritical coal-fired power plants have been further boosting the operations and sustenance of coal-fired power plants. Many countries prefer using fossil fuels rather than renewable energy sources due to the abundance of fossil fuels.

Moreover, the cost of establishing a renewable energy farm for producing power is substantially high, and the power output from renewable energy sources is not on par with that from fossil fuels. Hence, the preference for non-renewable energy sources is high in the market. Moreover, power generation using coal (conventional as well as clean coal technologies) and natural gas accounts for a significant portion of the global energy mix, which is expected to hinder the growth of the market during the forecast period.

Key Market Customer Landscape

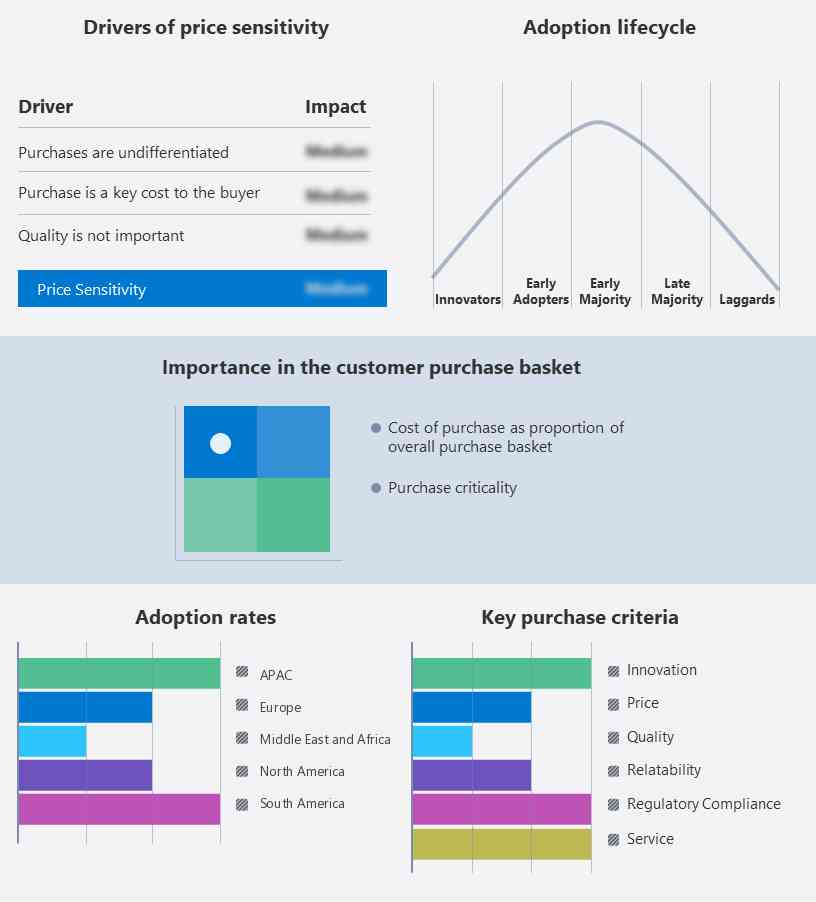
The report includes the adoption lifecycle of the market, covering from the innovator's stage to the laggard's stage. It focuses on adoption rates in different regions based on penetration. Furthermore, the report also includes key purchase criteria and drivers of price sensitivity to help companies evaluate and develop their growth strategies.

Offshore Wind Power Market Share by Geography

Market Customer Landscape

Who are the Major Market Companies?

Companies are implementing various strategies, such as strategic alliances, partnerships, mergers and acquisitions, geographical expansion, and product/service launches, to enhance their presence in the market.

CAPE Holland BV- The company focuses on offshore wind power generation business with complete solutions and experience in various projects. Also, They offer offshore wind power generation business-related complete solutions.

The market report also includes detailed analyses of the competitive landscape of the market and information about 15 market companies, including:

  • China Steel Corp.
  • Dongfang Electric Corp.
  • Doosan Corp.
  • Erndtebcker Eisenwerk GmbH and Co KG
  • General Electric Co.
  • Hyosung Heavy Industries Corp.
  • Hyundai Heavy Industries Co. Ltd.
  • JDR Cable Systems Ltd.
  • Lamprell Plc
  • Nexans SA
  • NKT AS
  • Nordex SE
  • Senvion Wind Technology Pvt. Ltd.
  • Siemens Gamesa Renewable Energy SA

Qualitative and quantitative analysis of companies has been conducted to help clients understand the wider business environment as well as the strengths and weaknesses of key market players. Data is qualitatively analyzed to categorize companies as pure play, category-focused, industry-focused, and diversified; it is quantitatively analyzed to categorize companies as dominant, leading, strong, tentative, and weak.

Segment Overview

The market research report provides comprehensive data (region-wise segment analysis), with forecasts and estimates in "USD Billion" for the period 2024 to 2028, as well as historical data from 2018 to 2022 for the following segments.

  • Type Outlook
    • Monopile
    • Jacket
    • Others
  • Product Type Outlook
    • Fixed structure
    • Floating structure
  • Region Outlook 
    • North America
      • The U.S.
      • Canada
    • Europe
      • U.K.
      • Germany
      • France
      • Rest of Europe
    • APAC
      • China
      • India
    • South America
      • Chile
      • Argentina
    • Middle East & Africa
      • Saudi Arabia
      • South Africa
      • Rest of the Middle East & Africa

Market Analyst Overview

The market is fuelled by Advanced technology and favorable policies, offering a clean source of energy to meet the rising global demand. Leading industry players like GE Renewable Energy and Ming Yang Smart are driving efficiency with advanced turbines and installation techniques, overcoming challenges such as cable failure and environmental concerns. Floating offshore wind projects, utilizing innovative floating foundations, tap into deep-water installations to harness natural wind resources efficiently. With increasing installed capacity and favorable regulations, offshore wind power emerges as a sustainable solution for clean energy infrastructure development. Despite marine environment challenges, including typhoon resistance and seabed topography, the market continues to expand, contributing to renewable power targets and achieving zero-emission missions. Floating foundation types are crucial for floating wind farms, with their installed capacity (GW) measured in gigawatts. 

Moreover, the market is flourishing due to advancements in technology and supportive policies and regulations worldwide. With increasing global demand for renewable power, offshore wind energy emerges as a sustainable source of energy. Projects like floating offshore wind farms and deep-water installations demonstrate the industry's commitment to innovation and efficiency. Companies like Haizhuang Wind Power are pioneering Typhoon-Resistant Wind Turbine and floating platform technologies, expanding installed capacity in various water depth categories. Despite challenges such as high capital costs and environmental concerns, the market continues to grow, driven by the quest for energy-efficient solutions and achieving zero-emission missions. As the supply chain strengthens and technological advancements enhance energy production, offshore wind power remains a crucial component in meeting renewable targets and ensuring a sustainable power future for the planet.

Additionally, the market is experiencing rapid growth, driven by advancements in technological innovation and the global shift towards renewable energy sources. Projects range across various capacity categories and include deep-water installations and floating offshore wind farms, utilizing floating foundation types for efficient component installation. With a focus on efficiency and technological advancement, companies are developing typhoon-resistant turbines and optimizing rotor diameter for enhanced performance in salt-water environments. As governments set ambitious renewable targets and enforce rules and regulations, the industry strives for a zero-emission mission, positioning it as a leading solution in the quest for sustainable ocean energy technologies.

Market Scope

Report Coverage

Details

Page number

174

Base year

2023

Historic period

2018-2022

Forecast period

2024-2028

Growth momentum & CAGR

Accelerate at a CAGR of 17.17%

Market growth 2024-2028

USD 33.96 billion

Market structure

Fragmented

YoY growth 2023-2024(%)

14.88

Regional analysis

Europe, APAC, North America, South America, and Middle East and Africa

Performing market contribution

Europe at 49%

Key countries

UK, Germany, Belgium, US, and Japan

Competitive landscape

Leading Companies, Market Positioning of Companies, Competitive Strategies, and Industry Risks

Key companies profiled

CAPE Holland BV, China Steel Corp., Dongfang Electric Corp. Ltd., Doosan Corp., Erndtebcker Eisenwerk GmbH and Co KG, General Electric Co., Hyosung Heavy Industries Corp., Hyundai Heavy Industries Co. Ltd., JDR Cable Systems Ltd., Lamprell Plc, Nexans SA, NKT AS, Nordex SE, Prysmian Spa, Senvion Wind Technology Pvt. Ltd., Siemens Gamesa Renewable Energy SA, Sinovel Wind Group Co. Ltd., Verdict Media Ltd., Vestas Wind Systems AS, and Xinjiang Goldwind Science and Technology Co. Ltd.

Market dynamics

Parent market growth analysis, Market Forecasting, Market growth inducers and obstacles, Fast-growing and slow-growing segment analysis, COVID-19 impact and recovery analysis and future consumer dynamics, and Market condition analysis for the market forecast period.

Customization purview

If our market report has not included the data that you are looking for, you can reach out to our analysts and get segments customized.

Request PDF sample

What are the Key Data Covered in this Market Research Report?

  • CAGR of the market during the forecast period
  • Detailed information on factors that will drive the market growth and forecasting of the market between 2024 and 2028
  • Precise estimation of the size of the market size and its contribution to the parent market
  • Accurate predictions about upcoming market trends and analysis and changes in consumer behavior
  • Growth of the market industry across Europe, North America, APAC, South America, and Middle East and Africa
  • Thorough market growth analysis of the market's competitive landscape and detailed information about companies
  • Comprehensive market analysis and report on the factors that will challenge the market research and growth of market companies

We can help! Our analysts can customize this market research report to meet your requirements. Get in touch

1 Executive Summary

  • 1.1 Market overview
    • Executive Summary - Chart on Market Overview
    • Executive Summary - Data Table on Market Overview
    • Executive Summary - Chart on Global Market Characteristics
    • Executive Summary - Chart on Market by Geography
    • Executive Summary - Chart on Market Segmentation by Type
    • Executive Summary - Chart on Market Segmentation by Product Type
    • Executive Summary - Chart on Incremental Growth
    • Executive Summary - Data Table on Incremental Growth
    • Executive Summary - Chart on Company Market Positioning

2 Market Landscape

  • 2.1 Market ecosystem
    • Parent Market
    • Data Table on - Parent Market
  • 2.2 Market characteristics
    • Market characteristics analysis
  • 2.3 Value chain analysis
    • Value Chain Analysis

3 Market Sizing

  • 3.1 Market definition
    • Offerings of companies included in the market definition
  • 3.2 Market segment analysis
    • Market segments
  • 3.3 Market size 2023
    • 3.4 Market outlook: Forecast for 2023-2028
      • Chart on Global - Market size and forecast 2023-2028 ($ million)
      • Data Table on Global - Market size and forecast 2023-2028 ($ million)
      • Chart on Global Market: Year-over-year growth 2023-2028 (%)
      • Data Table on Global Market: Year-over-year growth 2023-2028 (%)

    4 Historic Market Size

    • 4.1 Global Offshore Wind Power Market 2018 - 2022
      • Historic Market Size - Data Table on Global Offshore Wind Power Market 2018 - 2022 ($ million)
    • 4.2 Type segment analysis 2018 - 2022
      • Historic Market Size - Type Segment 2018 - 2022 ($ million)
    • 4.3 Product Type segment analysis 2018 - 2022
      • Historic Market Size - Product Type Segment 2018 - 2022 ($ million)
    • 4.4 Geography segment analysis 2018 - 2022
      • Historic Market Size - Geography Segment 2018 - 2022 ($ million)
    • 4.5 Country segment analysis 2018 - 2022
      • Historic Market Size - Country Segment 2018 - 2022 ($ million)

    5 Five Forces Analysis

    • 5.1 Five forces summary
      • Five forces analysis - Comparison between 2023 and 2028
    • 5.2 Bargaining power of buyers
      • Bargaining power of buyers - Impact of key factors 2023 and 2028
    • 5.3 Bargaining power of suppliers
      • Bargaining power of suppliers - Impact of key factors in 2023 and 2028
    • 5.4 Threat of new entrants
      • Threat of new entrants - Impact of key factors in 2023 and 2028
    • 5.5 Threat of substitutes
      • Threat of substitutes - Impact of key factors in 2023 and 2028
    • 5.6 Threat of rivalry
      • Threat of rivalry - Impact of key factors in 2023 and 2028
    • 5.7 Market condition
      • Chart on Market condition - Five forces 2023 and 2028

    6 Market Segmentation by Type

    • 6.1 Market segments
      • Chart on Type - Market share 2023-2028 (%)
      • Data Table on Type - Market share 2023-2028 (%)
    • 6.2 Comparison by Type
      • Chart on Comparison by Type
      • Data Table on Comparison by Type
    • 6.3 Monopile - Market size and forecast 2023-2028
      • Chart on Monopile - Market size and forecast 2023-2028 ($ million)
      • Data Table on Monopile - Market size and forecast 2023-2028 ($ million)
      • Chart on Monopile - Year-over-year growth 2023-2028 (%)
      • Data Table on Monopile - Year-over-year growth 2023-2028 (%)
    • 6.4 Jacket - Market size and forecast 2023-2028
      • Chart on Jacket - Market size and forecast 2023-2028 ($ million)
      • Data Table on Jacket - Market size and forecast 2023-2028 ($ million)
      • Chart on Jacket - Year-over-year growth 2023-2028 (%)
      • Data Table on Jacket - Year-over-year growth 2023-2028 (%)
    • 6.5 Others - Market size and forecast 2023-2028
      • Chart on Others - Market size and forecast 2023-2028 ($ million)
      • Data Table on Others - Market size and forecast 2023-2028 ($ million)
      • Chart on Others - Year-over-year growth 2023-2028 (%)
      • Data Table on Others - Year-over-year growth 2023-2028 (%)
    • 6.6 Market opportunity by Type
      • Market opportunity by Type ($ million)
      • Data Table on Market opportunity by Type ($ million)

    7 Market Segmentation by Product Type

    • 7.1 Market segments
      • Chart on Product Type - Market share 2023-2028 (%)
      • Data Table on Product Type - Market share 2023-2028 (%)
    • 7.2 Comparison by Product Type
      • Chart on Comparison by Product Type
      • Data Table on Comparison by Product Type
    • 7.3 Fixed structure - Market size and forecast 2023-2028
      • Chart on Fixed structure - Market size and forecast 2023-2028 ($ million)
      • Data Table on Fixed structure - Market size and forecast 2023-2028 ($ million)
      • Chart on Fixed structure - Year-over-year growth 2023-2028 (%)
      • Data Table on Fixed structure - Year-over-year growth 2023-2028 (%)
    • 7.4 Floating structure - Market size and forecast 2023-2028
      • Chart on Floating structure - Market size and forecast 2023-2028 ($ million)
      • Data Table on Floating structure - Market size and forecast 2023-2028 ($ million)
      • Chart on Floating structure - Year-over-year growth 2023-2028 (%)
      • Data Table on Floating structure - Year-over-year growth 2023-2028 (%)
    • 7.5 Market opportunity by Product Type
      • Market opportunity by Product Type ($ million)
      • Data Table on Market opportunity by Product Type ($ million)

    8 Customer Landscape

    • 8.1 Customer landscape overview
      • Analysis of price sensitivity, lifecycle, customer purchase basket, adoption rates, and purchase criteria

    9 Geographic Landscape

    • 9.1 Geographic segmentation
      • Chart on Market share by geography 2023-2028 (%)
      • Data Table on Market share by geography 2023-2028 (%)
    • 9.2 Geographic comparison
      • Chart on Geographic comparison
      • Data Table on Geographic comparison
    • 9.3 Europe - Market size and forecast 2023-2028
      • Chart on Europe - Market size and forecast 2023-2028 ($ million)
      • Data Table on Europe - Market size and forecast 2023-2028 ($ million)
      • Chart on Europe - Year-over-year growth 2023-2028 (%)
      • Data Table on Europe - Year-over-year growth 2023-2028 (%)
    • 9.4 APAC - Market size and forecast 2023-2028
      • Chart on APAC - Market size and forecast 2023-2028 ($ million)
      • Data Table on APAC - Market size and forecast 2023-2028 ($ million)
      • Chart on APAC - Year-over-year growth 2023-2028 (%)
      • Data Table on APAC - Year-over-year growth 2023-2028 (%)
    • 9.5 North America - Market size and forecast 2023-2028
      • Chart on North America - Market size and forecast 2023-2028 ($ million)
      • Data Table on North America - Market size and forecast 2023-2028 ($ million)
      • Chart on North America - Year-over-year growth 2023-2028 (%)
      • Data Table on North America - Year-over-year growth 2023-2028 (%)
    • 9.6 South America - Market size and forecast 2023-2028
      • Chart on South America - Market size and forecast 2023-2028 ($ million)
      • Data Table on South America - Market size and forecast 2023-2028 ($ million)
      • Chart on South America - Year-over-year growth 2023-2028 (%)
      • Data Table on South America - Year-over-year growth 2023-2028 (%)
    • 9.7 Middle East and Africa - Market size and forecast 2023-2028
      • Chart on Middle East and Africa - Market size and forecast 2023-2028 ($ million)
      • Data Table on Middle East and Africa - Market size and forecast 2023-2028 ($ million)
      • Chart on Middle East and Africa - Year-over-year growth 2023-2028 (%)
      • Data Table on Middle East and Africa - Year-over-year growth 2023-2028 (%)
    • 9.8 UK - Market size and forecast 2023-2028
      • Chart on UK - Market size and forecast 2023-2028 ($ million)
      • Data Table on UK - Market size and forecast 2023-2028 ($ million)
      • Chart on UK - Year-over-year growth 2023-2028 (%)
      • Data Table on UK - Year-over-year growth 2023-2028 (%)
    • 9.9 Germany - Market size and forecast 2023-2028
      • Chart on Germany - Market size and forecast 2023-2028 ($ million)
      • Data Table on Germany - Market size and forecast 2023-2028 ($ million)
      • Chart on Germany - Year-over-year growth 2023-2028 (%)
      • Data Table on Germany - Year-over-year growth 2023-2028 (%)
    • 9.10 Belgium - Market size and forecast 2023-2028
      • Chart on Belgium - Market size and forecast 2023-2028 ($ million)
      • Data Table on Belgium - Market size and forecast 2023-2028 ($ million)
      • Chart on Belgium - Year-over-year growth 2023-2028 (%)
      • Data Table on Belgium - Year-over-year growth 2023-2028 (%)
    • 9.11 US - Market size and forecast 2023-2028
      • Chart on US - Market size and forecast 2023-2028 ($ million)
      • Data Table on US - Market size and forecast 2023-2028 ($ million)
      • Chart on US - Year-over-year growth 2023-2028 (%)
      • Data Table on US - Year-over-year growth 2023-2028 (%)
    • 9.12 Japan - Market size and forecast 2023-2028
      • Chart on Japan - Market size and forecast 2023-2028 ($ million)
      • Data Table on Japan - Market size and forecast 2023-2028 ($ million)
      • Chart on Japan - Year-over-year growth 2023-2028 (%)
      • Data Table on Japan - Year-over-year growth 2023-2028 (%)
    • 9.13 Market opportunity by geography
      • Market opportunity by geography ($ million)
      • Data Tables on Market opportunity by geography ($ million)

    10 Drivers, Challenges, and Opportunity/Restraints

    • 10.1 Market drivers
      • 10.2 Market challenges
        • 10.3 Impact of drivers and challenges
          • Impact of drivers and challenges in 2023 and 2028
        • 10.4 Market opportunities/restraints

          11 Competitive Landscape

          • 11.1 Overview
            • 11.2 Competitive Landscape
              • Overview on criticality of inputs and factors of differentiation
            • 11.3 Landscape disruption
              • Overview on factors of disruption
            • 11.4 Industry risks
              • Impact of key risks on business

            12 Competitive Analysis

            • 12.1 Companies profiled
              • Companies covered
            • 12.2 Market positioning of companies
              • Matrix on companies position and classification
            • 12.3 CAPE Holland BV
              • CAPE Holland BV - Overview
              • CAPE Holland BV - Product / Service
              • CAPE Holland BV - Key offerings
            • 12.4 China Steel Corp.
              • China Steel Corp. - Overview
              • China Steel Corp. - Product / Service
              • China Steel Corp. - Key offerings
            • 12.5 Dongfang Electric Corp.
              • Dongfang Electric Corp. - Overview
              • Dongfang Electric Corp. - Product / Service
              • Dongfang Electric Corp. - Key offerings
            • 12.6 Doosan Corp.
              • Doosan Corp. - Overview
              • Doosan Corp. - Business segments
              • Doosan Corp. - Key news
              • Doosan Corp. - Key offerings
              • Doosan Corp. - Segment focus
            • 12.7 Erndtebcker Eisenwerk GmbH and Co KG
              • Erndtebcker Eisenwerk GmbH and Co KG - Overview
              • Erndtebcker Eisenwerk GmbH and Co KG - Product / Service
              • Erndtebcker Eisenwerk GmbH and Co KG - Key offerings
            • 12.8 General Electric Co.
              • General Electric Co. - Overview
              • General Electric Co. - Business segments
              • General Electric Co. - Key news
              • General Electric Co. - Key offerings
              • General Electric Co. - Segment focus
            • 12.9 Hyosung Heavy Industries Corp.
              • Hyosung Heavy Industries Corp. - Overview
              • Hyosung Heavy Industries Corp. - Product / Service
              • Hyosung Heavy Industries Corp. - Key offerings
            • 12.10 Hyundai Heavy Industries Co. Ltd.
              • Hyundai Heavy Industries Co. Ltd. - Overview
              • Hyundai Heavy Industries Co. Ltd. - Product / Service
              • Hyundai Heavy Industries Co. Ltd. - Key offerings
            • 12.11 JDR Cable Systems Ltd.
              • JDR Cable Systems Ltd. - Overview
              • JDR Cable Systems Ltd. - Product / Service
              • JDR Cable Systems Ltd. - Key offerings
            • 12.12 Nexans SA
              • Nexans SA - Overview
              • Nexans SA - Business segments
              • Nexans SA - Key news
              • Nexans SA - Key offerings
              • Nexans SA - Segment focus
            • 12.13 Nordex SE
              • Nordex SE - Overview
              • Nordex SE - Business segments
              • Nordex SE - Key offerings
              • Nordex SE - Segment focus
            • 12.14 Senvion Wind Technology Pvt. Ltd.
              • Senvion Wind Technology Pvt. Ltd. - Overview
              • Senvion Wind Technology Pvt. Ltd. - Product / Service
              • Senvion Wind Technology Pvt. Ltd. - Key offerings
            • 12.15 Siemens Gamesa Renewable Energy SA
              • Siemens Gamesa Renewable Energy SA - Overview
              • Siemens Gamesa Renewable Energy SA - Product / Service
              • Siemens Gamesa Renewable Energy SA - Key offerings
            • 12.16 Sinovel Wind Group Co. Ltd.
              • Sinovel Wind Group Co. Ltd. - Overview
              • Sinovel Wind Group Co. Ltd. - Product / Service
              • Sinovel Wind Group Co. Ltd. - Key offerings
            • 12.17 Vestas Wind Systems AS
              • Vestas Wind Systems AS - Overview
              • Vestas Wind Systems AS - Business segments
              • Vestas Wind Systems AS - Key offerings
              • Vestas Wind Systems AS - Segment focus

            13 Appendix

            • 13.1 Scope of the report
              • 13.2 Inclusions and exclusions checklist
                • Inclusions checklist
                • Exclusions checklist
              • 13.3 Currency conversion rates for US$
                • Currency conversion rates for US$
              • 13.4 Research methodology
                • Research methodology
              • 13.5 Data procurement
                • Information sources
              • 13.6 Data validation
                • Data validation
              • 13.7 Validation techniques employed for market sizing
                • Validation techniques employed for market sizing
              • 13.8 Data synthesis
                • Data synthesis
              • 13.9 360 degree market analysis
                • 360 degree market analysis
              • 13.10 List of abbreviations
                • List of abbreviations

              Research Methodology

              Technavio presents a detailed picture of the market by way of study, synthesis, and summation of data from multiple sources. The analysts have presented the various facets of the market with a particular focus on identifying the key industry influencers. The data thus presented is comprehensive, reliable, and the result of extensive research, both primary and secondary.

              INFORMATION SOURCES

              Primary sources

              • Manufacturers and suppliers
              • Channel partners
              • Industry experts
              • Strategic decision makers

              Secondary sources

              • Industry journals and periodicals
              • Government data
              • Financial reports of key industry players
              • Historical data
              • Press releases

              DATA ANALYSIS

              Data Synthesis

              • Collation of data
              • Estimation of key figures
              • Analysis of derived insights

              Data Validation

              • Triangulation with data models
              • Reference against proprietary databases
              • Corroboration with industry experts

              REPORT WRITING

              Qualitative

              • Market drivers
              • Market challenges
              • Market trends
              • Five forces analysis

              Quantitative

              • Market size and forecast
              • Market segmentation
              • Geographical insights
              • Competitive landscape

              Interested in this report?

              Get your sample now to see our research methodology and insights!

              Download Now

              Frequently Asked Questions

              Offshore Wind Power market growth will increase by $ 33960 mn during 2024-2028 .

              The Offshore Wind Power market is expected to grow at a CAGR of 17.17% during 2024-2028 .

              Offshore Wind Power market is segmented by Type( Monopile, Jacket, Others) Product Type( Fixed structure, Floating structure, North America, South America, Middle East and Africa)

              CAPE Holland BV, China Steel Corp., Dongfang Electric Corp. Ltd., Doosan Corp., Erndtebcker Eisenwerk GmbH and Co KG, General Electric Co., Hyosung Heavy Industries Corp., Hyundai Heavy Industries Co. Ltd., JDR Cable Systems Ltd., Lamprell Plc, Nexans SA, NKT AS, Nordex SE, Prysmian Spa, Senvion Wind Technology Pvt. Ltd., Siemens Gamesa Renewable Energy SA, Sinovel Wind Group Co. Ltd., Verdict Media Ltd., Vestas Wind Systems AS, Xinjiang Goldwind Science and Technology Co. Ltd. are a few of the key vendors in the Offshore Wind Power market.

              Europe will register the highest growth rate of 49% among the other regions. Therefore, the Offshore Wind Power market in Europe is expected to garner significant business opportunities for the vendors during the forecast period.

              UK, Germany, Belgium, US, Japan

              • Rise in global energy demandAccording to the International Energy Agency (IEA) is the driving factor this market.
              • in 2021 is the driving factor this market.
              • the global economy grew at a rate of 6.0% as compared to 2020. There was strong growth in the global energy demand due to robust economic growth. As a result is the driving factor this market.
              • in 2021 is the driving factor this market.
              • the global energy demand grew by 4.6% compared with 2020. This growth in energy demand was mainly propelled by countries such as China is the driving factor this market.
              • the US is the driving factor this market.
              • and India is the driving factor this market.
              • which accounted for nearly 70% of this growth.Moreover is the driving factor this market.
              • according to the IEA is the driving factor this market.
              • the global electricity demand increased twofold during 1990-2022 and has outpaced the growth in the demand for other fuel sources. Compared with 2017 is the driving factor this market.
              • the global demand for electricity is expected to grow twofold compared with the global energy demand is the driving factor this market.
              • which is expected to rise by more than 25% by 2040. This growth in electricity demand is being propelled by emerging economies such as India and China. In 2018 is the driving factor this market.
              • in India is the driving factor this market.
              • the electricity demand grew by 5% per annum due to the country aim of achieving universal electricity access by 2025. Similarly is the driving factor this market.
              • over the next two decades is the driving factor this market.
              • China is expected to add a power system equivalent to that of the US as of 2018. Additionally is the driving factor this market.
              • the global population is expected to grow significantly during the forecast period. Hence is the driving factor this market.
              • with the growth of the population and the resulting increase in economic activities is the driving factor this market.
              • electricity demand is expected to grow significantly during the forecast period.Factors such as the electrification of the heat and transportation sectors is the driving factor this market.
              • the growth in the number of electronically connected devices is the driving factor this market.
              • and the digitalization of modern economies have been encouraging the electrification of global energy systems. Moreover is the driving factor this market.
              • the demand for energy services such as air-conditioning is expected to rise in households in tandem with the growth in income levels. Furthermore is the driving factor this market.
              • the use of electric motor systems in industries is fueling the energy demand in the industrial sector.Hence is the driving factor this market.
              • the growth in energy demand is the driving factor this market.
              • coupled with the government initiatives to increase the adoption of clean energy technologies is the driving factor this market.
              • is expected to augment the growth of the global offshore wind power market during the forecast period. is the driving factor this market.

              The Offshore Wind Power market vendors should focus on grabbing business opportunities from the Monopile segment as it accounted for the largest market share in the base year.