Wind Turbine Components Market Analysis, Size, and Forecast 2026-2030: APAC (China, India, and Japan), Europe (Germany, UK, and France), North America (US, Canada, and Mexico), South America (Brazil, Argentina, and Colombia), Middle East and Africa (South Africa, Saudi Arabia, and UAE), and Rest of World (ROW)

Wind Turbine Components Market Analysis, Size, and Forecast 2026-2030:
APAC (China, India, and Japan), Europe (Germany, UK, and France), North America (US, Canada, and Mexico), South America (Brazil, Argentina, and Colombia), Middle East and Africa (South Africa, Saudi Arabia, and UAE), and Rest of World (ROW)

Published: Mar 2026 302 Pages SKU: IRTNTR70093

Market Overview at a Glance

$49.11 B
Market Opportunity
7%
CAGR 2025 - 2030
49.8%
APAC Growth
$85.60 B
Onshore segment 2024

Wind Turbine Components Market Size 2026-2030

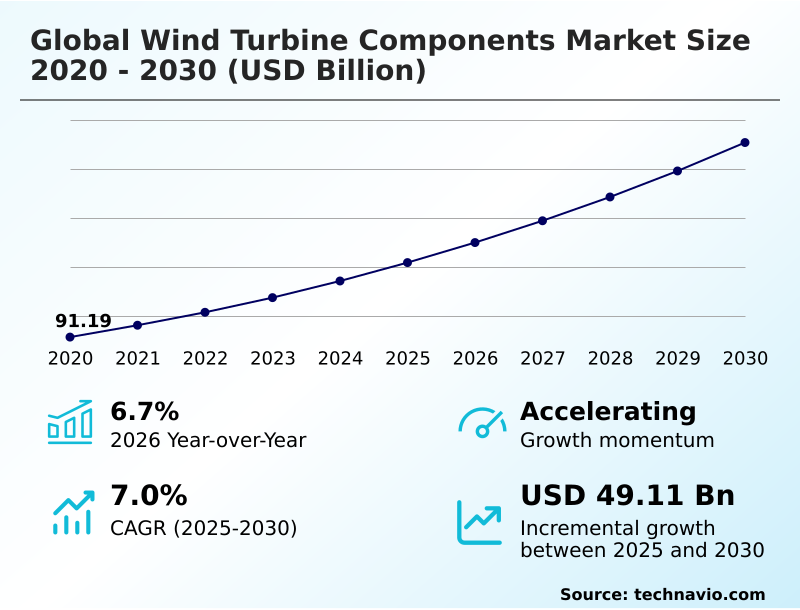
The wind turbine components market size is valued to increase by USD 49.11 billion, at a CAGR of 7% from 2025 to 2030. Rapid growth of global wind power industry will drive the wind turbine components market.

Major Market Trends & Insights

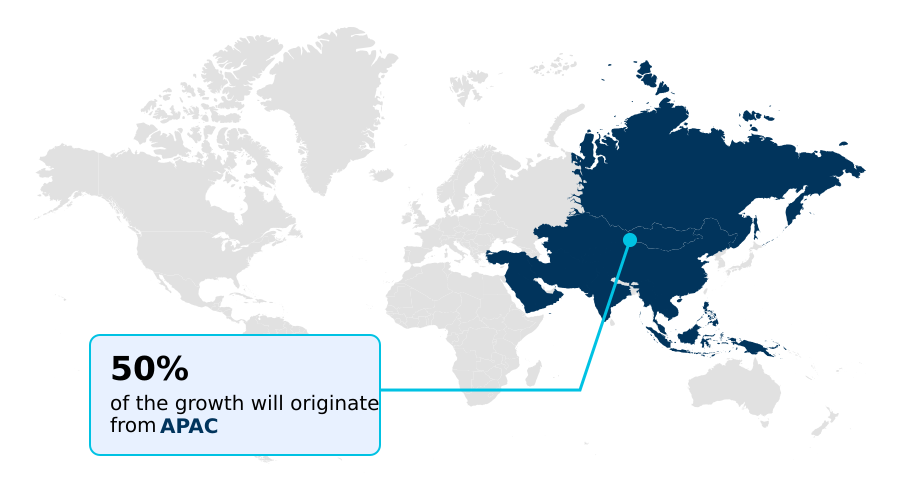
  • APAC dominated the market and accounted for a 49.8% growth during the forecast period.
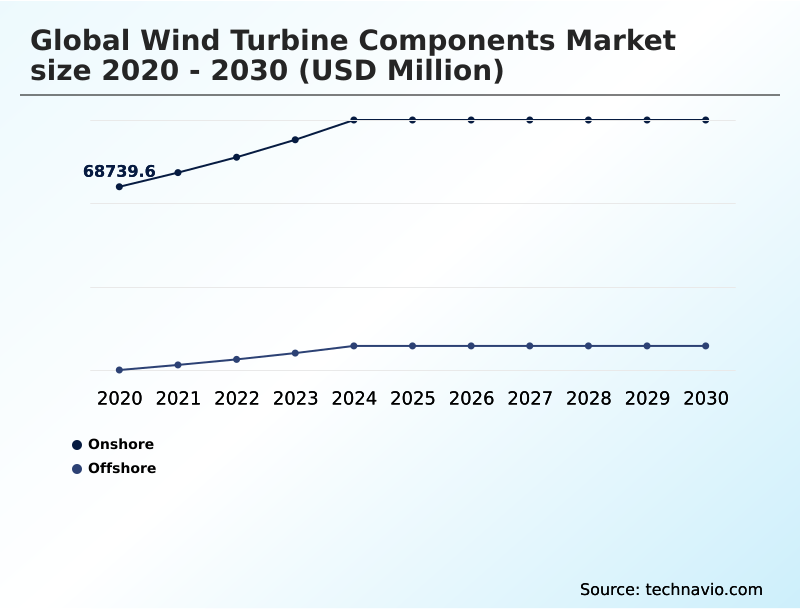
  • By Application - Onshore segment was valued at USD 85.60 billion in 2024
  • By Product - Wind turbine rotor blades segment accounted for the largest market revenue share in 2024

Market Size & Forecast

  • Market Opportunities: USD 79.59 billion
  • Market Future Opportunities: USD 49.11 billion
  • CAGR from 2025 to 2030 : 7%

Market Summary

  • The wind turbine components market is fundamental to the global energy transition, providing the essential hardware that converts wind into electrical power. This industry encompasses the design, manufacturing, and supply of parts ranging from massive wind turbine rotor blades and towers to intricate wind turbine gearboxes and power electronics.
  • Key drivers include the rapid expansion of wind energy capacity, substantial investments in clean energy, and favorable government regulations promoting renewables. However, the sector faces considerable challenges, including material science complexities, such as the need for recyclable carbon-fiber-reinforced polymers, and the logistical hurdles of transporting oversized components.
  • A critical business scenario involves manufacturers balancing the high cost of rare earth elements for direct-drive systems against the need for supply chain optimization. The trend towards larger, more powerful offshore turbines, requiring robust monopiles and floating platforms, is pushing engineering boundaries.
  • Simultaneously, the integration of wind-solar hybrid plants with battery storage demands more sophisticated control systems and grid-forming inverters, underscoring the market's evolution toward creating resilient, high-performance energy ecosystems that can meet modern grid demands and sustainability goals.

What will be the Size of the Wind Turbine Components Market during the forecast period?

Get Key Insights on Market Forecast (PDF) Request Free Sample

How is the Wind Turbine Components Market Segmented?

The wind turbine components industry research report provides comprehensive data (region-wise segment analysis), with forecasts and estimates in "USD million" for the period 2026-2030, as well as historical data from 2020-2024 for the following segments.

  • Application
    • Onshore
    • Offshore
  • Product
    • Wind turbine rotor blades
    • Wind turbine gearboxes
    • Wind turbine generators
    • Wind turbine towers
    • Others
  • End-user
    • Utility
    • Commercial and industrial
    • Residential
  • Geography
    • APAC
      • China
      • India
      • Japan
    • Europe
      • Germany
      • UK
      • France
    • North America
      • US
      • Canada
      • Mexico
    • South America
      • Brazil
      • Argentina
      • Colombia
    • Middle East and Africa
      • South Africa
      • Saudi Arabia
      • UAE
    • Rest of World (ROW)

By Application Insights

The onshore segment is estimated to witness significant growth during the forecast period.

The onshore segment represents the most established application, focusing on the continuous refinement of mechanical parts for land-based terrains. Component manufacturing prioritizes the standardization of tubular steel towers and optimizing rotor diameters to suit diverse wind speeds.

The development of pitch drives and yaw systems is influenced by the need for cost reduction, operational longevity, and noise mitigation in populated areas.

Engineering efforts are directed toward creating modular tower designs and high-torque drivetrains for easier assembly, reducing project installation costs by over 15%.

The integration of advanced sensors and condition monitoring systems provides real-time data on structural components, supporting predictive maintenance strategies. This focus ensures high asset lifecycle management and minimal downtime across the operational fleet.

Request Free Sample

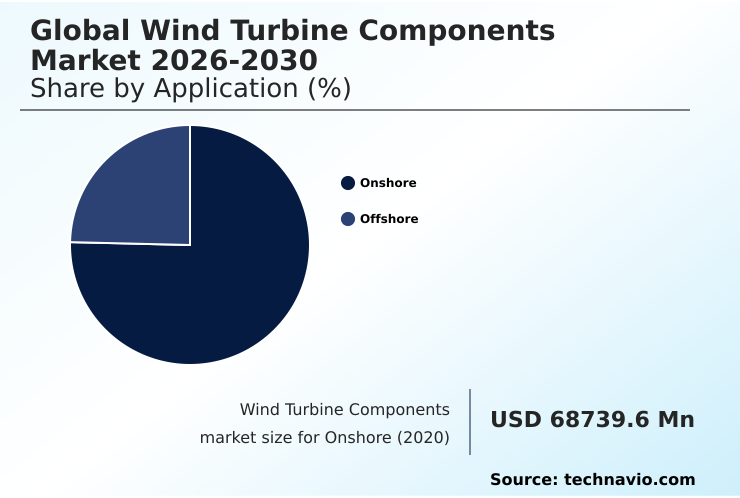
The Onshore segment was valued at USD 85.60 billion in 2024 and showed a gradual increase during the forecast period.

Request Free Sample

Regional Analysis

APAC is estimated to contribute 49.8% to the growth of the global market during the forecast period.Technavio’s analysts have elaborately explained the regional trends and drivers that shape the market during the forecast period.

See How Wind Turbine Components Market Demand is Rising in APAC Request Free Sample

The geographic landscape is undergoing a significant transformation, with APAC emerging as the primary growth engine, contributing nearly 50% of the incremental growth.

This expansion is driven by extensive onshore and offshore projects in China, supported by strong government initiatives and feed-in tariffs. In contrast, Europe’s mature market focuses on high-technology, including advanced power conversion systems and repowering projects to upgrade aging infrastructure.

North America is experiencing steady growth, supported by tax incentives that have spurred a 15% increase in domestic orders for wind turbine generators and control systems.

The development of high-power density generators and specialized composite materials is crucial for all regions.

This regional diversification, influenced by local content provisions and distinct energy targets, creates a complex but opportunity-rich environment for suppliers of pitch control mechanisms and other key hardware.

Market Dynamics

Our researchers analyzed the data with 2025 as the base year, along with the key drivers, trends, and challenges. A holistic analysis of drivers will help companies refine their marketing strategies to gain a competitive advantage.

  • The evolution of the wind turbine components market is marked by increasing specialization across its core segments. Onshore wind turbine component manufacturing continues to be driven by cost-efficiency and modularity, focusing on modular components for remote site assembly to streamline logistics.
  • In contrast, the offshore sector is defined by the complex engineering challenges of offshore wind farm foundation design and the critical need for advanced corrosion protection for marine environments. The ongoing direct-drive vs geared drivetrain cost debate influences technological roadmaps, with decisions hinging on the impact of rare earth elements pricing and long-term maintenance projections.
  • Sustainability is a growing concern, pushing for innovations in recyclable wind turbine blade materials and the adoption of a circular economy in the wind turbine industry. The rise of hybrid projects demands sophisticated wind-solar hybrid plant control systems to ensure grid stability with high renewable penetration.
  • Consequently, high-capacity turbine predictive maintenance and structural health monitoring for turbine towers have become standard. The implementation of these digital solutions has been shown to reduce supply chain disruptions for spare parts by over 25% compared to reactive maintenance schedules, directly impacting operational planning and profitability.

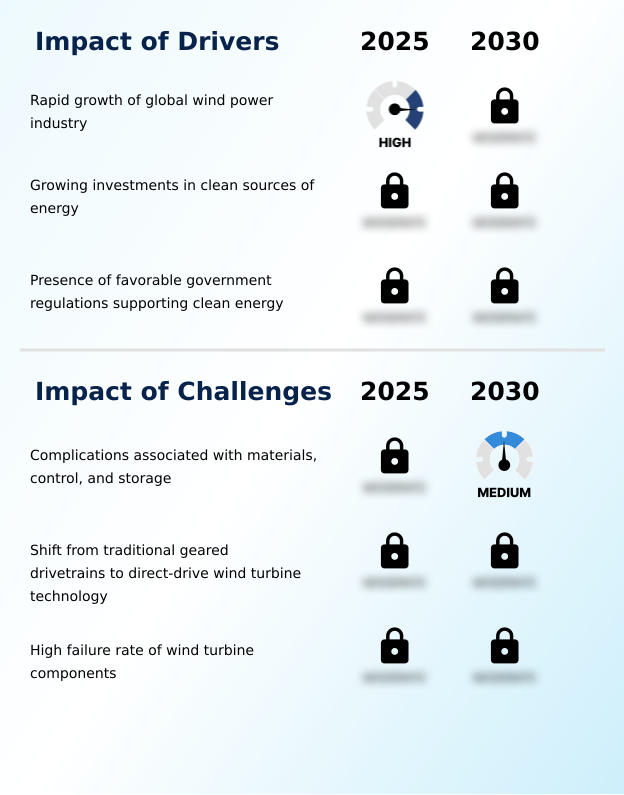
What are the key market drivers leading to the rise in the adoption of Wind Turbine Components Industry?

  • The rapid growth of the global wind power industry is a key driver propelling expansion in the wind turbine components market.

  • The market's expansion is fueled by the rapid growth of global wind power capacity, underpinned by strong government support and massive capital investment.
  • Favorable regulations, including tax credits and power purchase agreements, have directly spurred a 15% increase in domestic orders for wind turbine towers and lattice towers in key regions.
  • The influx of ESG-focused capital has been equally crucial, with dedicated credit facilities reducing the cost of debt for manufacturers of sub-station hardware by as much as two percentage points.
  • This financial backing enables significant supply chain optimization and investment in new production facilities.
  • The global push for decarbonization and the urgent need to replace fossil fuel plants ensure a massive, long-term order book, driving both mechanical stress analysis and innovation across the board.

What are the market trends shaping the Wind Turbine Components Industry?

  • A key trend shaping the market is the consistently declining cost of wind power. This makes wind energy increasingly accessible and economically competitive against traditional power sources.

  • Key trends are reshaping the market, led by the falling levelized cost of energy, which makes wind power highly competitive. This is driven by the development of larger, more powerful units requiring fewer subsea foundations, which improves the capacity factor by up to 20%.
  • The move toward wind-solar hybrid plants, supported by advanced energy storage systems, is creating demand for hardware with enhanced grid-forming capability. These hybrid systems improve grid integration and can provide a more consistent power flow. Concurrently, the expansion into deep-water offshore wind is driving demand for super-turbines, some exceeding 20MW, which require specialized floating platforms and advanced corrosion-resistant coatings.
  • This innovation in blade root sections and drive train peripherals enables energy yields over 30% higher than typical onshore sites.

What challenges does the Wind Turbine Components Industry face during its growth?

  • Significant industry growth is challenged by complications associated with advanced materials, sophisticated control systems, and large-scale energy storage.

  • Significant challenges constrain market growth, primarily related to materials, technology, and reliability. The reliance on advanced carbon-fiber-reinforced polymers and other composite materials for larger blades creates end-of-life recycling issues and heightens the need for circular economy models.
  • The transition to direct-drive wind turbine technology introduces supply chain vulnerabilities, as the price of essential rare earth elements can surge by over 50% due to geopolitical factors. Furthermore, high failure rates of critical wind turbine components like gearboxes and main bearings, especially in harsh offshore environments, remain a major concern.
  • These premature failures can lead to warranty claims that erode up to 10% of a project's profitability, highlighting the importance of rigorous aerodynamic load testing and quality control.

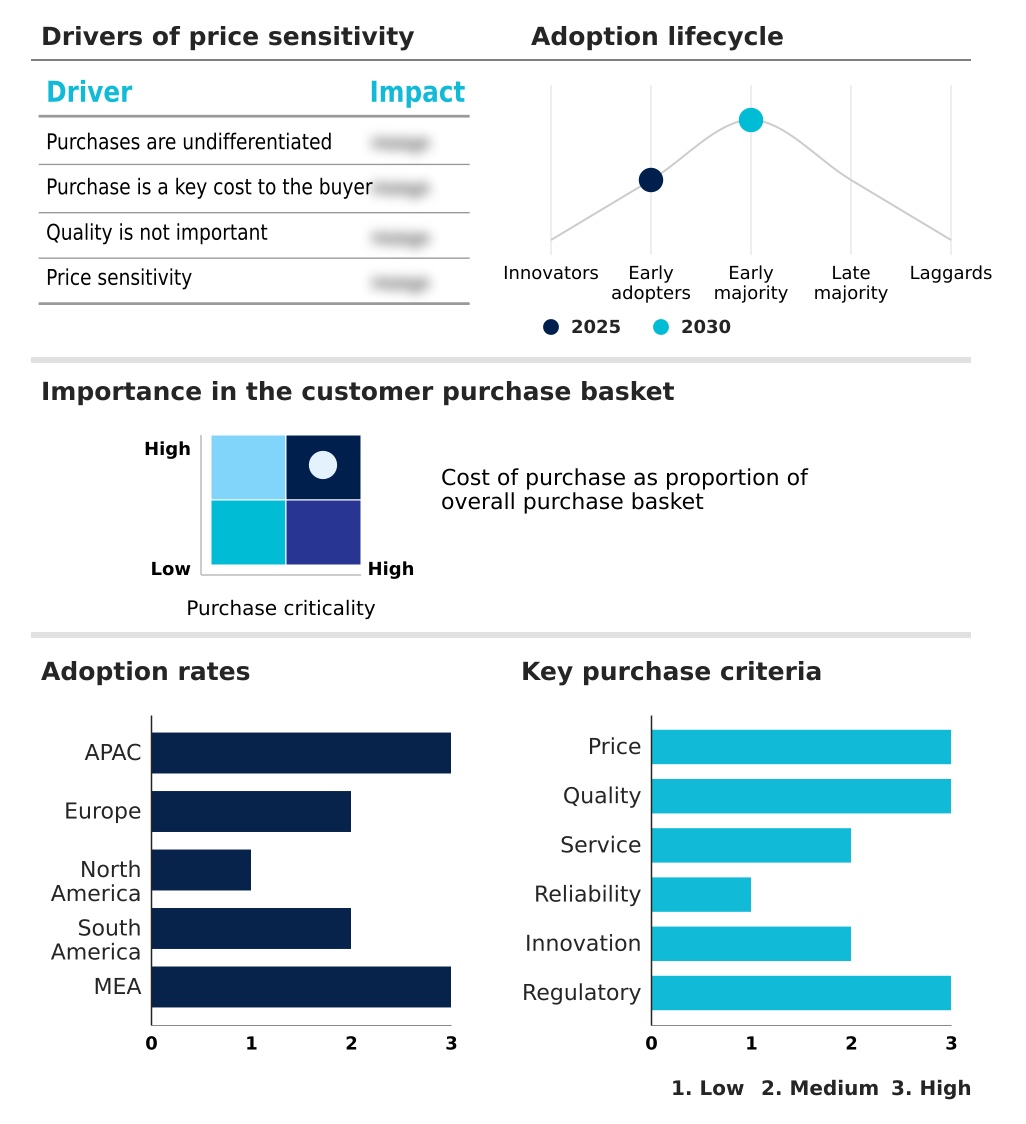
Exclusive Technavio Analysis on Customer Landscape

The wind turbine components market forecasting report includes the adoption lifecycle of the market, covering from the innovator’s stage to the laggard’s stage. It focuses on adoption rates in different regions based on penetration. Furthermore, the wind turbine components market report also includes key purchase criteria and drivers of price sensitivity to help companies evaluate and develop their market growth analysis strategies.

Customer Landscape of Wind Turbine Components Industry

Competitive Landscape

Companies are implementing various strategies, such as strategic alliances, wind turbine components market forecast, partnerships, mergers and acquisitions, geographical expansion, and product/service launches, to enhance their presence in the industry.

CS WIND Corp. - Offerings include a comprehensive range of wind turbine components, from structural towers and offshore substructures to integrated power solutions and drivetrain peripherals for renewable energy projects.

The industry research and growth report includes detailed analyses of the competitive landscape of the market and information about key companies, including:

  • CS WIND Corp.
  • Dongfang Electric Corp. Ltd.
  • EnBW Energie Baden Wurttemberg
  • ENERCON GmbH
  • Envision Group
  • Flender GmbH
  • GE Vernova Inc.
  • Goldwind Science and Technology
  • Gurit Holding AG
  • ISHIBASHI Manufacturing Co
  • LM Wind Power
  • Max Bogl Wind AG
  • Nanjing High Speed Gear
  • Siemens Gamesa Renewable Energy
  • Silbitz Group GmbH
  • TPI Composites Inc.
  • Vestas Wind Systems AS
  • Wheels India Ltd.
  • XEMC Darwind BV
  • ZF Friedrichshafen AG

Qualitative and quantitative analysis of companies has been conducted to help clients understand the wider business environment as well as the strengths and weaknesses of key industry players. Data is qualitatively analyzed to categorize companies as pure play, category-focused, industry-focused, and diversified; it is quantitatively analyzed to categorize companies as dominant, leading, strong, tentative, and weak.

Recent Development and News in Wind turbine components market

  • In August, 2024, a leading developer completed the world's largest wind-solar hybrid facility in North Africa, utilizing specialized control modules to demonstrate high technical synergy between variable renewable sources.
  • In January, 2025, a major European grid operator implemented stringent new technical requirements for sub-station hardware, compelling suppliers in the market to redesign power electronics to manage rapid voltage fluctuations.
  • In March, 2025, a prominent international wind developer reported a widespread structural defect in a specific series of generator bearings, triggering a global recall and a subsequent surge in demand for specialized maritime cranes and replacement parts.
  • In May, 2025, a consortium of major investment banks announced a USD 50 billion credit facility for offshore wind infrastructure, which immediately spurred a wave of new contracts for subsea foundations and high-tension cables.

Dive into Technavio’s robust research methodology, blending expert interviews, extensive data synthesis, and validated models for unparalleled Wind Turbine Components Market insights. See full methodology.

Market Scope
Page number 302
Base year 2025
Historic period 2020-2024
Forecast period 2026-2030
Growth momentum & CAGR Accelerate at a CAGR of 7%
Market growth 2026-2030 USD 49109.2 million
Market structure Fragmented
YoY growth 2025-2026(%) 6.7%
Key countries China, India, Japan, South Korea, Vietnam, Indonesia, Germany, UK, France, Spain, Italy, The Netherlands, US, Canada, Mexico, Brazil, Argentina, Colombia, South Africa, Saudi Arabia, UAE, Egypt and Morocco
Competitive landscape Leading Companies, Market Positioning of Companies, Competitive Strategies, and Industry Risks

Request Free Sample

Research Analyst Overview

  • The wind turbine components market is advancing through intense technological competition and a focus on lifecycle value. Core hardware such as wind turbine rotor blades, nacelle housing, and sophisticated wind turbine gearboxes are evolving to meet demands for higher capacity and reliability.
  • The strategic shift toward direct-drive systems is a critical boardroom consideration, forcing a re-evaluation of supply chain dependencies on permanent magnets and rare earth elements versus investing in alternative technologies like doubly-fed induction generators.
  • Advancements in material science, particularly with carbon-fiber-reinforced polymers, have enabled the creation of blades that are 10% longer while maintaining structural integrity, boosting the overall capacity factor. This push for innovation extends to power electronics and high-voltage control systems, which are essential for managing grid integration.
  • The development of annular generators and robust main bearings underscores the industry's commitment to engineering excellence. Ultimately, success hinges on a manufacturer's ability to balance performance improvements with the economic realities of sourcing and production in a highly dynamic global landscape.

What are the Key Data Covered in this Wind Turbine Components Market Research and Growth Report?

  • What is the expected growth of the Wind Turbine Components Market between 2026 and 2030?

    • USD 49.11 billion, at a CAGR of 7%

  • What segmentation does the market report cover?

    • The report is segmented by Application (Onshore, and Offshore), Product (Wind turbine rotor blades, Wind turbine gearboxes, Wind turbine generators, Wind turbine towers, and Others), End-user (Utility, Commercial and industrial, and Residential) and Geography (APAC, Europe, North America, South America, Middle East and Africa)

  • Which regions are analyzed in the report?

    • APAC, Europe, North America, South America and Middle East and Africa

  • What are the key growth drivers and market challenges?

    • Rapid growth of global wind power industry, Complications associated with materials, control, and storage

  • Who are the major players in the Wind Turbine Components Market?

    • CS WIND Corp., Dongfang Electric Corp. Ltd., EnBW Energie Baden Wurttemberg, ENERCON GmbH, Envision Group, Flender GmbH, GE Vernova Inc., Goldwind Science and Technology, Gurit Holding AG, ISHIBASHI Manufacturing Co, LM Wind Power, Max Bogl Wind AG, Nanjing High Speed Gear, Siemens Gamesa Renewable Energy, Silbitz Group GmbH, TPI Composites Inc., Vestas Wind Systems AS, Wheels India Ltd., XEMC Darwind BV and ZF Friedrichshafen AG

Market Research Insights

  • The market's dynamics are shaped by a strategic focus on improving operational efficiency and asset longevity. Innovations in remote sensing technology and a commitment to zero-defect performance are critical, with implementations of digital twins reducing unscheduled equipment downtime by an average of 20%.
  • The industry-wide adoption of predictive maintenance protocols has enhanced material traceability and extended the lifespan of critical machinery, optimizing total cost of ownership. Furthermore, the emphasis on achieving dispatchable renewable energy through advanced energy storage systems has improved grid stability by over 15%, reinforcing the value proposition for utility-scale investments.
  • This continuous drive for technical synergy and superior operational throughput defines the competitive landscape.

We can help! Our analysts can customize this wind turbine components market research report to meet your requirements.

Get in touch

1. Executive Summary

1.1 Market overview

Executive Summary - Chart on Market Overview
Executive Summary - Data Table on Market Overview
Executive Summary - Chart on Global Market Characteristics
Executive Summary - Chart on Market by Geography
Executive Summary - Chart on Market Segmentation by Application
Executive Summary - Chart on Market Segmentation by Product
Executive Summary - Chart on Market Segmentation by End-user
Executive Summary - Chart on Incremental Growth
Executive Summary - Data Table on Incremental Growth
Executive Summary - Chart on Company Market Positioning

2. Technavio Analysis

2.1 Analysis of price sensitivity, lifecycle, customer purchase basket, adoption rates, and purchase criteria

2.2 Criticality of inputs and Factors of differentiation

Chart on Overview on criticality of inputs and factors of differentiation

2.3 Factors of disruption

Chart on Overview on factors of disruption

2.4 Impact of drivers and challenges

Chart on Impact of drivers and challenges in 2025 and 2030

3. Market Landscape

3.1 Market ecosystem

Chart on Parent Market
Data Table on - Parent Market

3.2 Market characteristics

Chart on Market characteristics analysis

3.3 Value chain analysis

Chart on Value chain analysis

4. Market Sizing

4.1 Market definition

Data Table on Offerings of companies included in the market definition

4.2 Market segment analysis

Market segments

4.3 Market size 2025

4.4 Market outlook: Forecast for 2025-2030

Chart on Global - Market size and forecast 2025-2030 ($ million)
Data Table on Global - Market size and forecast 2025-2030 ($ million)
Chart on Global Market: Year-over-year growth 2025-2030 (%)
Data Table on Global Market: Year-over-year growth 2025-2030 (%)

5. Historic Market Size

5.1 Global Wind Turbine Components Market 2020 - 2024

Historic Market Size - Data Table on Global Wind Turbine Components Market 2020 - 2024 ($ million)

5.2 Application segment analysis 2020 - 2024

Historic Market Size - Application Segment 2020 - 2024 ($ million)

5.3 Product segment analysis 2020 - 2024

Historic Market Size - Product Segment 2020 - 2024 ($ million)

5.4 End-user segment analysis 2020 - 2024

Historic Market Size - End-user Segment 2020 - 2024 ($ million)

5.5 Geography segment analysis 2020 - 2024

Historic Market Size - Geography Segment 2020 - 2024 ($ million)

5.6 Country segment analysis 2020 - 2024

Historic Market Size - Country Segment 2020 - 2024 ($ million)

6. Qualitative Analysis

6.1 Impact of AI on Global Wind Turbine Components Market

6.2 Impact of Geopolitical Conflicts on Global Wind Turbine Components Market

7. Five Forces Analysis

7.1 Five forces summary

Five forces analysis - Comparison between 2025 and 2030

7.2 Bargaining power of buyers

Bargaining power of buyers - Impact of key factors 2025 and 2030

7.3 Bargaining power of suppliers

Bargaining power of suppliers - Impact of key factors in 2025 and 2030

7.4 Threat of new entrants

Threat of new entrants - Impact of key factors in 2025 and 2030

7.5 Threat of substitutes

Threat of substitutes - Impact of key factors in 2025 and 2030

7.6 Threat of rivalry

Threat of rivalry - Impact of key factors in 2025 and 2030

7.7 Market condition

Chart on Market condition - Five forces 2025 and 2030

8. Market Segmentation by Application

8.1 Market segments

Chart on Application - Market share 2025-2030 (%)
Data Table on Application - Market share 2025-2030 (%)

8.2 Comparison by Application

Chart on Comparison by Application
Data Table on Comparison by Application

8.3 Onshore - Market size and forecast 2025-2030

Chart on Onshore - Market size and forecast 2025-2030 ($ million)
Data Table on Onshore - Market size and forecast 2025-2030 ($ million)
Chart on Onshore - Year-over-year growth 2025-2030 (%)
Data Table on Onshore - Year-over-year growth 2025-2030 (%)

8.4 Offshore - Market size and forecast 2025-2030

Chart on Offshore - Market size and forecast 2025-2030 ($ million)
Data Table on Offshore - Market size and forecast 2025-2030 ($ million)
Chart on Offshore - Year-over-year growth 2025-2030 (%)
Data Table on Offshore - Year-over-year growth 2025-2030 (%)

8.5 Market opportunity by Application

Market opportunity by Application ($ million)
Data Table on Market opportunity by Application ($ million)

9. Market Segmentation by Product

9.1 Market segments

Chart on Product - Market share 2025-2030 (%)
Data Table on Product - Market share 2025-2030 (%)

9.2 Comparison by Product

Chart on Comparison by Product
Data Table on Comparison by Product

9.3 Wind turbine rotor blades - Market size and forecast 2025-2030

Chart on Wind turbine rotor blades - Market size and forecast 2025-2030 ($ million)
Data Table on Wind turbine rotor blades - Market size and forecast 2025-2030 ($ million)
Chart on Wind turbine rotor blades - Year-over-year growth 2025-2030 (%)
Data Table on Wind turbine rotor blades - Year-over-year growth 2025-2030 (%)

9.4 Wind turbine gearboxes - Market size and forecast 2025-2030

Chart on Wind turbine gearboxes - Market size and forecast 2025-2030 ($ million)
Data Table on Wind turbine gearboxes - Market size and forecast 2025-2030 ($ million)
Chart on Wind turbine gearboxes - Year-over-year growth 2025-2030 (%)
Data Table on Wind turbine gearboxes - Year-over-year growth 2025-2030 (%)

9.5 Wind turbine generators - Market size and forecast 2025-2030

Chart on Wind turbine generators - Market size and forecast 2025-2030 ($ million)
Data Table on Wind turbine generators - Market size and forecast 2025-2030 ($ million)
Chart on Wind turbine generators - Year-over-year growth 2025-2030 (%)
Data Table on Wind turbine generators - Year-over-year growth 2025-2030 (%)

9.6 Wind turbine towers - Market size and forecast 2025-2030

Chart on Wind turbine towers - Market size and forecast 2025-2030 ($ million)
Data Table on Wind turbine towers - Market size and forecast 2025-2030 ($ million)
Chart on Wind turbine towers - Year-over-year growth 2025-2030 (%)
Data Table on Wind turbine towers - Year-over-year growth 2025-2030 (%)

9.7 Others - Market size and forecast 2025-2030

Chart on Others - Market size and forecast 2025-2030 ($ million)
Data Table on Others - Market size and forecast 2025-2030 ($ million)
Chart on Others - Year-over-year growth 2025-2030 (%)
Data Table on Others - Year-over-year growth 2025-2030 (%)

9.8 Market opportunity by Product

Market opportunity by Product ($ million)
Data Table on Market opportunity by Product ($ million)

10. Market Segmentation by End-user

10.1 Market segments

Chart on End-user - Market share 2025-2030 (%)
Data Table on End-user - Market share 2025-2030 (%)

10.2 Comparison by End-user

Chart on Comparison by End-user
Data Table on Comparison by End-user

10.3 Utility - Market size and forecast 2025-2030

Chart on Utility - Market size and forecast 2025-2030 ($ million)
Data Table on Utility - Market size and forecast 2025-2030 ($ million)
Chart on Utility - Year-over-year growth 2025-2030 (%)
Data Table on Utility - Year-over-year growth 2025-2030 (%)

10.4 Commercial and industrial - Market size and forecast 2025-2030

Chart on Commercial and industrial - Market size and forecast 2025-2030 ($ million)
Data Table on Commercial and industrial - Market size and forecast 2025-2030 ($ million)
Chart on Commercial and industrial - Year-over-year growth 2025-2030 (%)
Data Table on Commercial and industrial - Year-over-year growth 2025-2030 (%)

10.5 Residential - Market size and forecast 2025-2030

Chart on Residential - Market size and forecast 2025-2030 ($ million)
Data Table on Residential - Market size and forecast 2025-2030 ($ million)
Chart on Residential - Year-over-year growth 2025-2030 (%)
Data Table on Residential - Year-over-year growth 2025-2030 (%)

10.6 Market opportunity by End-user

Market opportunity by End-user ($ million)
Data Table on Market opportunity by End-user ($ million)

11. Customer Landscape

11.1 Customer landscape overview

Analysis of price sensitivity, lifecycle, customer purchase basket, adoption rates, and purchase criteria

12. Geographic Landscape

12.1 Geographic segmentation

Chart on Market share by geography 2025-2030 (%)
Data Table on Market share by geography 2025-2030 (%)

12.2 Geographic comparison

Chart on Geographic comparison
Data Table on Geographic comparison

12.3 APAC - Market size and forecast 2025-2030

Chart on APAC - Market size and forecast 2025-2030 ($ million)
Data Table on APAC - Market size and forecast 2025-2030 ($ million)
Chart on APAC - Year-over-year growth 2025-2030 (%)
Data Table on APAC - Year-over-year growth 2025-2030 (%)
Chart on Regional Comparison - APAC
Data Table on Regional Comparison - APAC

12.3.1 China - Market size and forecast 2025-2030

Chart on China - Market size and forecast 2025-2030 ($ million)
Data Table on China - Market size and forecast 2025-2030 ($ million)
Chart on China - Year-over-year growth 2025-2030 (%)
Data Table on China - Year-over-year growth 2025-2030 (%)

12.3.2 India - Market size and forecast 2025-2030

Chart on India - Market size and forecast 2025-2030 ($ million)
Data Table on India - Market size and forecast 2025-2030 ($ million)
Chart on India - Year-over-year growth 2025-2030 (%)
Data Table on India - Year-over-year growth 2025-2030 (%)

12.3.3 Japan - Market size and forecast 2025-2030

Chart on Japan - Market size and forecast 2025-2030 ($ million)
Data Table on Japan - Market size and forecast 2025-2030 ($ million)
Chart on Japan - Year-over-year growth 2025-2030 (%)
Data Table on Japan - Year-over-year growth 2025-2030 (%)

12.3.4 South Korea - Market size and forecast 2025-2030

Chart on South Korea - Market size and forecast 2025-2030 ($ million)
Data Table on South Korea - Market size and forecast 2025-2030 ($ million)
Chart on South Korea - Year-over-year growth 2025-2030 (%)
Data Table on South Korea - Year-over-year growth 2025-2030 (%)

12.3.5 Vietnam - Market size and forecast 2025-2030

Chart on Vietnam - Market size and forecast 2025-2030 ($ million)
Data Table on Vietnam - Market size and forecast 2025-2030 ($ million)
Chart on Vietnam - Year-over-year growth 2025-2030 (%)
Data Table on Vietnam - Year-over-year growth 2025-2030 (%)

12.3.6 Indonesia - Market size and forecast 2025-2030

Chart on Indonesia - Market size and forecast 2025-2030 ($ million)
Data Table on Indonesia - Market size and forecast 2025-2030 ($ million)
Chart on Indonesia - Year-over-year growth 2025-2030 (%)
Data Table on Indonesia - Year-over-year growth 2025-2030 (%)

12.4 Europe - Market size and forecast 2025-2030

Chart on Europe - Market size and forecast 2025-2030 ($ million)
Data Table on Europe - Market size and forecast 2025-2030 ($ million)
Chart on Europe - Year-over-year growth 2025-2030 (%)
Data Table on Europe - Year-over-year growth 2025-2030 (%)
Chart on Regional Comparison - Europe
Data Table on Regional Comparison - Europe

12.4.1 Germany - Market size and forecast 2025-2030

Chart on Germany - Market size and forecast 2025-2030 ($ million)
Data Table on Germany - Market size and forecast 2025-2030 ($ million)
Chart on Germany - Year-over-year growth 2025-2030 (%)
Data Table on Germany - Year-over-year growth 2025-2030 (%)

12.4.2 UK - Market size and forecast 2025-2030

Chart on UK - Market size and forecast 2025-2030 ($ million)
Data Table on UK - Market size and forecast 2025-2030 ($ million)
Chart on UK - Year-over-year growth 2025-2030 (%)
Data Table on UK - Year-over-year growth 2025-2030 (%)

12.4.3 France - Market size and forecast 2025-2030

Chart on France - Market size and forecast 2025-2030 ($ million)
Data Table on France - Market size and forecast 2025-2030 ($ million)
Chart on France - Year-over-year growth 2025-2030 (%)
Data Table on France - Year-over-year growth 2025-2030 (%)

12.4.4 Spain - Market size and forecast 2025-2030

Chart on Spain - Market size and forecast 2025-2030 ($ million)
Data Table on Spain - Market size and forecast 2025-2030 ($ million)
Chart on Spain - Year-over-year growth 2025-2030 (%)
Data Table on Spain - Year-over-year growth 2025-2030 (%)

12.4.5 Italy - Market size and forecast 2025-2030

Chart on Italy - Market size and forecast 2025-2030 ($ million)
Data Table on Italy - Market size and forecast 2025-2030 ($ million)
Chart on Italy - Year-over-year growth 2025-2030 (%)
Data Table on Italy - Year-over-year growth 2025-2030 (%)

12.4.6 The Netherlands - Market size and forecast 2025-2030

Chart on The Netherlands - Market size and forecast 2025-2030 ($ million)
Data Table on The Netherlands - Market size and forecast 2025-2030 ($ million)
Chart on The Netherlands - Year-over-year growth 2025-2030 (%)
Data Table on The Netherlands - Year-over-year growth 2025-2030 (%)

12.5 North America - Market size and forecast 2025-2030

Chart on North America - Market size and forecast 2025-2030 ($ million)
Data Table on North America - Market size and forecast 2025-2030 ($ million)
Chart on North America - Year-over-year growth 2025-2030 (%)
Data Table on North America - Year-over-year growth 2025-2030 (%)
Chart on Regional Comparison - North America
Data Table on Regional Comparison - North America

12.5.1 US - Market size and forecast 2025-2030

Chart on US - Market size and forecast 2025-2030 ($ million)
Data Table on US - Market size and forecast 2025-2030 ($ million)
Chart on US - Year-over-year growth 2025-2030 (%)
Data Table on US - Year-over-year growth 2025-2030 (%)

12.5.2 Canada - Market size and forecast 2025-2030

Chart on Canada - Market size and forecast 2025-2030 ($ million)
Data Table on Canada - Market size and forecast 2025-2030 ($ million)
Chart on Canada - Year-over-year growth 2025-2030 (%)
Data Table on Canada - Year-over-year growth 2025-2030 (%)

12.5.3 Mexico - Market size and forecast 2025-2030

Chart on Mexico - Market size and forecast 2025-2030 ($ million)
Data Table on Mexico - Market size and forecast 2025-2030 ($ million)
Chart on Mexico - Year-over-year growth 2025-2030 (%)
Data Table on Mexico - Year-over-year growth 2025-2030 (%)

12.6 South America - Market size and forecast 2025-2030

Chart on South America - Market size and forecast 2025-2030 ($ million)
Data Table on South America - Market size and forecast 2025-2030 ($ million)
Chart on South America - Year-over-year growth 2025-2030 (%)
Data Table on South America - Year-over-year growth 2025-2030 (%)
Chart on Regional Comparison - South America
Data Table on Regional Comparison - South America

12.6.1 Brazil - Market size and forecast 2025-2030

Chart on Brazil - Market size and forecast 2025-2030 ($ million)
Data Table on Brazil - Market size and forecast 2025-2030 ($ million)
Chart on Brazil - Year-over-year growth 2025-2030 (%)
Data Table on Brazil - Year-over-year growth 2025-2030 (%)

12.6.2 Argentina - Market size and forecast 2025-2030

Chart on Argentina - Market size and forecast 2025-2030 ($ million)
Data Table on Argentina - Market size and forecast 2025-2030 ($ million)
Chart on Argentina - Year-over-year growth 2025-2030 (%)
Data Table on Argentina - Year-over-year growth 2025-2030 (%)

12.6.3 Colombia - Market size and forecast 2025-2030

Chart on Colombia - Market size and forecast 2025-2030 ($ million)
Data Table on Colombia - Market size and forecast 2025-2030 ($ million)
Chart on Colombia - Year-over-year growth 2025-2030 (%)
Data Table on Colombia - Year-over-year growth 2025-2030 (%)

12.7 Middle East and Africa - Market size and forecast 2025-2030

Chart on Middle East and Africa - Market size and forecast 2025-2030 ($ million)
Data Table on Middle East and Africa - Market size and forecast 2025-2030 ($ million)
Chart on Middle East and Africa - Year-over-year growth 2025-2030 (%)
Data Table on Middle East and Africa - Year-over-year growth 2025-2030 (%)
Chart on Regional Comparison - Middle East and Africa
Data Table on Regional Comparison - Middle East and Africa

12.7.1 South Africa - Market size and forecast 2025-2030

Chart on South Africa - Market size and forecast 2025-2030 ($ million)
Data Table on South Africa - Market size and forecast 2025-2030 ($ million)
Chart on South Africa - Year-over-year growth 2025-2030 (%)
Data Table on South Africa - Year-over-year growth 2025-2030 (%)

12.7.2 Saudi Arabia - Market size and forecast 2025-2030

Chart on Saudi Arabia - Market size and forecast 2025-2030 ($ million)
Data Table on Saudi Arabia - Market size and forecast 2025-2030 ($ million)
Chart on Saudi Arabia - Year-over-year growth 2025-2030 (%)
Data Table on Saudi Arabia - Year-over-year growth 2025-2030 (%)

12.7.3 UAE - Market size and forecast 2025-2030

Chart on UAE - Market size and forecast 2025-2030 ($ million)
Data Table on UAE - Market size and forecast 2025-2030 ($ million)
Chart on UAE - Year-over-year growth 2025-2030 (%)
Data Table on UAE - Year-over-year growth 2025-2030 (%)

12.7.4 Egypt - Market size and forecast 2025-2030

Chart on Egypt - Market size and forecast 2025-2030 ($ million)
Data Table on Egypt - Market size and forecast 2025-2030 ($ million)
Chart on Egypt - Year-over-year growth 2025-2030 (%)
Data Table on Egypt - Year-over-year growth 2025-2030 (%)

12.7.5 Morocco - Market size and forecast 2025-2030

Chart on Morocco - Market size and forecast 2025-2030 ($ million)
Data Table on Morocco - Market size and forecast 2025-2030 ($ million)
Chart on Morocco - Year-over-year growth 2025-2030 (%)
Data Table on Morocco - Year-over-year growth 2025-2030 (%)

12.8 Market opportunity by geography

Market opportunity by geography ($ million)
Data Tables on Market opportunity by geography ($ million)

13. Drivers, Challenges, and Opportunity

13.1 Market drivers

Rapid growth of global wind power industry
Growing investments in clean sources of energy
Presence of favorable government regulations supporting clean energy

13.2 Market challenges

Complications associated with materials, control, and storage
Shift from traditional geared drivetrains to direct-drive wind turbine technology
High failure rate of wind turbine components

13.3 Impact of drivers and challenges

Impact of drivers and challenges in 2025 and 2030

13.4 Market opportunities

Consistently declining cost of wind power
Installation of wind-solar hybrid plants with battery storage
Growing popularity of offshore wind farms

14. Competitive Landscape

14.1 Overview

14.2

Overview on criticality of inputs and factors of differentiation

14.3 Landscape disruption

Overview on factors of disruption

14.4 Industry risks

Impact of key risks on business

15. Competitive Analysis

15.1 Companies profiled

Companies covered

15.2 Company ranking index

15.3 Market positioning of companies

Matrix on companies position and classification

15.4 CS WIND Corp.

CS WIND Corp. - Overview
CS WIND Corp. - Business segments
CS WIND Corp. - Key offerings
CS WIND Corp. - Segment focus
SWOT

15.5 Dongfang Electric Corp. Ltd.

Dongfang Electric Corp. Ltd. - Overview
Dongfang Electric Corp. Ltd. - Product / Service
Dongfang Electric Corp. Ltd. - Key offerings
SWOT

15.6 EnBW Energie Baden Wurttemberg

EnBW Energie Baden Wurttemberg - Overview
EnBW Energie Baden Wurttemberg - Business segments
EnBW Energie Baden Wurttemberg - Key offerings
EnBW Energie Baden Wurttemberg - Segment focus
SWOT

15.7 ENERCON GmbH

ENERCON GmbH - Overview
ENERCON GmbH - Product / Service
ENERCON GmbH - Key offerings
SWOT

15.8 Flender GmbH

Flender GmbH - Overview
Flender GmbH - Product / Service
Flender GmbH - Key offerings
SWOT

15.9 GE Vernova Inc.

GE Vernova Inc. - Overview
GE Vernova Inc. - Business segments
GE Vernova Inc. - Key offerings
GE Vernova Inc. - Segment focus
SWOT

15.10 Goldwind Science and Technology

Goldwind Science and Technology - Overview
Goldwind Science and Technology - Business segments
Goldwind Science and Technology - Key offerings
Goldwind Science and Technology - Segment focus
SWOT

15.11 Gurit Holding AG

Gurit Holding AG - Overview
Gurit Holding AG - Business segments
Gurit Holding AG - Key offerings
Gurit Holding AG - Segment focus
SWOT

15.12 LM Wind Power

LM Wind Power - Overview
LM Wind Power - Product / Service
LM Wind Power - Key offerings
SWOT

15.13 Nanjing High Speed Gear

Nanjing High Speed Gear - Overview
Nanjing High Speed Gear - Product / Service
Nanjing High Speed Gear - Key offerings
SWOT

15.14 Siemens Gamesa Renewable Energy

Siemens Gamesa Renewable Energy - Overview
Siemens Gamesa Renewable Energy - Product / Service
Siemens Gamesa Renewable Energy - Key news
Siemens Gamesa Renewable Energy - Key offerings
SWOT

15.15 TPI Composites Inc.

TPI Composites Inc. - Overview
TPI Composites Inc. - Business segments
TPI Composites Inc. - Key offerings
TPI Composites Inc. - Segment focus
SWOT

15.16 Vestas Wind Systems AS

Vestas Wind Systems AS - Overview
Vestas Wind Systems AS - Business segments
Vestas Wind Systems AS - Key offerings
Vestas Wind Systems AS - Segment focus
SWOT

15.17 Wheels India Ltd.

Wheels India Ltd. - Overview
Wheels India Ltd. - Product / Service
Wheels India Ltd. - Key offerings
SWOT

15.18 ZF Friedrichshafen AG

ZF Friedrichshafen AG - Overview
ZF Friedrichshafen AG - Product / Service
ZF Friedrichshafen AG - Key news
ZF Friedrichshafen AG - Key offerings
SWOT

16. Appendix

16.1 Scope of the report

Market definition
Objectives
Notes and caveats

16.2 Inclusions and exclusions checklist

Inclusions checklist
Exclusions checklist

16.3 Currency conversion rates for US$

16.4 Research methodology

16.5 Data procurement

Information sources

16.6 Data validation

16.7 Validation techniques employed for market sizing

16.8 Data synthesis

16.9 360 degree market analysis

16.10 List of abbreviations

Research Methodology

Technavio presents a detailed picture of the market by way of study, synthesis, and summation of data from multiple sources. The analysts have presented the various facets of the market with a particular focus on identifying the key industry influencers. The data thus presented is comprehensive, reliable, and the result of extensive research, both primary and secondary.

INFORMATION SOURCES

Primary sources

  • Manufacturers and suppliers
  • Channel partners
  • Industry experts
  • Strategic decision makers

Secondary sources

  • Industry journals and periodicals
  • Government data
  • Financial reports of key industry players
  • Historical data
  • Press releases

DATA ANALYSIS

Data Synthesis

  • Collation of data
  • Estimation of key figures
  • Analysis of derived insights

Data Validation

  • Triangulation with data models
  • Reference against proprietary databases
  • Corroboration with industry experts

REPORT WRITING

Qualitative

  • Market drivers
  • Market challenges
  • Market trends
  • Five forces analysis

Quantitative

  • Market size and forecast
  • Market segmentation
  • Geographical insights
  • Competitive landscape

Interested in this report?

Get your sample now to see our research methodology and insights!

Download Now

Frequently Asked Questions

Wind Turbine Components market growth will increase by USD 49109.2 million during 2026-2030.

The Wind Turbine Components market is expected to grow at a CAGR of 7% during 2026-2030.

Wind Turbine Components market is segmented by Application (Onshore, Offshore) Product (Wind turbine rotor blades, Wind turbine gearboxes, Wind turbine generators, Wind turbine towers, Others) End-user (Utility, Commercial and industrial, Residential)

CS WIND Corp., Dongfang Electric Corp. Ltd., EnBW Energie Baden Wurttemberg, ENERCON GmbH, Envision Group, Flender GmbH, GE Vernova Inc., Goldwind Science and Technology, Gurit Holding AG, ISHIBASHI Manufacturing Co, LM Wind Power, Max Bogl Wind AG, Nanjing High Speed Gear, Siemens Gamesa Renewable Energy, Silbitz Group GmbH, TPI Composites Inc., Vestas Wind Systems AS, Wheels India Ltd., XEMC Darwind BV, ZF Friedrichshafen AG are a few of the key vendors in the Wind Turbine Components market.

APAC will register the highest growth rate of 49.8% among the other regions. Therefore, the Wind Turbine Components market in APAC is expected to garner significant business opportunities for the vendors during the forecast period.

China, India, Japan, South Korea, Vietnam, Indonesia, Germany, UK, France, Spain, Italy, The Netherlands, US, Canada, Mexico, Brazil, Argentina, Colombia, South Africa, Saudi Arabia, UAE, Egypt, Morocco

  • Rapid growth of global wind power industry is the driving factor this market.

The Wind Turbine Components market vendors should focus on grabbing business opportunities from the Application segment as it accounted for the largest market share in the base year.