
Wind Turbine Decommissioning Services Market Size 2025-2029
The wind turbine decommissioning services market size is forecast to increase by USD 2.23 billion at a CAGR of 15.4% between 2024 and 2029.
- The market is experiencing significant growth, driven by the increasing number of aging wind turbines reaching the end of their operational life and the significant reductions in Levelized Cost of Energy (LCOE) due to reduced capital costs. Another key trend is the rise in offshore wind installations, which present unique challenges in terms of logistics and complex decommissioning processes. These trends are accompanied by an increase in the amount of waste generated during decommissioning, necessitating the development of sustainable and cost-effective solutions.
- Companies seeking to capitalize on this market opportunity must navigate these challenges effectively, including the need for specialized expertise, regulatory compliance, and the development of innovative technologies. Strategic partnerships and collaborations between industry players and stakeholders will also be crucial to addressing the complexities of wind turbine decommissioning and ensuring a sustainable and efficient transition to the next generation of renewable energy technologies.
What will be the Size of the Wind Turbine Decommissioning Services Market during the forecast period?

- The market is gaining momentum as the global shift towards renewable energy sources continues. With the increasing number of wind power generation projects reaching the end of their operational life, the demand for specialized decommissioning services is on the rise. The decommissioning process involves the safe and efficient dismantling of wind turbines and the disposal or recycling of valuable materials, such as rare-earth elements and metals. Power purchase agreements (PPAs) play a significant role in the business case for wind turbine decommissioning. As wind farms reach the end of their useful life, the cost of continuing operation may exceed the revenue generated from energy production.
- In such cases, decommissioning and site restoration become a necessary investment. Environmental considerations are also driving the market. Wind turbines must be dismantled and disposed of in an environmentally sustainable manner, adhering to regulatory requirements and minimizing the impact on ecosystems. Advanced recycling technologies are being developed to minimize waste and promote a circular economy. The decommissioning process for offshore wind turbines presents unique challenges due to the marine environment and the need for specialized equipment and environmental consultants. Governments and investors are recognizing the importance of proper wind turbine decommissioning to mitigate climate change and ensure responsible land use agreements.
- Investments in geothermal and other renewable energy sources may also influence the wind industry's direction, impacting the market for wind turbine decommissioning services. Regardless, the market is expected to continue growing as aging wind farms are decommissioned and replaced with newer, more efficient technologies.
How is this Wind Turbine Decommissioning Services Industry segmented?
The wind turbine decommissioning services industry research report provides comprehensive data (region-wise segment analysis), with forecasts and estimates in "USD million" for the period 2025-2029, as well as historical data from 2019-2023 for the following segments.
- Type
- Large
- Medium
- Small
- Application
- Onshore
- Offshore
- Geography
- Europe
- Denmark
- Germany
- UK
- North America
- US
- Canada
- APAC
- China
- India
- Japan
- Middle East and Africa
- South America
- Brazil
- Europe
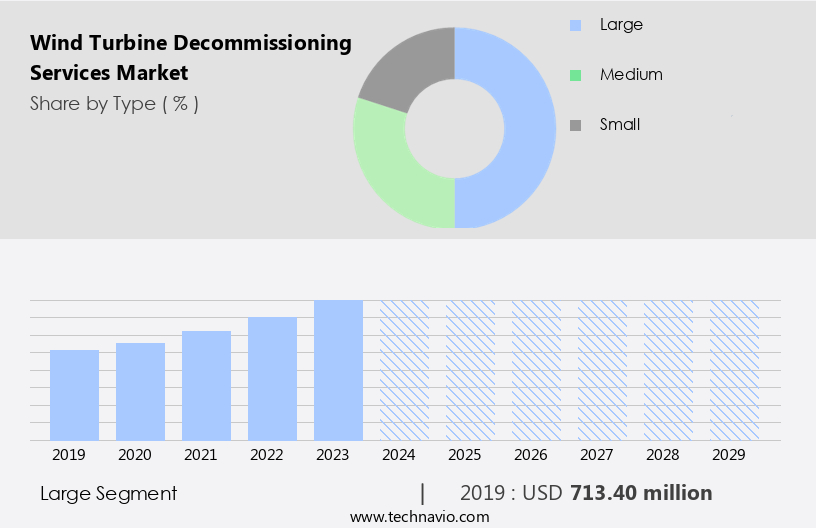
By Type Insights
The large segment is estimated to witness significant growth during the forecast period.
The market is witnessing growth due to the increasing replacement of older, less efficient wind turbines with larger, more efficient units. These larger turbines, ranging from 2 to 6 megawatts, offer greater energy output and cost-effectiveness. As a result, wind energy companies are decommissioning and removing smaller turbines to make way for larger installations. For instance, offshore wind farms in the North Sea are undergoing decommissioning and replacement with more powerful turbines to enhance energy generation. The international expansion of the wind industry is expected to drive the demand for decommissioning services for larger turbines, presenting opportunities for market growth during the forecast period.
Additionally, the decommissioning process involves various services such as fiberglass recycling, tower decommissioning, rare-earth magnet recycling, and disposal services to ensure sustainable wind energy practices and adherence to regulations. The decommissioning industry focuses on efficiency, cost-effectiveness, and safety, employing advanced technologies and logistics to minimize waste and maximize resource recovery.
Get a glance at the market report of share of various segments Request Free Sample
The Large segment was valued at USD 713.40 billion in 2019 and showed a gradual increase during the forecast period.
Regional Analysis
Europe is estimated to contribute 35% to the growth of the global market during the forecast period.Technavio’s analysts have elaborately explained the regional trends and drivers that shape the market during the forecast period.

For more insights on the market size of various regions, Request Free Sample
Wind turbine decommissioning services refer to the process of retiring and dismantling wind turbines at the end of their useful life. This is an essential aspect of the renewable energy sector as older turbines can add to operational and maintenance costs, increase the risk of breakdown, and have lower efficiency due to unavailable components. Europe, specifically Germany, Spain, and the UK, have been major contributors to wind turbine decommissioning due to their significant wind power capacity installations. Germany, a leader in Europe's transition to low-carbon electricity generation, is increasing its onshore and offshore wind turbine installations to reduce reliance on fossil fuels.
Wind farm decommissioning involves various services, including dismantling, recycling, and disposal. Fiberglass recycling, tower decommissioning, and rare-earth magnet recycling are crucial components of sustainable wind energy and the wind energy lifecycle. Decommissioning software, turbine dismantling, and removal services ensure cost-effectiveness, efficiency, and safety. Wind farm repowering is another option to extend the life of wind turbines, making decommissioning a critical aspect of the wind energy industry's sustainability and growth.
Market Dynamics
Our researchers analyzed the data with 2024 as the base year, along with the key drivers, trends, and challenges. A holistic analysis of drivers will help companies refine their marketing strategies to gain a competitive advantage.
What are the key market drivers leading to the rise in the adoption of Wind Turbine Decommissioning Services Industry?
- Significant reductions in LCOE due to reduced capital costs is the key driver of the market.
- The cost of decommissioning wind turbines is influenced by several factors, including vessel day rates, duration of activities, choice of decommissioning vessel, and assumptions on overhead costs and wait on the weather. The levelized cost of energy (LCOE) for wind power has seen a notable decrease due to advancements in wind power systems, which has led to increased efficiency and reduced capital costs.
- With onshore wind power gaining ground against conventional power technologies, there is growing interest in technological innovations within the offshore wind segment to secure profitability. Despite these advancements, the decommissioning cost remains a significant consideration, accounting for a smaller proportion of the overall expenses.
What are the market trends shaping the Wind Turbine Decommissioning Services Industry?
- Rise in offshore installations is the upcoming market trend.
- The global offshore the market is experiencing significant growth due to regulatory emphasis on renewable energy and the potential for higher energy yields from offshore wind farms. Europe, in particular, is leading this trend as it benefits from superior wind resources, reduced turbulence, and consistent wind flow in offshore locations. Notable market participants are driving innovation through advanced installation techniques, foundation designs, logistical solutions, and digitalization, enabling the construction of large-scale projects such as Borssele 1 and 2 in the Netherlands and Walney Extension in the UK.
- These developments contribute to the increasing efficiency and lower levelized cost of energy (LCOE) in the offshore wind sector.
What challenges does the Wind Turbine Decommissioning Services Industry face during its growth?
- Increase in amount of waste generated is a key challenge affecting the industry growth.
- Wind turbines, composed of various components including rotors, blades, generators, gearboxes, main shafts, nacelles, and towers, pose unique challenges during decommissioning due to the difficulty in managing dismantled blades. Modern wind turbine blades, such as LM Wind Power's LM 88.4 P, which measures 88.4 meters in length and is designed for Adwen's AD 8-180 wind turbine model with a nominal capacity of 8 MW and a rotor diameter of 180 meters, present a significant challenge. These extended blades facilitate a larger sweep, generating more power per tower. However, their disposal requires innovative solutions due to their size and complex composition.
- The market is influenced by factors such as increasing demand for renewable energy, government regulations, and technological advancements in blade recycling processes. Despite the challenges, the market is expected to grow, driven by the need to address the increasing number of aging wind turbines reaching the end of their operational life.
Exclusive Customer Landscape
The wind turbine decommissioning services market forecasting report includes the adoption lifecycle of the market, covering from the innovator’s stage to the laggard’s stage. It focuses on adoption rates in different regions based on penetration. Furthermore, the wind turbine decommissioning services market report also includes key purchase criteria and drivers of price sensitivity to help companies evaluate and develop their market growth analysis strategies.

Customer Landscape
Key Companies & Market Insights
Companies are implementing various strategies, such as strategic alliances, wind turbine decommissioning services market forecast, partnerships, mergers and acquisitions, geographical expansion, and product/service launches, to enhance their presence in the industry.
A1Wind - The company specializes in wind turbine decommissioning, providing comprehensive packages for dismantling and removing all components. Logistics and transportation are expertly managed throughout the process.
The industry research and growth report includes detailed analyses of the competitive landscape of the market and information about key companies, including:
- A1Wind
- Aggreko Plc
- Belson Steel and Scrap
- Cadeler
- Deltares
- DEME NV
- EOS Engineering and Service Co. Ltd.
- General Electric Co.
- Intertek Group Plc
- Jack up Barge B.V.
- NIRAS AS
- Oceaneering International Inc.
- Principle Power Inc.
- Ramboll Group AS
- ReBlade
- Secure Energy Services
- SgurrEnergy
- Wilh. Wilhelmsen Holding ASA
- Wind Decom
- Xinjiang Goldwind Science and Technology Co. Ltd.
Qualitative and quantitative analysis of companies has been conducted to help clients understand the wider business environment as well as the strengths and weaknesses of key industry players. Data is qualitatively analyzed to categorize companies as pure play, category-focused, industry-focused, and diversified; it is quantitatively analyzed to categorize companies as dominant, leading, strong, tentative, and weak.
Research Analyst Overview
The renewable energy sector, specifically wind energy, has seen significant growth over the past few decades. As technology advances and energy demands evolve, the decommissioning of wind farms becomes an essential aspect of the industry's lifecycle. This process involves the dismantling, recycling, and disposal of wind turbines and related infrastructure. Wind farm decommissioning is an intricate procedure that requires careful planning and execution. It encompasses various stages, including dismantling turbines, removing towers, recycling components, and managing waste. The decommissioning industry has gained importance due to the increasing number of wind farms reaching the end of their operational life.
The decommissioning process begins with the assessment of the wind farm's condition and the identification of viable recycling opportunities. Fiberglass recycling is a common approach for recycling wind turbine blades. Rare-earth magnet recycling is another crucial aspect, as these magnets contain valuable materials that can be reused in various industries. Sustainable decommissioning practices are essential to minimize environmental impact. Decommissioning software and technology have been developed to optimize the process, ensuring cost-effectiveness, efficiency, and safety. Decommissioning logistics play a significant role in the overall process, ensuring the smooth transfer of components from the wind farm to the recycling facilities.
Decommissioning regulations vary from region to region. Compliance with these regulations is crucial to ensure a safe and environmentally friendly decommissioning process. Safety is a top priority during decommissioning, with strict adherence to safety protocols to minimize risks to workers and the public. Wind farm repowering is another option for extending the life of wind farms. This involves upgrading the turbines with newer, more efficient models. In some cases, repowering may be a more cost-effective solution than decommissioning and rebuilding a new wind farm. Onshore wind farms are the primary focus of decommissioning efforts. However, offshore wind farms are also beginning to reach the end of their operational life, and decommissioning these structures presents unique challenges.
The decommissioning of offshore wind farms requires specialized equipment and expertise. In , wind farm decommissioning is a complex process that involves various stages, from dismantling and recycling to waste management and regulatory compliance. Sustainable practices and advanced technology are essential to minimize environmental impact and ensure cost-effective and efficient decommissioning. As the renewable energy sector continues to grow, the decommissioning industry will play a crucial role in managing the end-of-life disposal of wind turbines and related infrastructure.
|
Market Scope |
|
|
Report Coverage |
Details |
|
Page number |
195 |
|
Base year |
2024 |
|
Historic period |
2019-2023 |
|
Forecast period |
2025-2029 |
|
Growth momentum & CAGR |
Accelerate at a CAGR of 15.4% |
|
Market growth 2025-2029 |
USD 2232 million |
|
Market structure |
Fragmented |
|
YoY growth 2024-2025(%) |
14.3 |
|
Key countries |
Germany, US, India, Canada, China, UK, Saudi Arabia, Japan, Denmark, and Brazil |
|
Competitive landscape |
Leading Companies, Market Positioning of Companies, Competitive Strategies, and Industry Risks |
What are the Key Data Covered in this Wind Turbine Decommissioning Services Market Research and Growth Report?
- CAGR of the Wind Turbine Decommissioning Services industry during the forecast period
- Detailed information on factors that will drive the growth and forecasting between 2025 and 2029
- Precise estimation of the size of the market and its contribution of the industry in focus to the parent market
- Accurate predictions about upcoming growth and trends and changes in consumer behaviour
- Growth of the market across Europe, North America, APAC, Middle East and Africa, and South America
- Thorough analysis of the market’s competitive landscape and detailed information about companies
- Comprehensive analysis of factors that will challenge the wind turbine decommissioning services market growth of industry companies
We can help! Our analysts can customize this wind turbine decommissioning services market research report to meet your requirements.
 RIA -
RIA - 
