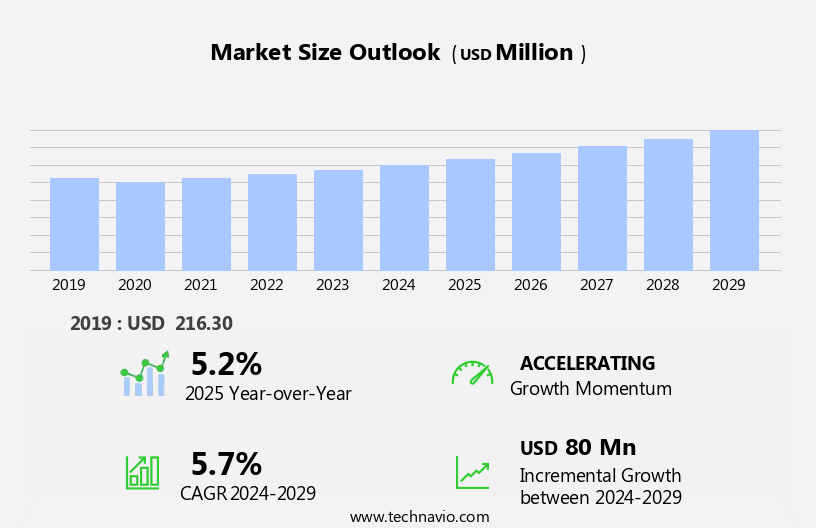
Women Activewear Market Size 2025-2029
The women activewear market size is forecast to increase by USD 80 million at a CAGR of 5.7% between 2024 and 2029.
- The market is experiencing significant growth, driven by increasing initiatives towards women's fitness by both government bodies and corporations. This trend is further fueled by the rising demand for customized activewear, catering to the unique needs and preferences of women. However, the market faces challenges, including the unpredictability of raw material prices, which can significantly impact the profitability of activewear manufacturers. As such, companies must adopt strategic sourcing and pricing strategies to mitigate these price fluctuations and maintain competitiveness. Additionally, staying abreast of the latest fashion trends and consumer preferences is crucial to remain competitive in this dynamic market.
- To capitalize on opportunities and navigate challenges effectively, companies should focus on innovation, sustainability, and customer engagement. By offering customized, high-quality activewear at competitive prices, while ensuring ethical sourcing and timely delivery, businesses can differentiate themselves and build a loyal customer base.
What will be the Size of the Women Activewear Market during the forecast period?

Request Free Sample
- The women's activewear market continues to evolve, driven by consumer preferences for versatile and functional apparel. Stretchable fabrics, size inclusivity, and athletic footwear remain key trends. Reflective details and yoga pants cater to the active lifestyle, while cross-training shoes and compression wear offer built-in support. Sustainable activewear, including recycled fabrics and eco-friendly materials, is gaining traction. Functional pockets, adjustable straps, and seamless construction enhance the user experience.
- Performance shoes, gym wear, and lifestyle wear incorporate wicking technology and UV protection. Casual activewear, sports bras, and maternity activewear cater to diverse consumer needs. Petite activewear and plus-size activewear ensure inclusivity. The market's dynamism extends to the integration of compression technology and sustainable practices, shaping the future of the industry.
How is this Women Activewear Industry segmented?
The women activewear industry research report provides comprehensive data (region-wise segment analysis), with forecasts and estimates in "USD million" for the period 2025-2029, as well as historical data from 2019-2023 for the following segments.
- Distribution Channel
- Online
- Supermarkets and hypermarkets
- Specialty stores
- Others
- Product Type
- Tops and T-shirts
- Bottom wear
- Innerwear and swimwear
- Outerwear
- Others
- Price Range
- Type
- Polyester
- Spandex
- Cotton
- Polypropylene
- Others
- Geography
- North America
- Europe
- Middle East and Africa
- APAC
- Australia
- China
- India
- Japan
- South Korea
- South America
- Rest of World (ROW)
By Distribution Channel Insights
The online segment is estimated to witness significant growth during the forecast period.
The market is experiencing significant growth due to the increasing popularity of performance wear, fitness apparel, and athletic footwear. Body positivity and size inclusivity are driving trends in the industry, leading to an expanded range of options in workout clothes, including adjustable straps, functional pockets, and seamless construction. Yoga pants, running shorts, and gym wear continue to be staples, with new innovations in performance fabrics, compression technology, and breathable materials. Sustainability is a key concern, with an increasing demand for eco-friendly materials, recycled fabrics, and sustainable activewear. The market is also witnessing the rise of casual activewear, sports bras, and cross-training shoes.
Reflective details and UV protection are also important features for many consumers. Online sales are surging, with Amazon.Com and eBay Inc. Among the major players in the e-commerce space. The market's evolution reflects the growing active lifestyle of women, with a focus on comfort, functionality, and self-expression.

Request Free Sample
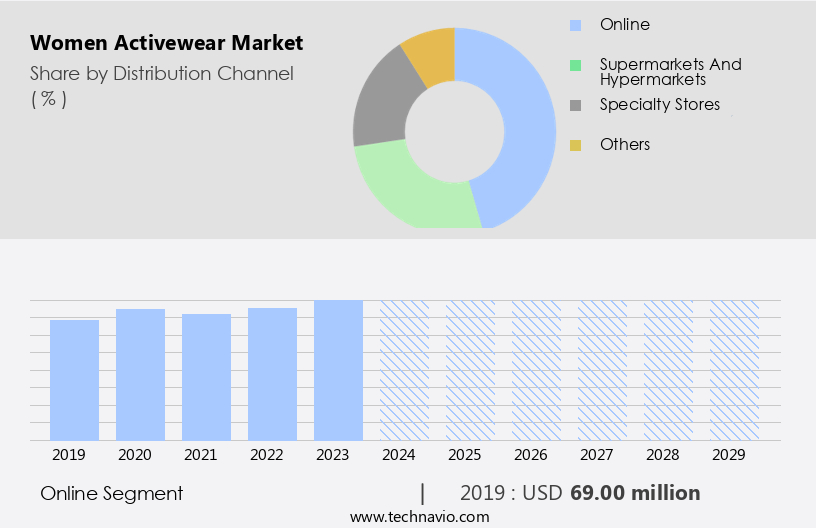
The Online segment was valued at USD 69.00 million in 2019 and showed a gradual increase during the forecast period.
Regional Analysis
North America is estimated to contribute 34% to the growth of the global market during the forecast period.Technavio’s analysts have elaborately explained the regional trends and drivers that shape the market during the forecast period.

Request Free Sample
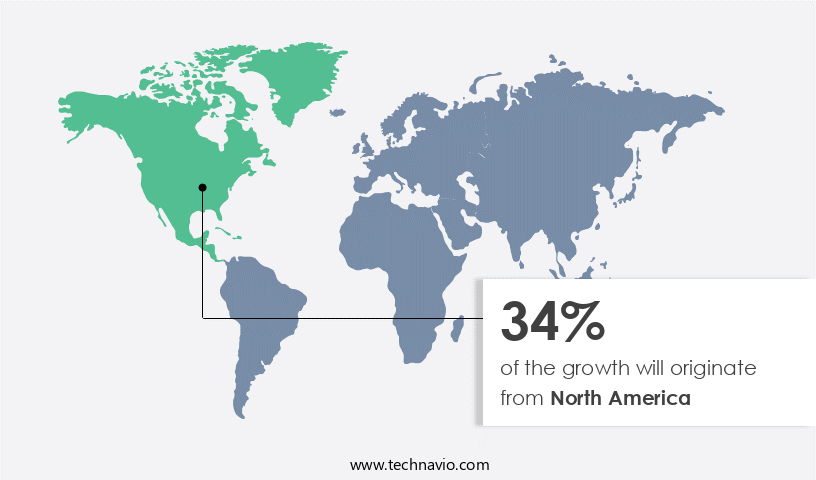
The global market for women activewear is experiencing notable growth, with North America holding a substantial share in 2024. This region's expansion is attributed to the increasing preference for a fit and healthy lifestyle among consumers, particularly among millennials. The well-established fitness industry and high prevalence of health issues like obesity and diabetes further fuel the adoption of activewear. During the forecast period, the rise in participation in fitness activities such as yoga, Zumba, and meditation is expected to significantly contribute to the market's expansion. Key product offerings within the women activewear segment include performance wear, fitness apparel, running shoes, and gym wear.
Performance fabrics, compression technology, stretchable fabrics, and seamless construction are essential features driving demand. Additionally, trends toward body positivity, size inclusivity, and eco-friendly materials are shaping the market. Product categories include workout clothes with adjustable straps, functional pockets, yoga pants, sports bras, yoga shoes, running shorts, performance shoes, casual activewear, compression wear, and maternity activewear. Reflective details and built-in support are essential considerations for consumers. Cross-training shoes, sustainable activewear, and petite activewear are emerging categories. Overall, the market is poised for continued growth, driven by evolving consumer preferences and lifestyle trends.
Market Dynamics
Our researchers analyzed the data with 2024 as the base year, along with the key drivers, trends, and challenges. A holistic analysis of drivers will help companies refine their marketing strategies to gain a competitive advantage.
What are the key market drivers leading to the rise in the adoption of Women Activewear Industry?
- The increasing prioritization of fitness initiatives by both government entities and corporations serves as the primary catalyst for market growth.
- The market is experiencing significant growth due to the increasing emphasis on health and wellness initiatives by both government agencies and corporations. With on-site fitness centers and wellness programs becoming more common, employees are able to maintain a healthy work-life balance, leading to increased productivity and lower costs for companies. These programs often include the provision of stretchable activewear, such as yoga pants and athletic footwear, which allow for ease of movement during workouts. Moreover, the demand for size inclusivity and sustainable activewear, including compression wear and cross-training shoes, is on the rise.
- Reflective details are also increasingly popular for safety during outdoor workouts. Overall, the active lifestyle trend continues to gain momentum, driving the market for women's activewear forward.
What are the market trends shaping the Women Activewear Industry?
- The customization of women's activewear is gaining popularity as the latest market trend. This trend reflects the increasing demand for personalized athletic attire that caters to individual preferences and needs.
- The market in developed regions, particularly in North and South America and Europe, is witnessing significant growth due to the rising trend of sports and wellness activities. Emerging economies like China and India are also experiencing a demand surge for customized premium women activewear apparel. Personalization in women activewear goes beyond color and design; it can include embroidery, logos, and even the addition of names. Leading brands such as Nike, Under Armor, and Adidas offer customized women activewear, including pants, shorts, and jackets, allowing customers to personalize their apparel based on their preferences. Additionally, eco-friendly materials, UV protection, wicking technology, breathable fabrics, and seamless technology are essential features that are increasingly becoming popular in women activewear.
- These features cater to the needs of various demographics, including plus-size and maternity activewear consumers. The market is expected to continue its growth trajectory, driven by these trends and the increasing awareness of health and fitness among consumers.
What challenges does the Women Activewear Industry face during its growth?
- The unpredictability of raw material prices poses a significant challenge to the growth of the women's activewear industry.
- The market has experienced varying profit margins for major manufacturers such as Adidas, Nike, PUMA, and Lululemon Athletica due to the volatile prices of key raw materials. Synthetic fibers like Spandex, which are commonly used in activewear production, undergo frequent price fluctuations. Furthermore, the scarcity of high-quality polyester fibers has led to a significant increase in their prices. As a result, the cost of producing women activewear using these raw materials has risen, posing a significant challenge to market expansion.
- The volatility of raw material prices has become a major concern for market competitors, making it essential for them to adapt to these market dynamics to remain competitive.
Exclusive Customer Landscape
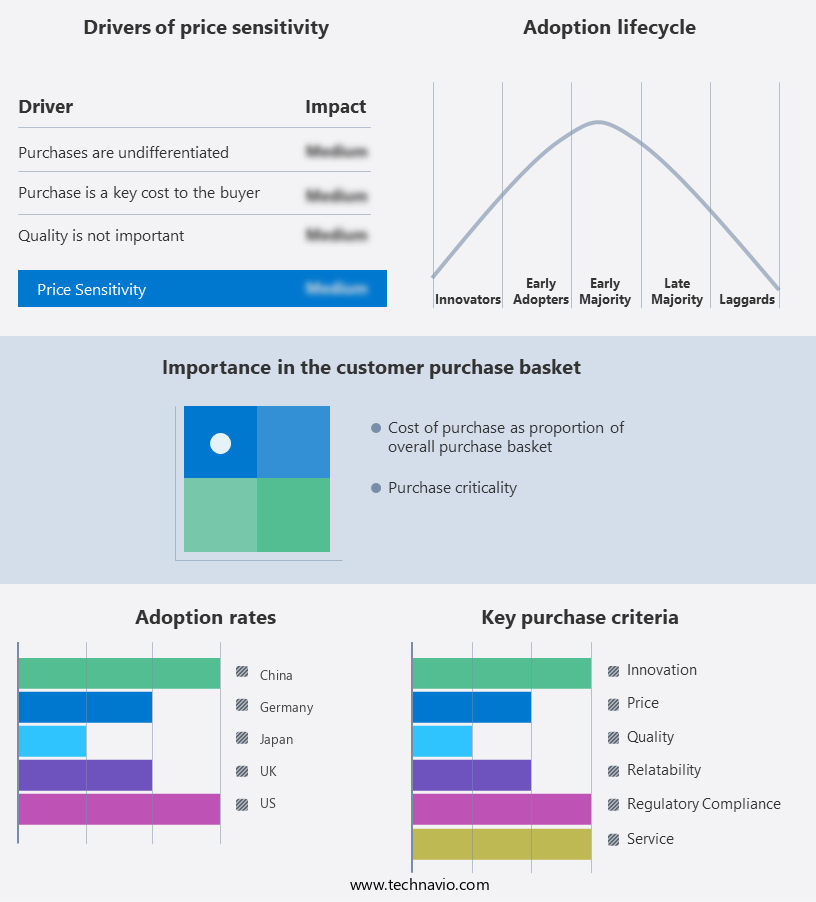
The women activewear market forecasting report includes the adoption lifecycle of the market, covering from the innovator’s stage to the laggard’s stage. It focuses on adoption rates in different regions based on penetration. Furthermore, the women activewear market report also includes key purchase criteria and drivers of price sensitivity to help companies evaluate and develop their market growth analysis strategies.

Customer Landscape
Key Companies & Market Insights
Companies are implementing various strategies, such as strategic alliances, women activewear market forecast, partnerships, mergers and acquisitions, geographical expansion, and product/service launches, to enhance their presence in the industry.
Adidas AG - This company specializes in producing high-performance basketball apparel for women. Our sleeveless tees are meticulously designed to optimize comfort and mobility during gameplay. Constructed with moisture-wicking fabric and a form-fitting silhouette, these tees enhance athletic performance and allow for unhindered movement on the court. By prioritizing innovative design and functionality, we aim to empower women basketball players with confidence and comfort.
The industry research and growth report includes detailed analyses of the competitive landscape of the market and information about key companies, including:
- Adidas AG
- Anita DR. Helbig GmbH
- ASICS Corp.
- Athleta (The Gap Inc.)
- Burberry Group PLC
- Columbia Sportswear Co.
- Fila Holdings Corp.
- Global Intimates LLC
- Hanesbrands Inc.
- Jockey International Inc.
- Loro Piana S.p.A.
- Lululemon Athletica Inc.
- Mizuno Corp.
- Nike Inc.
- Nordstrom Inc.
- PUMA SE
- Ralph Lauren Corp.
- Spanx LLC
- Under Armour Inc.
- Vie Performance LLC
Qualitative and quantitative analysis of companies has been conducted to help clients understand the wider business environment as well as the strengths and weaknesses of key industry players. Data is qualitatively analyzed to categorize companies as pure play, category-focused, industry-focused, and diversified; it is quantitatively analyzed to categorize companies as dominant, leading, strong, tentative, and weak.
Recent Development and News in Women Activewear Market
- In March 2024, Lululemon Athletica, a leading player in the women's activewear market, introduced its new "We Made Too Much" program. This initiative aims to reduce excess inventory by offering discounted products and donating unsold items to charities, aligning with the growing consumer trend towards sustainable fashion (Lululemon Press Release, 2024).
- In July 2025, Adidas and Gucci announced a strategic partnership to co-brand activewear collections, merging luxury and athletic wear trends. This collaboration marked a significant shift in the women's activewear market, appealing to consumers seeking high-performance clothing with a touch of luxury (Adidas & Gucci Press Release, 2025).
- In September 2024, Nike secured a strategic investment of USD150 million from Sequoia Capital China, enabling the expansion of its digital presence and manufacturing capabilities in the Chinese market (Nike Press Release, 2024).
- In November 2025, the European Union passed the Sustainable Products Initiative regulation, mandating companies to provide information on the environmental impact of their products, including activewear, from raw material extraction to end-of-life disposal. This regulatory development is expected to drive innovation and transparency in the women's activewear market (European Commission Press Release, 2025).
Research Analyst Overview
The women's activewear market is characterized by a dynamic business landscape, shaped by evolving consumer preferences and innovative brand positioning. Email marketing and social media platforms are key channels for reaching the target audience, with consumer insights driving content creation. Supply chain management and ethical sourcing are crucial aspects of corporate social responsibility, while manufacturing processes prioritize material science for product differentiation and performance. Retail channels, including e-commerce platforms and brick-and-mortar stores, offer various pricing strategies to cater to diverse customer segments.
Sustainability initiatives and quality control are essential for brand loyalty, with data analytics enabling effective distribution channels and product innovation. Performance metrics, such as PPC and content marketing, play a significant role in digital marketing strategies, while influencer marketing adds a personal touch to brand messaging. Brand positioning and fashion trends intertwine, shaping consumer expectations and driving competition in the market.
Dive into Technavio’s robust research methodology, blending expert interviews, extensive data synthesis, and validated models for unparalleled Women Activewear Market insights. See full methodology.
|
Market Scope
|
|
Report Coverage
|
Details
|
|
Page number
|
259
|
|
Base year
|
2024
|
|
Historic period
|
2019-2023 |
|
Forecast period
|
2025-2029
|
|
Growth momentum & CAGR
|
Accelerate at a CAGR of 5.7%
|
|
Market growth 2025-2029
|
USD 80 million
|
|
Market structure
|
Fragmented
|
|
YoY growth 2024-2025(%)
|
5.2
|
|
Key countries
|
US, China, Germany, Japan, UK, Australia, India, France, Brazil, UAE, Rest of World (ROW), Saudi Arabia, France, South Korea, Mexico, and Italy
|
|
Competitive landscape
|
Leading Companies, Market Positioning of Companies, Competitive Strategies, and Industry Risks
|
Request Free Sample
What are the Key Data Covered in this Women Activewear Market Research and Growth Report?
- CAGR of the Women Activewear industry during the forecast period
- Detailed information on factors that will drive the growth and forecasting between 2025 and 2029
- Precise estimation of the size of the market and its contribution of the industry in focus to the parent market
- Accurate predictions about upcoming growth and trends and changes in consumer behaviour
- Growth of the market across North America, Europe, APAC, South America, and Middle East and Africa
- Thorough analysis of the market’s competitive landscape and detailed information about companies
- Comprehensive analysis of factors that will challenge the women activewear market growth of industry companies
We can help! Our analysts can customize this women activewear market research report to meet your requirements.
Get in touch
1 Executive Summary
- 1.1 Market overview
- Executive Summary - Chart on Market Overview
- Executive Summary - Data Table on Market Overview
- Executive Summary - Chart on Global Market Characteristics
- Executive Summary - Chart on Market by Geography
- Executive Summary - Chart on Market Segmentation by Distribution Channel
- Executive Summary - Chart on Market Segmentation by Product Type
- Executive Summary - Chart on Market Segmentation by Price Range
- Executive Summary - Chart on Market Segmentation by Type
- Executive Summary - Chart on Incremental Growth
- Executive Summary - Data Table on Incremental Growth
- Executive Summary - Chart on Company Market Positioning
2 Technavio Analysis
- 2.1 Analysis of price sensitivity, lifecycle, customer purchase basket, adoption rates, and purchase criteria
- Analysis of price sensitivity, lifecycle, customer purchase basket, adoption rates, and purchase criteria
- 2.2 Criticality of inputs and Factors of differentiation
- Overview on criticality of inputs and factors of differentiation
- 2.3 Factors of disruption
- Overview on factors of disruption
- 2.4 Impact of drivers and challenges
- Impact of drivers and challenges in 2024 and 2029
3 Market Landscape
- 3.1 Market ecosystem
- Parent Market
- Data Table on - Parent Market
- 3.2 Market characteristics
- Market characteristics analysis
4 Market Sizing
- 4.1 Market definition
- Offerings of companies included in the market definition
- 4.2 Market segment analysis
- 4.4 Market outlook: Forecast for 2024-2029
- Chart on Global - Market size and forecast 2024-2029 ($ million)
- Data Table on Global - Market size and forecast 2024-2029 ($ million)
- Chart on Global Market: Year-over-year growth 2024-2029 (%)
- Data Table on Global Market: Year-over-year growth 2024-2029 (%)
5 Historic Market Size
- 5.1 Global Women Activewear Market 2019 - 2023
- Historic Market Size - Data Table on Global Women Activewear Market 2019 - 2023 ($ million)
- 5.2 Distribution Channel segment analysis 2019 - 2023
- Historic Market Size - Distribution Channel Segment 2019 - 2023 ($ million)
- 5.3 Product Type segment analysis 2019 - 2023
- Historic Market Size - Product Type Segment 2019 - 2023 ($ million)
- 5.4 Price Range segment analysis 2019 - 2023
- Historic Market Size - Price Range Segment 2019 - 2023 ($ million)
- 5.5 Type segment analysis 2019 - 2023
- Historic Market Size - Type Segment 2019 - 2023 ($ million)
- 5.6 Geography segment analysis 2019 - 2023
- Historic Market Size - Geography Segment 2019 - 2023 ($ million)
- 5.7 Country segment analysis 2019 - 2023
- Historic Market Size - Country Segment 2019 - 2023 ($ million)
6 Qualitative Analysis
- 6.1 Impact of AI on Global Women Activewear Market
7 Five Forces Analysis
- 7.1 Five forces summary
- Five forces analysis - Comparison between 2024 and 2029
- 7.2 Bargaining power of buyers
- Bargaining power of buyers - Impact of key factors 2024 and 2029
- 7.3 Bargaining power of suppliers
- Bargaining power of suppliers - Impact of key factors in 2024 and 2029
- 7.4 Threat of new entrants
- Threat of new entrants - Impact of key factors in 2024 and 2029
- 7.5 Threat of substitutes
- Threat of substitutes - Impact of key factors in 2024 and 2029
- 7.6 Threat of rivalry
- Threat of rivalry - Impact of key factors in 2024 and 2029
- 7.7 Market condition
- Chart on Market condition - Five forces 2024 and 2029
8 Market Segmentation by Distribution Channel
- 8.1 Market segments
- Chart on Distribution Channel - Market share (2024-2029) (%)
- Data Table on Distribution Channel - Market share (2024-2029) (%)
- 8.2 Comparison by Distribution Channel
- Chart on Comparison by Distribution Channel
- Data Table on Comparison by Distribution Channel
- 8.3 Online - Market size and forecast (2024-2029)
- Chart on Online - Market size and forecast (2024-2029) ($ million)
- Data Table on Online - Market size and forecast (2024-2029) ($ million)
- Chart on Online - Year-over-year growth (2024-2029) (%)
- Data Table on Online - Year-over-year growth (2024-2029) (%)
- 8.4 Supermarkets and hypermarkets - Market size and forecast (2024-2029)
- Chart on Supermarkets and hypermarkets - Market size and forecast (2024-2029) ($ million)
- Data Table on Supermarkets and hypermarkets - Market size and forecast (2024-2029) ($ million)
- Chart on Supermarkets and hypermarkets - Year-over-year growth (2024-2029) (%)
- Data Table on Supermarkets and hypermarkets - Year-over-year growth (2024-2029) (%)
- 8.5 Specialty stores - Market size and forecast (2024-2029)
- Chart on Specialty stores - Market size and forecast (2024-2029) ($ million)
- Data Table on Specialty stores - Market size and forecast (2024-2029) ($ million)
- Chart on Specialty stores - Year-over-year growth (2024-2029) (%)
- Data Table on Specialty stores - Year-over-year growth (2024-2029) (%)
- 8.6 Others - Market size and forecast (2024-2029)
- Chart on Others - Market size and forecast (2024-2029) ($ million)
- Data Table on Others - Market size and forecast (2024-2029) ($ million)
- Chart on Others - Year-over-year growth (2024-2029) (%)
- Data Table on Others - Year-over-year growth (2024-2029) (%)
- 8.7 Market opportunity by Distribution Channel
- Market opportunity by Distribution Channel ($ million)
- Data Table on Market opportunity by Distribution Channel ($ million)
9 Market Segmentation by Product Type
- 9.1 Market segments
- Chart on Product Type - Market share (2024-2029) (%)
- Data Table on Product Type - Market share (2024-2029) (%)
- 9.2 Comparison by Product Type
- Chart on Comparison by Product Type
- Data Table on Comparison by Product Type
- 9.3 Tops and T-shirts - Market size and forecast (2024-2029)
- Chart on Tops and T-shirts - Market size and forecast (2024-2029) ($ million)
- Data Table on Tops and T-shirts - Market size and forecast (2024-2029) ($ million)
- Chart on Tops and T-shirts - Year-over-year growth (2024-2029) (%)
- Data Table on Tops and T-shirts - Year-over-year growth (2024-2029) (%)
- 9.4 Bottom wear - Market size and forecast (2024-2029)
- Chart on Bottom wear - Market size and forecast (2024-2029) ($ million)
- Data Table on Bottom wear - Market size and forecast (2024-2029) ($ million)
- Chart on Bottom wear - Year-over-year growth (2024-2029) (%)
- Data Table on Bottom wear - Year-over-year growth (2024-2029) (%)
- 9.5 Innerwear and swimwear - Market size and forecast (2024-2029)
- Chart on Innerwear and swimwear - Market size and forecast (2024-2029) ($ million)
- Data Table on Innerwear and swimwear - Market size and forecast (2024-2029) ($ million)
- Chart on Innerwear and swimwear - Year-over-year growth (2024-2029) (%)
- Data Table on Innerwear and swimwear - Year-over-year growth (2024-2029) (%)
- 9.6 Outerwear - Market size and forecast (2024-2029)
- Chart on Outerwear - Market size and forecast (2024-2029) ($ million)
- Data Table on Outerwear - Market size and forecast (2024-2029) ($ million)
- Chart on Outerwear - Year-over-year growth (2024-2029) (%)
- Data Table on Outerwear - Year-over-year growth (2024-2029) (%)
- 9.7 Others - Market size and forecast (2024-2029)
- Chart on Others - Market size and forecast (2024-2029) ($ million)
- Data Table on Others - Market size and forecast (2024-2029) ($ million)
- Chart on Others - Year-over-year growth (2024-2029) (%)
- Data Table on Others - Year-over-year growth (2024-2029) (%)
- 9.8 Market opportunity by Product Type
- Market opportunity by Product Type ($ million)
- Data Table on Market opportunity by Product Type ($ million)
10 Market Segmentation by Price Range
- 10.1 Market segments
- Chart on Price Range - Market share (2024-2029) (%)
- Data Table on Price Range - Market share (2024-2029) (%)
- 10.2 Comparison by Price Range
- Chart on Comparison by Price Range
- Data Table on Comparison by Price Range
- 10.3 Mass - Market size and forecast (2024-2029)
- Chart on Mass - Market size and forecast (2024-2029) ($ million)
- Data Table on Mass - Market size and forecast (2024-2029) ($ million)
- Chart on Mass - Year-over-year growth (2024-2029) (%)
- Data Table on Mass - Year-over-year growth (2024-2029) (%)
- 10.4 Mid - Market size and forecast (2024-2029)
- Chart on Mid - Market size and forecast (2024-2029) ($ million)
- Data Table on Mid - Market size and forecast (2024-2029) ($ million)
- Chart on Mid - Year-over-year growth (2024-2029) (%)
- Data Table on Mid - Year-over-year growth (2024-2029) (%)
- 10.5 Premium - Market size and forecast (2024-2029)
- Chart on Premium - Market size and forecast (2024-2029) ($ million)
- Data Table on Premium - Market size and forecast (2024-2029) ($ million)
- Chart on Premium - Year-over-year growth (2024-2029) (%)
- Data Table on Premium - Year-over-year growth (2024-2029) (%)
- 10.6 Market opportunity by Price Range
- Market opportunity by Price Range ($ million)
- Data Table on Market opportunity by Price Range ($ million)
11 Market Segmentation by Type
- 11.1 Market segments
- Chart on Type - Market share (2024-2029) (%)
- Data Table on Type - Market share (2024-2029) (%)
- 11.2 Comparison by Type
- Chart on Comparison by Type
- Data Table on Comparison by Type
- 11.3 Polyester - Market size and forecast (2024-2029)
- Chart on Polyester - Market size and forecast (2024-2029) ($ million)
- Data Table on Polyester - Market size and forecast (2024-2029) ($ million)
- Chart on Polyester - Year-over-year growth (2024-2029) (%)
- Data Table on Polyester - Year-over-year growth (2024-2029) (%)
- 11.4 Spandex - Market size and forecast (2024-2029)
- Chart on Spandex - Market size and forecast (2024-2029) ($ million)
- Data Table on Spandex - Market size and forecast (2024-2029) ($ million)
- Chart on Spandex - Year-over-year growth (2024-2029) (%)
- Data Table on Spandex - Year-over-year growth (2024-2029) (%)
- 11.5 Cotton - Market size and forecast (2024-2029)
- Chart on Cotton - Market size and forecast (2024-2029) ($ million)
- Data Table on Cotton - Market size and forecast (2024-2029) ($ million)
- Chart on Cotton - Year-over-year growth (2024-2029) (%)
- Data Table on Cotton - Year-over-year growth (2024-2029) (%)
- 11.6 Polypropylene - Market size and forecast (2024-2029)
- Chart on Polypropylene - Market size and forecast (2024-2029) ($ million)
- Data Table on Polypropylene - Market size and forecast (2024-2029) ($ million)
- Chart on Polypropylene - Year-over-year growth (2024-2029) (%)
- Data Table on Polypropylene - Year-over-year growth (2024-2029) (%)
- 11.7 Others - Market size and forecast (2024-2029)
- Chart on Others - Market size and forecast (2024-2029) ($ million)
- Data Table on Others - Market size and forecast (2024-2029) ($ million)
- Chart on Others - Year-over-year growth (2024-2029) (%)
- Data Table on Others - Year-over-year growth (2024-2029) (%)
- 11.8 Market opportunity by Type
- Market opportunity by Type ($ million)
- Data Table on Market opportunity by Type ($ million)
12 Customer Landscape
- 12.1 Customer landscape overview
- Analysis of price sensitivity, lifecycle, customer purchase basket, adoption rates, and purchase criteria
13 Geographic Landscape
- 13.1 Geographic segmentation
- Chart on Market share by geography 2024-2029 (%)
- Data Table on Market share by geography 2024-2029 (%)
- 13.2 Geographic comparison
- Chart on Geographic comparison
- Data Table on Geographic comparison
- 13.3 North America - Market size and forecast 2024-2029
- Chart on North America - Market size and forecast 2024-2029 ($ million)
- Data Table on North America - Market size and forecast 2024-2029 ($ million)
- Chart on North America - Year-over-year growth 2024-2029 (%)
- Data Table on North America - Year-over-year growth 2024-2029 (%)
- 13.4 Europe - Market size and forecast 2024-2029
- Chart on Europe - Market size and forecast 2024-2029 ($ million)
- Data Table on Europe - Market size and forecast 2024-2029 ($ million)
- Chart on Europe - Year-over-year growth 2024-2029 (%)
- Data Table on Europe - Year-over-year growth 2024-2029 (%)
- 13.5 APAC - Market size and forecast 2024-2029
- Chart on APAC - Market size and forecast 2024-2029 ($ million)
- Data Table on APAC - Market size and forecast 2024-2029 ($ million)
- Chart on APAC - Year-over-year growth 2024-2029 (%)
- Data Table on APAC - Year-over-year growth 2024-2029 (%)
- 13.6 South America - Market size and forecast 2024-2029
- Chart on South America - Market size and forecast 2024-2029 ($ million)
- Data Table on South America - Market size and forecast 2024-2029 ($ million)
- Chart on South America - Year-over-year growth 2024-2029 (%)
- Data Table on South America - Year-over-year growth 2024-2029 (%)
- 13.7 Middle East and Africa - Market size and forecast 2024-2029
- Chart on Middle East and Africa - Market size and forecast 2024-2029 ($ million)
- Data Table on Middle East and Africa - Market size and forecast 2024-2029 ($ million)
- Chart on Middle East and Africa - Year-over-year growth 2024-2029 (%)
- Data Table on Middle East and Africa - Year-over-year growth 2024-2029 (%)
- 13.8 US - Market size and forecast 2024-2029
- Chart on US - Market size and forecast 2024-2029 ($ million)
- Data Table on US - Market size and forecast 2024-2029 ($ million)
- Chart on US - Year-over-year growth 2024-2029 (%)
- Data Table on US - Year-over-year growth 2024-2029 (%)
- 13.9 Canada - Market size and forecast 2024-2029
- Chart on Canada - Market size and forecast 2024-2029 ($ million)
- Data Table on Canada - Market size and forecast 2024-2029 ($ million)
- Chart on Canada - Year-over-year growth 2024-2029 (%)
- Data Table on Canada - Year-over-year growth 2024-2029 (%)
- 13.10 China - Market size and forecast 2024-2029
- Chart on China - Market size and forecast 2024-2029 ($ million)
- Data Table on China - Market size and forecast 2024-2029 ($ million)
- Chart on China - Year-over-year growth 2024-2029 (%)
- Data Table on China - Year-over-year growth 2024-2029 (%)
- 13.11 UK - Market size and forecast 2024-2029
- Chart on UK - Market size and forecast 2024-2029 ($ million)
- Data Table on UK - Market size and forecast 2024-2029 ($ million)
- Chart on UK - Year-over-year growth 2024-2029 (%)
- Data Table on UK - Year-over-year growth 2024-2029 (%)
- 13.12 Japan - Market size and forecast 2024-2029
- Chart on Japan - Market size and forecast 2024-2029 ($ million)
- Data Table on Japan - Market size and forecast 2024-2029 ($ million)
- Chart on Japan - Year-over-year growth 2024-2029 (%)
- Data Table on Japan - Year-over-year growth 2024-2029 (%)
- 13.13 Germany - Market size and forecast 2024-2029
- Chart on Germany - Market size and forecast 2024-2029 ($ million)
- Data Table on Germany - Market size and forecast 2024-2029 ($ million)
- Chart on Germany - Year-over-year growth 2024-2029 (%)
- Data Table on Germany - Year-over-year growth 2024-2029 (%)
- 13.14 India - Market size and forecast 2024-2029
- Chart on India - Market size and forecast 2024-2029 ($ million)
- Data Table on India - Market size and forecast 2024-2029 ($ million)
- Chart on India - Year-over-year growth 2024-2029 (%)
- Data Table on India - Year-over-year growth 2024-2029 (%)
- 13.15 France - Market size and forecast 2024-2029
- Chart on France - Market size and forecast 2024-2029 ($ million)
- Data Table on France - Market size and forecast 2024-2029 ($ million)
- Chart on France - Year-over-year growth 2024-2029 (%)
- Data Table on France - Year-over-year growth 2024-2029 (%)
- 13.16 Italy - Market size and forecast 2024-2029
- Chart on Italy - Market size and forecast 2024-2029 ($ million)
- Data Table on Italy - Market size and forecast 2024-2029 ($ million)
- Chart on Italy - Year-over-year growth 2024-2029 (%)
- Data Table on Italy - Year-over-year growth 2024-2029 (%)
- 13.17 South Korea - Market size and forecast 2024-2029
- Chart on South Korea - Market size and forecast 2024-2029 ($ million)
- Data Table on South Korea - Market size and forecast 2024-2029 ($ million)
- Chart on South Korea - Year-over-year growth 2024-2029 (%)
- Data Table on South Korea - Year-over-year growth 2024-2029 (%)
- 13.18 Market opportunity by geography
- Market opportunity by geography ($ million)
- Data Tables on Market opportunity by geography ($ million)
- 13.19 Australia - Market size and forecast (2024-2029)
- Chart on Australia - Market size and forecast (2024-2029) ($ million)
- Data Table on Australia - Market size and forecast (2024-2029) ($ million)
- Chart on Australia - Year-over-year growth (2024-2029) (%)
- Data Table on Australia - Year-over-year growth (2024-2029) (%)
- 13.20 Brazil - Market size and forecast (2024-2029)
- Chart on Brazil - Market size and forecast (2024-2029) ($ million)
- Data Table on Brazil - Market size and forecast (2024-2029) ($ million)
- Chart on Brazil - Year-over-year growth (2024-2029) (%)
- Data Table on Brazil - Year-over-year growth (2024-2029) (%)
- 13.21 UAE - Market size and forecast (2024-2029)
- Chart on UAE - Market size and forecast (2024-2029) ($ million)
- Data Table on UAE - Market size and forecast (2024-2029) ($ million)
- Chart on UAE - Year-over-year growth (2024-2029) (%)
- Data Table on UAE - Year-over-year growth (2024-2029) (%)
- 13.22 Rest of World (ROW) - Market size and forecast (2024-2029)
- Chart on Rest of World (ROW) - Market size and forecast (2024-2029) ($ million)
- Data Table on Rest of World (ROW) - Market size and forecast (2024-2029) ($ million)
- Chart on Rest of World (ROW) - Year-over-year growth (2024-2029) (%)
- Data Table on Rest of World (ROW) - Year-over-year growth (2024-2029) (%)
- 13.23 Saudi Arabia - Market size and forecast (2024-2029)
- Chart on Saudi Arabia - Market size and forecast (2024-2029) ($ million)
- Data Table on Saudi Arabia - Market size and forecast (2024-2029) ($ million)
- Chart on Saudi Arabia - Year-over-year growth (2024-2029) (%)
- Data Table on Saudi Arabia - Year-over-year growth (2024-2029) (%)
- 13.24 Mexico - Market size and forecast (2024-2029)
- Chart on Mexico - Market size and forecast (2024-2029) ($ million)
- Data Table on Mexico - Market size and forecast (2024-2029) ($ million)
- Chart on Mexico - Year-over-year growth (2024-2029) (%)
- Data Table on Mexico - Year-over-year growth (2024-2029) (%)
14 Drivers, Challenges, and Opportunity/Restraints
- 14.3 Impact of drivers and challenges
- Impact of drivers and challenges in 2024 and 2029
- 14.4 Market opportunities/restraints
15 Competitive Landscape
- 15.2 Competitive Landscape
- Overview on criticality of inputs and factors of differentiation
- 15.3 Landscape disruption
- Overview on factors of disruption
- 15.4 Industry risks
- Impact of key risks on business
16 Competitive Analysis
- 16.2 Market positioning of companies
- Matrix on companies position and classification
- 16.3 Adidas AG
- Adidas AG - Overview
- Adidas AG - Product / Service
- Adidas AG - Key offerings
- 16.4 Anita DR. Helbig GmbH
- Anita DR. Helbig GmbH - Overview
- Anita DR. Helbig GmbH - Product / Service
- Anita DR. Helbig GmbH - Key offerings
- 16.5 ASICS Corp.
- ASICS Corp. - Overview
- ASICS Corp. - Product / Service
- ASICS Corp. - Key offerings
- 16.6 Athleta (The Gap Inc.)
- Athleta (The Gap Inc.) - Overview
- Athleta (The Gap Inc.) - Product / Service
- Athleta (The Gap Inc.) - Key offerings
- 16.7 Burberry Group PLC
- Burberry Group PLC - Overview
- Burberry Group PLC - Product / Service
- Burberry Group PLC - Key offerings
- 16.8 Columbia Sportswear Co.
- Columbia Sportswear Co. - Overview
- Columbia Sportswear Co. - Product / Service
- Columbia Sportswear Co. - Key offerings
- 16.9 Fila Holdings Corp.
- Fila Holdings Corp. - Overview
- Fila Holdings Corp. - Product / Service
- Fila Holdings Corp. - Key offerings
- 16.10 Global Intimates LLC
- Global Intimates LLC - Overview
- Global Intimates LLC - Product / Service
- Global Intimates LLC - Key offerings
- 16.11 Hanesbrands Inc.
- Hanesbrands Inc. - Overview
- Hanesbrands Inc. - Product / Service
- Hanesbrands Inc. - Key offerings
- 16.12 Jockey International Inc.
- Jockey International Inc. - Overview
- Jockey International Inc. - Product / Service
- Jockey International Inc. - Key offerings
- 16.13 Loro Piana S.p.A.
- Loro Piana S.p.A. - Overview
- Loro Piana S.p.A. - Product / Service
- Loro Piana S.p.A. - Key offerings
- 16.14 Lululemon Athletica Inc.
- Lululemon Athletica Inc. - Overview
- Lululemon Athletica Inc. - Product / Service
- Lululemon Athletica Inc. - Key offerings
- 16.15 Mizuno Corp.
- Mizuno Corp. - Overview
- Mizuno Corp. - Product / Service
- Mizuno Corp. - Key offerings
- 16.16 Nike Inc.
- Nike Inc. - Overview
- Nike Inc. - Product / Service
- Nike Inc. - Key offerings
- 16.17 Nordstrom Inc.
- Nordstrom Inc. - Overview
- Nordstrom Inc. - Product / Service
- Nordstrom Inc. - Key offerings
- 16.18 PUMA SE
- PUMA SE - Overview
- PUMA SE - Product / Service
- PUMA SE - Key offerings
- 16.19 Ralph Lauren Corp.
- Ralph Lauren Corp. - Overview
- Ralph Lauren Corp. - Product / Service
- Ralph Lauren Corp. - Key offerings
- 16.20 Spanx LLC
- Spanx LLC - Overview
- Spanx LLC - Product / Service
- Spanx LLC - Key offerings
- 16.21 Under Armour Inc.
- Under Armour Inc. - Overview
- Under Armour Inc. - Product / Service
- Under Armour Inc. - Key offerings
- 16.22 Vie Performance LLC
- Vie Performance LLC - Overview
- Vie Performance LLC - Product / Service
- Vie Performance LLC - Key offerings
- 16.23 Adidas AG
- Adidas AG - Overview
- Adidas AG - Product / Service
- Adidas AG - Key offerings
- 16.24 Anita Dr. Helbig GmbH
- Anita Dr. Helbig GmbH - Overview
- Anita Dr. Helbig GmbH - Product / Service
- Anita Dr. Helbig GmbH - Key offerings
- 16.25 ASICS Corp.
- ASICS Corp. - Overview
- ASICS Corp. - Product / Service
- ASICS Corp. - Key offerings
- 16.26 Burberry Group Plc
- Burberry Group Plc - Overview
- Burberry Group Plc - Product / Service
- Burberry Group Plc - Key offerings
- 16.27 Columbia Sportswear Co.
- Columbia Sportswear Co. - Overview
- Columbia Sportswear Co. - Product / Service
- Columbia Sportswear Co. - Key offerings
- 16.28 Global Intimates LLC
- Global Intimates LLC - Overview
- Global Intimates LLC - Product / Service
- Global Intimates LLC - Key offerings
- 16.29 Hanesbrands Inc.
- Hanesbrands Inc. - Overview
- Hanesbrands Inc. - Product / Service
- Hanesbrands Inc. - Key offerings
- 16.30 Jockey International Inc.
- Jockey International Inc. - Overview
- Jockey International Inc. - Product / Service
- Jockey International Inc. - Key offerings
- 16.31 Mizuno Corp.
- Mizuno Corp. - Overview
- Mizuno Corp. - Product / Service
- Mizuno Corp. - Key offerings
- 16.32 Nike Inc.
- Nike Inc. - Overview
- Nike Inc. - Product / Service
- Nike Inc. - Key offerings
- 16.33 Nordstrom Inc.
- Nordstrom Inc. - Overview
- Nordstrom Inc. - Product / Service
- Nordstrom Inc. - Key offerings
- 16.34 PUMA SE
- PUMA SE - Overview
- PUMA SE - Product / Service
- PUMA SE - Key offerings
- 16.35 Ralph Lauren Corp.
- Ralph Lauren Corp. - Overview
- Ralph Lauren Corp. - Product / Service
- Ralph Lauren Corp. - Key offerings
- 16.36 Spanx LLC
- Spanx LLC - Overview
- Spanx LLC - Product / Service
- Spanx LLC - Key offerings
- 16.37 The Gap Inc.
- The Gap Inc. - Overview
- The Gap Inc. - Product / Service
- The Gap Inc. - Key offerings
- 16.38 Under Armour Inc.
- Under Armour Inc. - Overview
- Under Armour Inc. - Product / Service
- Under Armour Inc. - Key offerings
- 16.39 Vie Performance LLC
- Vie Performance LLC - Overview
- Vie Performance LLC - Product / Service
- Vie Performance LLC - Key offerings
17 Appendix
- 17.2 Inclusions and exclusions checklist
- Inclusions checklist
- Exclusions checklist
- 17.3 Currency conversion rates for US$
- Currency conversion rates for US$
- 17.4 Research methodology
- 17.7 Validation techniques employed for market sizing
- Validation techniques employed for market sizing
- 17.9 360 degree market analysis
- 360 degree market analysis
- 17.10 List of abbreviations