Workforce Analytics Market Analysis, Size, and Forecast 2026-2030: North America (US, Canada, and Mexico), Europe (Germany, UK, and France), APAC (China, Japan, and India), South America (Brazil and Argentina), Middle East and Africa (Saudi Arabia, UAE, and Turkey), and Rest of World (ROW)

Workforce Analytics Market Analysis, Size, and Forecast 2026-2030:
North America (US, Canada, and Mexico), Europe (Germany, UK, and France), APAC (China, Japan, and India), South America (Brazil and Argentina), Middle East and Africa (Saudi Arabia, UAE, and Turkey), and Rest of World (ROW)

Published: Mar 2026 304 Pages SKU: IRTNTR43573

Market Overview at a Glance

$4.12 B
Market Opportunity
20.2%
CAGR 2025 - 2030
32.9%
Europe Growth
$645.3 Mn
Retail segment 2024

Workforce Analytics Market Size 2026-2030

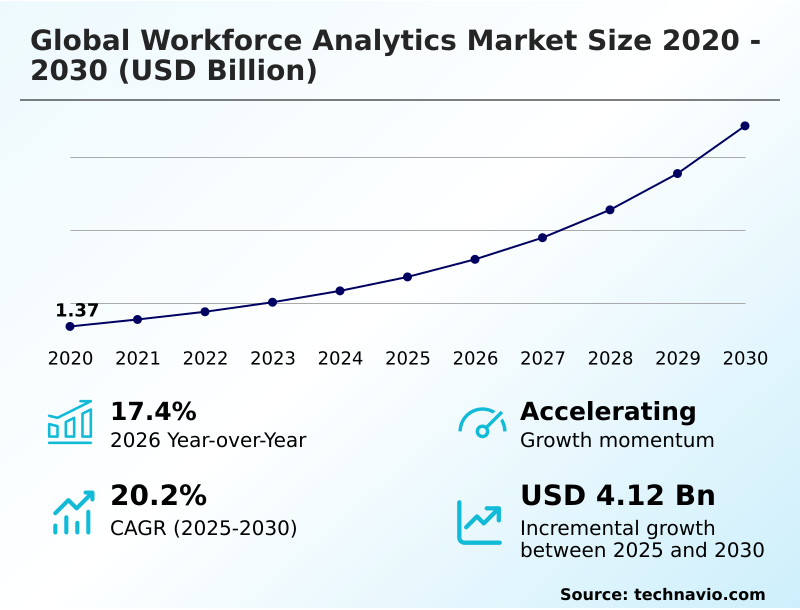
The workforce analytics market size is valued to increase by USD 4.12 billion, at a CAGR of 20.2% from 2025 to 2030. Generative AI integration and industrialization of predictive talent lifecycle architectures will drive the workforce analytics market.

Major Market Trends & Insights

  • Europe dominated the market and accounted for a 32.9% growth during the forecast period.
  • By End-user - Retail segment was valued at USD 645.3 million in 2024
  • By Application - Large enterprises segment accounted for the largest market revenue share in 2024

Market Size & Forecast

  • Market Opportunities: USD 5.48 billion
  • Market Future Opportunities: USD 4.12 billion
  • CAGR from 2025 to 2030 : 20.2%

Market Summary

  • The workforce analytics market is undergoing a structural recalibration, moving from static reporting toward proactive, agentic intelligence ecosystems. This transition is fueled by the escalating complexity of hybrid work models and a heightened organizational focus on skills-based agility over traditional job-based hierarchies.
  • As enterprises prioritize human capital optimization, demand is growing for integrated platforms that use real-time data to predict retention risks, identify critical skill gaps, and simulate the financial impact of various workforce scenarios. This evolution is accelerated by generative artificial intelligence, which democratizes access to sophisticated people insights through natural language interfaces.
  • For example, a large logistics firm can now use AI-driven prescriptive modeling to analyze route efficiency against driver sentiment data, identifying burnout risks that correlate with delivery delays. The platform can then recommend optimized schedules that balance operational targets with employee well-being, improving both retention and on-time performance.
  • This shift reflects a broader industry movement toward autonomous software agents that are empowered to take direct action, redefining how organizations manage their most valuable asset.

What will be the Size of the Workforce Analytics Market during the forecast period?

Get Key Insights on Market Forecast (PDF) Request Free Sample

How is the Workforce Analytics Market Segmented?

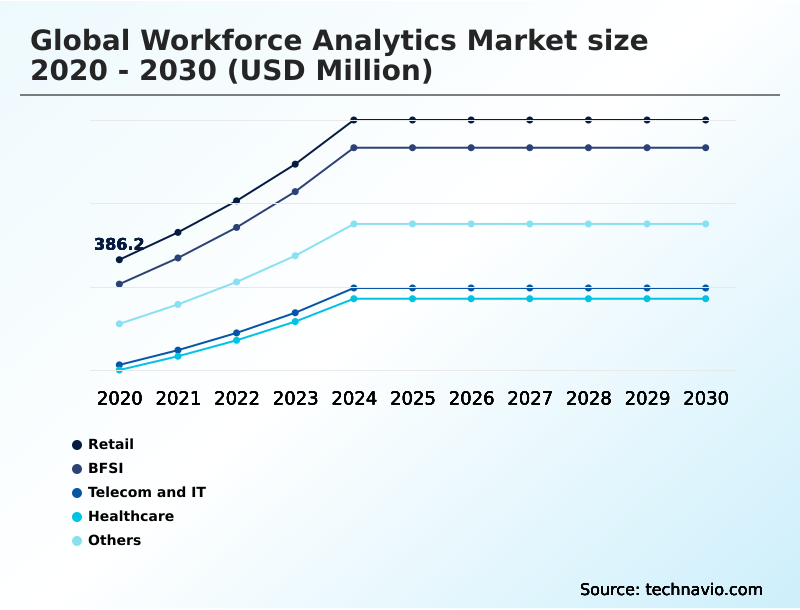
The workforce analytics industry research report provides comprehensive data (region-wise segment analysis), with forecasts and estimates in "USD million" for the period 2026-2030, as well as historical data from 2020-2024 for the following segments.

  • End-user
    • Retail
    • BFSI
    • Telecom and IT
    • Healthcare
    • Others
  • Application
    • Large enterprises
    • Small and medium sized enterprise
  • Deployment
    • Cloud
    • On-premises
    • Hybrid
  • Geography
    • North America
      • US
      • Canada
      • Mexico
    • Europe
      • Germany
      • UK
      • France
    • APAC
      • China
      • Japan
      • India
    • South America
      • Brazil
      • Argentina
    • Middle East and Africa
      • Saudi Arabia
      • UAE
      • Turkey
    • Rest of World (ROW)

By End-user Insights

The retail segment is estimated to witness significant growth during the forecast period.

The retail segment utilizes predictive talent lifecycle architectures to synchronize labor with fluctuating consumer demand.

Organizations are shifting from simple scheduling to advanced human capital optimization strategies, leveraging passive data collection methods from point-of-sale and footfall systems to inform predictive attrition modeling.

This pivot toward organizational agility through data enables retailers to align staffing with peak demand, improving conversion rates by over 15%.

In the context of phygital environment management, platforms increasingly use large language models for HR to ensure workforce cultural integrity across both physical and digital touchpoints, analyzing sentiment to reduce turnover in a sector traditionally challenged by high churn rates.

Request Free Sample

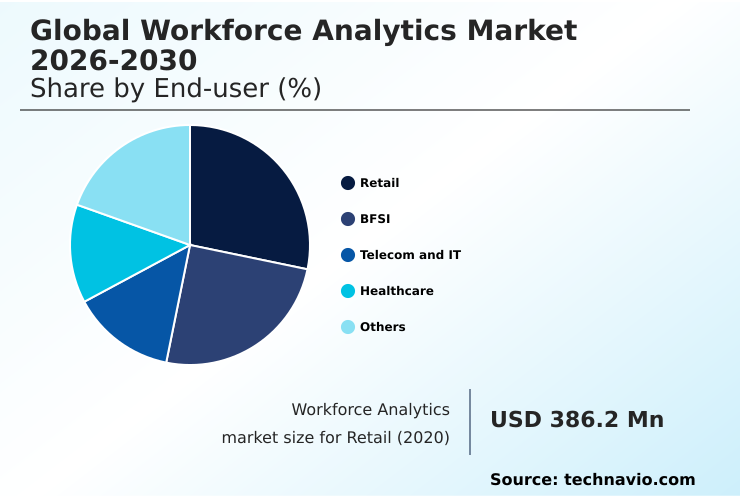
The Retail segment was valued at USD 645.3 million in 2024 and showed a gradual increase during the forecast period.

Request Free Sample

Regional Analysis

Europe is estimated to contribute 32.9% to the growth of the global market during the forecast period.Technavio’s analysts have elaborately explained the regional trends and drivers that shape the market during the forecast period.

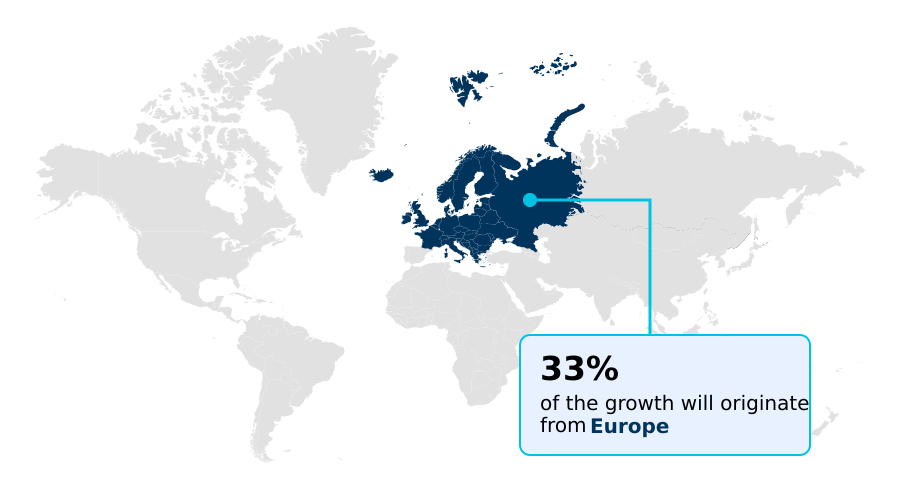
See How Workforce Analytics Market Demand is Rising in Europe Request Free Sample

The geographic landscape is defined by varied adoption rates and regional priorities. In North America, the focus is on AI-driven learning and knowledge, with prescriptive modeling for retention reducing employee turnover by up to 22% in the tech sector.

Europe prioritizes compliance, with pay transparency analytics tools becoming standard to adhere to new directives. The APAC region is rapidly adopting technology for job-readiness and practical skills assessment, with AI improving internal labor market efficiency.

Key vendors are providing context-aware decision support and neural network development tracking to manage global talent pools.

Innovations such as virtual nursing role coordination are being tested in developed markets to address specialized labor shortages, highlighting a global move toward data-informed workforce management.

Market Dynamics

Our researchers analyzed the data with 2025 as the base year, along with the key drivers, trends, and challenges. A holistic analysis of drivers will help companies refine their marketing strategies to gain a competitive advantage.

  • Strategic implementation of workforce analytics for employee retention is now a primary focus for competitive organizations. By using AI for predictive hiring, firms can better align talent with long-term business goals. Measuring productivity in hybrid work environments has become essential, with platforms offering granular insights into engagement and output.
  • A critical application is analytics for skills gap analysis, which informs targeted development programs and supports data-driven employee engagement strategies. The push for ethical AI in human resources is reshaping procurement, as companies demand transparency in algorithms to support initiatives for analyzing workforce diversity and inclusion.
  • Decision-makers are increasingly focused on the ROI of workforce analytics software, particularly in optimizing labor costs with analytics, which has shown to reduce overhead by over 15% compared to traditional methods. Effective workforce planning for large enterprises now relies on sophisticated modeling, while compliance reporting with HR analytics automates adherence to complex regulations.
  • To maintain agility, firms are using real-time sentiment analysis tools and talent mobility platform integration. Managing contingent worker data and preventing employee burnout with analytics are also key priorities.
  • Sector-specific applications, such as workforce analytics for retail staffing, BFSI talent risk management, developing a telecom IT skills taxonomy, healthcare staff scheduling analytics, and analytics for manufacturing productivity, demonstrate the technology’s broad impact.

What are the key market drivers leading to the rise in the adoption of Workforce Analytics Industry?

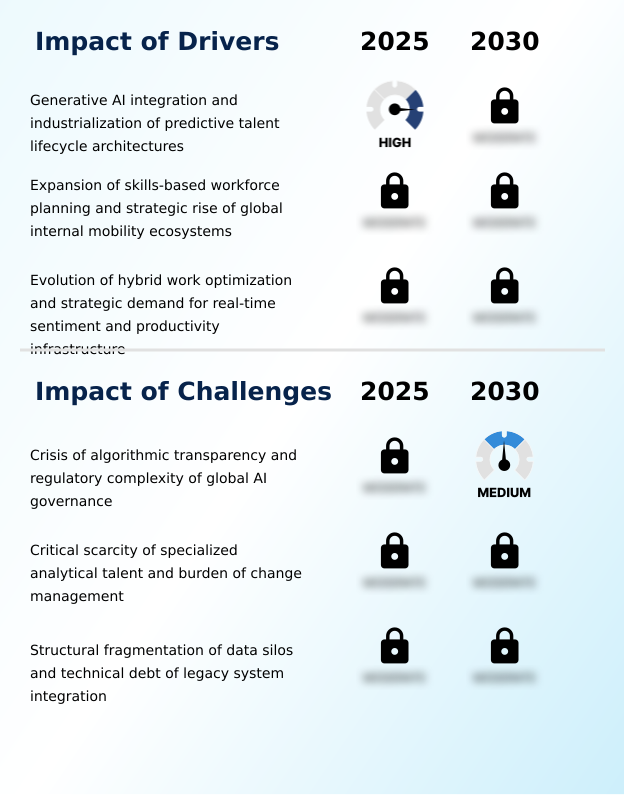
  • The primary market driver is the integration of generative AI and the industrialization of predictive talent lifecycle architectures within enterprise-scale organizations.

  • Key market drivers are centered on the integration of advanced AI and strategic workforce planning.
  • The deployment of agentic intelligence ecosystems, featuring agentic AI tutor deployment, is enhancing employee development and fostering a data-centric culture, boosting productivity by over 20% in early-adopter firms.
  • Organizations are leveraging granular skills-inference models and automated bias audit frameworks to build more equitable and efficient talent pipelines.
  • The expansion of glocal analytics for global HR, which provides localized labor market intelligence through compliance-aware intelligence systems, enables multinationals to navigate complex regulatory environments with greater precision.
  • This strategic alignment of global goals with local nuances is proving critical for sustained competitive advantage.

What are the market trends shaping the Workforce Analytics Industry?

  • The institutionalization of algorithmic transparency is becoming a market standard, compelling the adoption of ethical bias mitigation frameworks in all automated employment decision tools.

  • Market trends are coalescing around ethical governance and workforce agility. The adoption of Explainable AI (XAI) in HR is accelerating, driven by the need for legal and ethical defensibility in automated decisions. This push for transparency is supported by platforms offering ethical bias mitigation frameworks, which have been shown to reduce discriminatory outcomes in hiring algorithms by up to 40%.
  • Concurrently, the rise of total talent orchestration platforms and internal talent marketplace technology signifies a shift toward fluid workforce ecosystem management. This on-demand organizational design allows companies to blend full-time and contingent workers seamlessly, improving project staffing efficiency by 25%. These systems are becoming essential for maintaining audit-ready analytics for compliance.

What challenges does the Workforce Analytics Industry face during its growth?

  • A key challenge is the crisis of algorithmic transparency, which is compounded by the regulatory complexity of emerging global AI governance frameworks for human resources.

  • Significant challenges persist around data integration and regulatory compliance. The process of creating a unified data lake for talent is often hampered by the need for extensive data cleaning and harmonization, which can consume over 50% of a project's timeline. Developing skills-centric data architectures that provide real-time talent heatmap visualization requires overcoming technical debt from legacy systems.
  • Furthermore, navigating multi-jurisdictional compliance models remains a primary obstacle, with the cost of non-compliance increasing significantly. While platforms are evolving to offer autonomous decision-making support and context-aware HR policy guidance, the reliability of AI-enabled skills assessments is still under scrutiny, demanding rigorous validation to ensure fairness and accuracy.

Exclusive Technavio Analysis on Customer Landscape

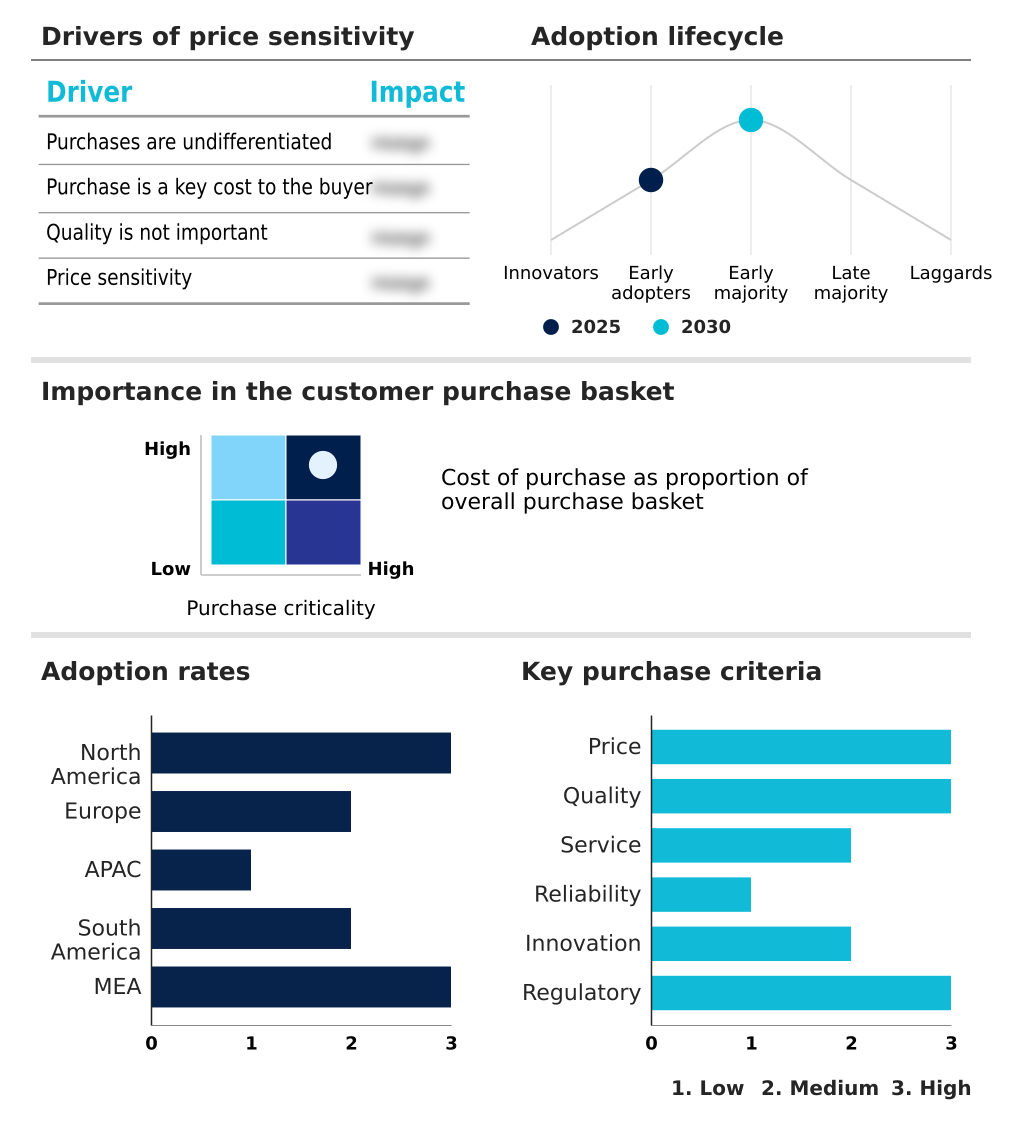
The workforce analytics market forecasting report includes the adoption lifecycle of the market, covering from the innovator’s stage to the laggard’s stage. It focuses on adoption rates in different regions based on penetration. Furthermore, the workforce analytics market report also includes key purchase criteria and drivers of price sensitivity to help companies evaluate and develop their market growth analysis strategies.

Customer Landscape of Workforce Analytics Industry

Competitive Landscape

Companies are implementing various strategies, such as strategic alliances, workforce analytics market forecast, partnerships, mergers and acquisitions, geographical expansion, and product/service launches, to enhance their presence in the industry.

Anaplan Inc. - Orchestrates complex scenario planning and continuous forecasting through a proprietary cloud platform, enabling enterprises to identify opportunities and mitigate risk.

The industry research and growth report includes detailed analyses of the competitive landscape of the market and information about key companies, including:

  • Anaplan Inc.
  • Automatic Data Processing Inc.
  • ChartHop Inc.
  • Cornerstone OnDemand Inc.
  • Dayforce Inc.
  • Eightfold AI
  • Genpact Ltd.
  • IBM Corp.
  • Infor Inc.
  • Lattice Engines Inc.
  • Microsoft Corp.
  • One Model Inc.
  • Oracle Corp.
  • SAP SE
  • Sapience Analytics
  • SAS Institute Inc.
  • UKG Inc.
  • Visier Inc.
  • Workday Inc.
  • WorkForce Software LLC

Qualitative and quantitative analysis of companies has been conducted to help clients understand the wider business environment as well as the strengths and weaknesses of key industry players. Data is qualitatively analyzed to categorize companies as pure play, category-focused, industry-focused, and diversified; it is quantitatively analyzed to categorize companies as dominant, leading, strong, tentative, and weak.

Recent Development and News in Workforce analytics market

  • In March 2025, Workday Inc. announced the full integration of its Sana AI-driven learning and knowledge capabilities into its core Human Capital Management platform. This enhancement is designed to create agentic AI workflows that autonomously recommend internal mobility pathways, reflecting the platform's analysis of over one billion AI actions annually.
  • In February 2025, Oracle Corp. released a significant update to its Analytics Cloud, introducing AI Data Agents. This new feature enables HR professionals to pair workforce datasets with internal policy documents, allowing the system to provide context-aware answers to complex queries regarding employee performance and regional compliance.
  • In November 2024, Visier Inc. launched its Model Context Protocol, an AI ecosystem expansion designed to facilitate secure, auditable integration between its workforce intelligence platform and major agentic AI frameworks like Microsoft Copilot and OpenAI. This initiative focuses on enhancing explainable AI and ethical data usage.
  • In September 2024, Eightfold AI announced the successful scaling of its AI Interviewer technology across several Fortune 500 companies. The platform now generates verified skills intelligence during the initial recruitment phase, reducing time-to-hire by an average of 35% for technical roles.

Dive into Technavio’s robust research methodology, blending expert interviews, extensive data synthesis, and validated models for unparalleled Workforce Analytics Market insights. See full methodology.

Market Scope
Page number 304
Base year 2025
Historic period 2020-2024
Forecast period 2026-2030
Growth momentum & CAGR Accelerate at a CAGR of 20.2%
Market growth 2026-2030 USD 4121.3 million
Market structure Fragmented
YoY growth 2025-2026(%) 17.4%
Key countries US, Canada, Mexico, Germany, UK, France, Italy, Spain, The Netherlands, China, Japan, India, South Korea, Australia, Indonesia, Brazil, Argentina, Chile, Saudi Arabia, UAE, Turkey, South Africa and Israel
Competitive landscape Leading Companies, Market Positioning of Companies, Competitive Strategies, and Industry Risks

Request Free Sample

Research Analyst Overview

  • The market is defined by the industrialization of predictive talent lifecycle architectures and the deployment of total talent orchestration platforms. These systems leverage large language models for HR and granular skills-inference models to create a holistic view of human capital.
  • A core technological trend is the institutionalization of Explainable AI (XAI) in HR, driven by demand for automated bias audit frameworks and ethical bias mitigation frameworks to ensure regulatory adherence. Organizations are implementing agentic AI tutor deployment and internal talent marketplace technology to foster continuous development and mobility.
  • The expansion into glocal analytics for global HR, supported by multi-jurisdictional compliance models, addresses the complexity of managing a distributed workforce in varied phygital environment management scenarios. Platforms increasingly offer autonomous decision-making support and context-aware decision support, with some achieving a 30% reduction in time-to-hire by focusing on job-readiness and practical skills over credentials.
  • Innovations in AI-driven learning and knowledge and neural network development tracking are becoming standard, while passive data collection methods provide real-time insights into workforce dynamics.

What are the Key Data Covered in this Workforce Analytics Market Research and Growth Report?

  • What is the expected growth of the Workforce Analytics Market between 2026 and 2030?

    • USD 4.12 billion, at a CAGR of 20.2%

  • What segmentation does the market report cover?

    • The report is segmented by End-user (Retail, BFSI, Telecom and IT, Healthcare, and Others), Application (Large enterprises, and Small and medium sized enterprise), Deployment (Cloud, On-premises, and Hybrid) and Geography (North America, Europe, APAC, South America, Middle East and Africa)

  • Which regions are analyzed in the report?

    • North America, Europe, APAC, South America and Middle East and Africa

  • What are the key growth drivers and market challenges?

    • Generative AI integration and industrialization of predictive talent lifecycle architectures, Crisis of algorithmic transparency and regulatory complexity of global AI governance

  • Who are the major players in the Workforce Analytics Market?

    • Anaplan Inc., Automatic Data Processing Inc., ChartHop Inc., Cornerstone OnDemand Inc., Dayforce Inc., Eightfold AI, Genpact Ltd., IBM Corp., Infor Inc., Lattice Engines Inc., Microsoft Corp., One Model Inc., Oracle Corp., SAP SE, Sapience Analytics, SAS Institute Inc., UKG Inc., Visier Inc., Workday Inc. and WorkForce Software LLC

Market Research Insights

  • Market dynamics are increasingly shaped by human capital optimization strategies that leverage prescriptive modeling for retention, reducing employee churn by up to 25% in high-turnover industries. The adoption of AI-enabled skills assessments and pay transparency analytics tools is fostering a more data-centric culture. Organizations are implementing audit-ready analytics for compliance, achieving over 90% alignment with evolving labor regulations.
  • The management of fluid workforce ecosystems is supported by agentic intelligence ecosystems and skills-centric data architectures, which improve internal labor market efficiency. By providing context-aware HR policy guidance and enabling virtual nursing role coordination, these systems ensure workforce cultural integrity and legal and ethical defensibility, central to on-demand organizational design.

We can help! Our analysts can customize this workforce analytics market research report to meet your requirements.

Get in touch

1. Executive Summary

1.1 Market overview

Executive Summary - Chart on Market Overview
Executive Summary - Data Table on Market Overview
Executive Summary - Chart on Global Market Characteristics
Executive Summary - Chart on Market by Geography
Executive Summary - Chart on Market Segmentation by End-user
Executive Summary - Chart on Market Segmentation by Application
Executive Summary - Chart on Market Segmentation by Deployment
Executive Summary - Chart on Incremental Growth
Executive Summary - Data Table on Incremental Growth
Executive Summary - Chart on Company Market Positioning

2. Technavio Analysis

2.1 Analysis of price sensitivity, lifecycle, customer purchase basket, adoption rates, and purchase criteria

2.2 Criticality of inputs and Factors of differentiation

Chart on Overview on criticality of inputs and factors of differentiation

2.3 Factors of disruption

Chart on Overview on factors of disruption

2.4 Impact of drivers and challenges

Chart on Impact of drivers and challenges in 2025 and 2030

3. Market Landscape

3.1 Market ecosystem

Chart on Parent Market
Data Table on - Parent Market

3.2 Market characteristics

Chart on Market characteristics analysis

3.3 Value chain analysis

Chart on Value chain analysis

4. Market Sizing

4.1 Market definition

Data Table on Offerings of companies included in the market definition

4.2 Market segment analysis

Market segments

4.3 Market size 2025

4.4 Market outlook: Forecast for 2025-2030

Chart on Global - Market size and forecast 2025-2030 ($ million)
Data Table on Global - Market size and forecast 2025-2030 ($ million)
Chart on Global Market: Year-over-year growth 2025-2030 (%)
Data Table on Global Market: Year-over-year growth 2025-2030 (%)

5. Historic Market Size

5.1 Global Workforce Analytics Market 2020 - 2024

Historic Market Size - Data Table on Global Workforce Analytics Market 2020 - 2024 ($ million)

5.2 End-user segment analysis 2020 - 2024

Historic Market Size - End-user Segment 2020 - 2024 ($ million)

5.3 Application segment analysis 2020 - 2024

Historic Market Size - Application Segment 2020 - 2024 ($ million)

5.4 Deployment segment analysis 2020 - 2024

Historic Market Size - Deployment Segment 2020 - 2024 ($ million)

5.5 Geography segment analysis 2020 - 2024

Historic Market Size - Geography Segment 2020 - 2024 ($ million)

5.6 Country segment analysis 2020 - 2024

Historic Market Size - Country Segment 2020 - 2024 ($ million)

6. Qualitative Analysis

6.1 Impact of AI in global workforce analytics market

6.2 Impact of geopolitical conflict for global workforce analytics market

7. Five Forces Analysis

7.1 Five forces summary

Five forces analysis - Comparison between 2025 and 2030

7.2 Bargaining power of buyers

Bargaining power of buyers - Impact of key factors 2025 and 2030

7.3 Bargaining power of suppliers

Bargaining power of suppliers - Impact of key factors in 2025 and 2030

7.4 Threat of new entrants

Threat of new entrants - Impact of key factors in 2025 and 2030

7.5 Threat of substitutes

Threat of substitutes - Impact of key factors in 2025 and 2030

7.6 Threat of rivalry

Threat of rivalry - Impact of key factors in 2025 and 2030

7.7 Market condition

Chart on Market condition - Five forces 2025 and 2030

8. Market Segmentation by End-user

8.1 Market segments

Chart on End-user - Market share 2025-2030 (%)
Data Table on End-user - Market share 2025-2030 (%)

8.2 Comparison by End-user

Chart on Comparison by End-user
Data Table on Comparison by End-user

8.3 Retail - Market size and forecast 2025-2030

Chart on Retail - Market size and forecast 2025-2030 ($ million)
Data Table on Retail - Market size and forecast 2025-2030 ($ million)
Chart on Retail - Year-over-year growth 2025-2030 (%)
Data Table on Retail - Year-over-year growth 2025-2030 (%)

8.4 BFSI - Market size and forecast 2025-2030

Chart on BFSI - Market size and forecast 2025-2030 ($ million)
Data Table on BFSI - Market size and forecast 2025-2030 ($ million)
Chart on BFSI - Year-over-year growth 2025-2030 (%)
Data Table on BFSI - Year-over-year growth 2025-2030 (%)

8.5 Telecom and IT - Market size and forecast 2025-2030

Chart on Telecom and IT - Market size and forecast 2025-2030 ($ million)
Data Table on Telecom and IT - Market size and forecast 2025-2030 ($ million)
Chart on Telecom and IT - Year-over-year growth 2025-2030 (%)
Data Table on Telecom and IT - Year-over-year growth 2025-2030 (%)

8.6 Healthcare - Market size and forecast 2025-2030

Chart on Healthcare - Market size and forecast 2025-2030 ($ million)
Data Table on Healthcare - Market size and forecast 2025-2030 ($ million)
Chart on Healthcare - Year-over-year growth 2025-2030 (%)
Data Table on Healthcare - Year-over-year growth 2025-2030 (%)

8.7 Others - Market size and forecast 2025-2030

Chart on Others - Market size and forecast 2025-2030 ($ million)
Data Table on Others - Market size and forecast 2025-2030 ($ million)
Chart on Others - Year-over-year growth 2025-2030 (%)
Data Table on Others - Year-over-year growth 2025-2030 (%)

8.8 Market opportunity by End-user

Market opportunity by End-user ($ million)
Data Table on Market opportunity by End-user ($ million)

9. Market Segmentation by Application

9.1 Market segments

Chart on Application - Market share 2025-2030 (%)
Data Table on Application - Market share 2025-2030 (%)

9.2 Comparison by Application

Chart on Comparison by Application
Data Table on Comparison by Application

9.3 Large enterprises - Market size and forecast 2025-2030

Chart on Large enterprises - Market size and forecast 2025-2030 ($ million)
Data Table on Large enterprises - Market size and forecast 2025-2030 ($ million)
Chart on Large enterprises - Year-over-year growth 2025-2030 (%)
Data Table on Large enterprises - Year-over-year growth 2025-2030 (%)

9.4 Small and medium sized enterprise - Market size and forecast 2025-2030

Chart on Small and medium sized enterprise - Market size and forecast 2025-2030 ($ million)
Data Table on Small and medium sized enterprise - Market size and forecast 2025-2030 ($ million)
Chart on Small and medium sized enterprise - Year-over-year growth 2025-2030 (%)
Data Table on Small and medium sized enterprise - Year-over-year growth 2025-2030 (%)

9.5 Market opportunity by Application

Market opportunity by Application ($ million)
Data Table on Market opportunity by Application ($ million)

10. Market Segmentation by Deployment

10.1 Market segments

Chart on Deployment - Market share 2025-2030 (%)
Data Table on Deployment - Market share 2025-2030 (%)

10.2 Comparison by Deployment

Chart on Comparison by Deployment
Data Table on Comparison by Deployment

10.3 Cloud - Market size and forecast 2025-2030

Chart on Cloud - Market size and forecast 2025-2030 ($ million)
Data Table on Cloud - Market size and forecast 2025-2030 ($ million)
Chart on Cloud - Year-over-year growth 2025-2030 (%)
Data Table on Cloud - Year-over-year growth 2025-2030 (%)

10.4 On-premises - Market size and forecast 2025-2030

Chart on On-premises - Market size and forecast 2025-2030 ($ million)
Data Table on On-premises - Market size and forecast 2025-2030 ($ million)
Chart on On-premises - Year-over-year growth 2025-2030 (%)
Data Table on On-premises - Year-over-year growth 2025-2030 (%)

10.5 Hybrid - Market size and forecast 2025-2030

Chart on Hybrid - Market size and forecast 2025-2030 ($ million)
Data Table on Hybrid - Market size and forecast 2025-2030 ($ million)
Chart on Hybrid - Year-over-year growth 2025-2030 (%)
Data Table on Hybrid - Year-over-year growth 2025-2030 (%)

10.6 Market opportunity by Deployment

Market opportunity by Deployment ($ million)
Data Table on Market opportunity by Deployment ($ million)

11. Customer Landscape

11.1 Customer landscape overview

Analysis of price sensitivity, lifecycle, customer purchase basket, adoption rates, and purchase criteria

12. Geographic Landscape

12.1 Geographic segmentation

Chart on Market share by geography 2025-2030 (%)
Data Table on Market share by geography 2025-2030 (%)

12.2 Geographic comparison

Chart on Geographic comparison
Data Table on Geographic comparison

12.3 North America - Market size and forecast 2025-2030

Chart on North America - Market size and forecast 2025-2030 ($ million)
Data Table on North America - Market size and forecast 2025-2030 ($ million)
Chart on North America - Year-over-year growth 2025-2030 (%)
Data Table on North America - Year-over-year growth 2025-2030 (%)
Chart on Regional Comparison - North America
Data Table on Regional Comparison - North America

12.3.1 US - Market size and forecast 2025-2030

Chart on US - Market size and forecast 2025-2030 ($ million)
Data Table on US - Market size and forecast 2025-2030 ($ million)
Chart on US - Year-over-year growth 2025-2030 (%)
Data Table on US - Year-over-year growth 2025-2030 (%)

12.3.2 Canada - Market size and forecast 2025-2030

Chart on Canada - Market size and forecast 2025-2030 ($ million)
Data Table on Canada - Market size and forecast 2025-2030 ($ million)
Chart on Canada - Year-over-year growth 2025-2030 (%)
Data Table on Canada - Year-over-year growth 2025-2030 (%)

12.3.3 Mexico - Market size and forecast 2025-2030

Chart on Mexico - Market size and forecast 2025-2030 ($ million)
Data Table on Mexico - Market size and forecast 2025-2030 ($ million)
Chart on Mexico - Year-over-year growth 2025-2030 (%)
Data Table on Mexico - Year-over-year growth 2025-2030 (%)

12.4 Europe - Market size and forecast 2025-2030

Chart on Europe - Market size and forecast 2025-2030 ($ million)
Data Table on Europe - Market size and forecast 2025-2030 ($ million)
Chart on Europe - Year-over-year growth 2025-2030 (%)
Data Table on Europe - Year-over-year growth 2025-2030 (%)
Chart on Regional Comparison - Europe
Data Table on Regional Comparison - Europe

12.4.1 Germany - Market size and forecast 2025-2030

Chart on Germany - Market size and forecast 2025-2030 ($ million)
Data Table on Germany - Market size and forecast 2025-2030 ($ million)
Chart on Germany - Year-over-year growth 2025-2030 (%)
Data Table on Germany - Year-over-year growth 2025-2030 (%)

12.4.2 UK - Market size and forecast 2025-2030

Chart on UK - Market size and forecast 2025-2030 ($ million)
Data Table on UK - Market size and forecast 2025-2030 ($ million)
Chart on UK - Year-over-year growth 2025-2030 (%)
Data Table on UK - Year-over-year growth 2025-2030 (%)

12.4.3 France - Market size and forecast 2025-2030

Chart on France - Market size and forecast 2025-2030 ($ million)
Data Table on France - Market size and forecast 2025-2030 ($ million)
Chart on France - Year-over-year growth 2025-2030 (%)
Data Table on France - Year-over-year growth 2025-2030 (%)

12.4.4 Italy - Market size and forecast 2025-2030

Chart on Italy - Market size and forecast 2025-2030 ($ million)
Data Table on Italy - Market size and forecast 2025-2030 ($ million)
Chart on Italy - Year-over-year growth 2025-2030 (%)
Data Table on Italy - Year-over-year growth 2025-2030 (%)

12.4.5 Spain - Market size and forecast 2025-2030

Chart on Spain - Market size and forecast 2025-2030 ($ million)
Data Table on Spain - Market size and forecast 2025-2030 ($ million)
Chart on Spain - Year-over-year growth 2025-2030 (%)
Data Table on Spain - Year-over-year growth 2025-2030 (%)

12.4.6 The Netherlands - Market size and forecast 2025-2030

Chart on The Netherlands - Market size and forecast 2025-2030 ($ million)
Data Table on The Netherlands - Market size and forecast 2025-2030 ($ million)
Chart on The Netherlands - Year-over-year growth 2025-2030 (%)
Data Table on The Netherlands - Year-over-year growth 2025-2030 (%)

12.5 APAC - Market size and forecast 2025-2030

Chart on APAC - Market size and forecast 2025-2030 ($ million)
Data Table on APAC - Market size and forecast 2025-2030 ($ million)
Chart on APAC - Year-over-year growth 2025-2030 (%)
Data Table on APAC - Year-over-year growth 2025-2030 (%)
Chart on Regional Comparison - APAC
Data Table on Regional Comparison - APAC

12.5.1 China - Market size and forecast 2025-2030

Chart on China - Market size and forecast 2025-2030 ($ million)
Data Table on China - Market size and forecast 2025-2030 ($ million)
Chart on China - Year-over-year growth 2025-2030 (%)
Data Table on China - Year-over-year growth 2025-2030 (%)

12.5.2 Japan - Market size and forecast 2025-2030

Chart on Japan - Market size and forecast 2025-2030 ($ million)
Data Table on Japan - Market size and forecast 2025-2030 ($ million)
Chart on Japan - Year-over-year growth 2025-2030 (%)
Data Table on Japan - Year-over-year growth 2025-2030 (%)

12.5.3 India - Market size and forecast 2025-2030

Chart on India - Market size and forecast 2025-2030 ($ million)
Data Table on India - Market size and forecast 2025-2030 ($ million)
Chart on India - Year-over-year growth 2025-2030 (%)
Data Table on India - Year-over-year growth 2025-2030 (%)

12.5.4 South Korea - Market size and forecast 2025-2030

Chart on South Korea - Market size and forecast 2025-2030 ($ million)
Data Table on South Korea - Market size and forecast 2025-2030 ($ million)
Chart on South Korea - Year-over-year growth 2025-2030 (%)
Data Table on South Korea - Year-over-year growth 2025-2030 (%)

12.5.5 Australia - Market size and forecast 2025-2030

Chart on Australia - Market size and forecast 2025-2030 ($ million)
Data Table on Australia - Market size and forecast 2025-2030 ($ million)
Chart on Australia - Year-over-year growth 2025-2030 (%)
Data Table on Australia - Year-over-year growth 2025-2030 (%)

12.5.6 Indonesia - Market size and forecast 2025-2030

Chart on Indonesia - Market size and forecast 2025-2030 ($ million)
Data Table on Indonesia - Market size and forecast 2025-2030 ($ million)
Chart on Indonesia - Year-over-year growth 2025-2030 (%)
Data Table on Indonesia - Year-over-year growth 2025-2030 (%)

12.6 South America - Market size and forecast 2025-2030

Chart on South America - Market size and forecast 2025-2030 ($ million)
Data Table on South America - Market size and forecast 2025-2030 ($ million)
Chart on South America - Year-over-year growth 2025-2030 (%)
Data Table on South America - Year-over-year growth 2025-2030 (%)
Chart on Regional Comparison - South America
Data Table on Regional Comparison - South America

12.6.1 Brazil - Market size and forecast 2025-2030

Chart on Brazil - Market size and forecast 2025-2030 ($ million)
Data Table on Brazil - Market size and forecast 2025-2030 ($ million)
Chart on Brazil - Year-over-year growth 2025-2030 (%)
Data Table on Brazil - Year-over-year growth 2025-2030 (%)

12.6.2 Argentina - Market size and forecast 2025-2030

Chart on Argentina - Market size and forecast 2025-2030 ($ million)
Data Table on Argentina - Market size and forecast 2025-2030 ($ million)
Chart on Argentina - Year-over-year growth 2025-2030 (%)
Data Table on Argentina - Year-over-year growth 2025-2030 (%)

12.6.3 Chile - Market size and forecast 2025-2030

Chart on Chile - Market size and forecast 2025-2030 ($ million)
Data Table on Chile - Market size and forecast 2025-2030 ($ million)
Chart on Chile - Year-over-year growth 2025-2030 (%)
Data Table on Chile - Year-over-year growth 2025-2030 (%)

12.7 Middle East and Africa - Market size and forecast 2025-2030

Chart on Middle East and Africa - Market size and forecast 2025-2030 ($ million)
Data Table on Middle East and Africa - Market size and forecast 2025-2030 ($ million)
Chart on Middle East and Africa - Year-over-year growth 2025-2030 (%)
Data Table on Middle East and Africa - Year-over-year growth 2025-2030 (%)
Chart on Regional Comparison - Middle East and Africa
Data Table on Regional Comparison - Middle East and Africa

12.7.1 Saudi Arabia - Market size and forecast 2025-2030

Chart on Saudi Arabia - Market size and forecast 2025-2030 ($ million)
Data Table on Saudi Arabia - Market size and forecast 2025-2030 ($ million)
Chart on Saudi Arabia - Year-over-year growth 2025-2030 (%)
Data Table on Saudi Arabia - Year-over-year growth 2025-2030 (%)

12.7.2 UAE - Market size and forecast 2025-2030

Chart on UAE - Market size and forecast 2025-2030 ($ million)
Data Table on UAE - Market size and forecast 2025-2030 ($ million)
Chart on UAE - Year-over-year growth 2025-2030 (%)
Data Table on UAE - Year-over-year growth 2025-2030 (%)

12.7.3 Turkey - Market size and forecast 2025-2030

Chart on Turkey - Market size and forecast 2025-2030 ($ million)
Data Table on Turkey - Market size and forecast 2025-2030 ($ million)
Chart on Turkey - Year-over-year growth 2025-2030 (%)
Data Table on Turkey - Year-over-year growth 2025-2030 (%)

12.7.4 South Africa - Market size and forecast 2025-2030

Chart on South Africa - Market size and forecast 2025-2030 ($ million)
Data Table on South Africa - Market size and forecast 2025-2030 ($ million)
Chart on South Africa - Year-over-year growth 2025-2030 (%)
Data Table on South Africa - Year-over-year growth 2025-2030 (%)

12.7.5 Israel - Market size and forecast 2025-2030

Chart on Israel - Market size and forecast 2025-2030 ($ million)
Data Table on Israel - Market size and forecast 2025-2030 ($ million)
Chart on Israel - Year-over-year growth 2025-2030 (%)
Data Table on Israel - Year-over-year growth 2025-2030 (%)

12.8 Market opportunity by geography

Market opportunity by geography ($ million)
Data Tables on Market opportunity by geography ($ million)

13. Drivers, Challenges, and Opportunity

13.1 Market drivers

Generative AI integration and industrialization of predictive talent lifecycle architectures
Expansion of skills-based workforce planning and strategic rise of global internal mobility ecosystems
Evolution of hybrid work optimization and strategic demand for real-time sentiment and productivity infrastructure

13.2 Market challenges

Crisis of algorithmic transparency and regulatory complexity of global AI governance
Critical scarcity of specialized analytical talent and burden of change management
Structural fragmentation of data silos and technical debt of legacy system integration

13.3 Impact of drivers and challenges

Impact of drivers and challenges in 2025 and 2030

13.4 Market opportunities

Standardization of algorithmic transparency and ethical bias mitigation frameworks
Increase in total talent orchestration and gig-internal hybridization
Expansion of Glocal analytics and cross-border compliance harmonization

14. Competitive Landscape

14.1 Overview

14.2

Overview on criticality of inputs and factors of differentiation

14.3 Landscape disruption

Overview on factors of disruption

14.4 Industry risks

Impact of key risks on business

15. Competitive Analysis

15.1 Companies profiled

Companies covered

15.2 Company ranking index

15.3 Market positioning of companies

Matrix on companies position and classification

15.4 Automatic Data Processing Inc.

Automatic Data Processing Inc. - Overview
Automatic Data Processing Inc. - Business segments
Automatic Data Processing Inc. - Key news
Automatic Data Processing Inc. - Key offerings
Automatic Data Processing Inc. - Segment focus
SWOT

15.5 Cornerstone OnDemand Inc.

Cornerstone OnDemand Inc. - Overview
Cornerstone OnDemand Inc. - Product / Service
Cornerstone OnDemand Inc. - Key news
Cornerstone OnDemand Inc. - Key offerings
SWOT

15.6 Dayforce Inc.

Dayforce Inc. - Overview
Dayforce Inc. - Product / Service
Dayforce Inc. - Key news
Dayforce Inc. - Key offerings
SWOT

15.7 Genpact Ltd.

Genpact Ltd. - Overview
Genpact Ltd. - Business segments
Genpact Ltd. - Key news
Genpact Ltd. - Key offerings
Genpact Ltd. - Segment focus
SWOT

15.8 IBM Corp.

IBM Corp. - Overview
IBM Corp. - Business segments
IBM Corp. - Key news
IBM Corp. - Key offerings
IBM Corp. - Segment focus
SWOT

15.9 Infor Inc.

Infor Inc. - Overview
Infor Inc. - Product / Service
Infor Inc. - Key news
Infor Inc. - Key offerings
SWOT

15.10 Lattice Engines Inc.

Lattice Engines Inc. - Overview
Lattice Engines Inc. - Product / Service
Lattice Engines Inc. - Key offerings
SWOT

15.11 Microsoft Corp.

Microsoft Corp. - Overview
Microsoft Corp. - Business segments
Microsoft Corp. - Key news
Microsoft Corp. - Key offerings
Microsoft Corp. - Segment focus
SWOT

15.12 Oracle Corp.

Oracle Corp. - Overview
Oracle Corp. - Business segments
Oracle Corp. - Key news
Oracle Corp. - Key offerings
Oracle Corp. - Segment focus
SWOT

15.13 SAP SE

SAP SE - Overview
SAP SE - Business segments
SAP SE - Key news
SAP SE - Key offerings
SAP SE - Segment focus
SWOT

15.14 SAS Institute Inc.

SAS Institute Inc. - Overview
SAS Institute Inc. - Product / Service
SAS Institute Inc. - Key offerings
SWOT

15.15 UKG Inc.

UKG Inc. - Overview
UKG Inc. - Product / Service
UKG Inc. - Key offerings
SWOT

15.16 Visier Inc.

Visier Inc. - Overview
Visier Inc. - Product / Service
Visier Inc. - Key offerings
SWOT

15.17 Workday Inc.

Workday Inc. - Overview
Workday Inc. - Product / Service
Workday Inc. - Key news
Workday Inc. - Key offerings
SWOT

15.18 WorkForce Software LLC

WorkForce Software LLC - Overview
WorkForce Software LLC - Product / Service
WorkForce Software LLC - Key offerings
SWOT

16. Appendix

16.1 Scope of the report

Market definition
Objectives
Notes and caveats

16.2 Inclusions and exclusions checklist

Inclusions checklist
Exclusions checklist

16.3 Currency conversion rates for US$

16.4 Research methodology

16.5 Data procurement

Information sources

16.6 Data validation

16.7 Validation techniques employed for market sizing

16.8 Data synthesis

16.9 360 degree market analysis

16.10 List of abbreviations

Research Methodology

Technavio presents a detailed picture of the market by way of study, synthesis, and summation of data from multiple sources. The analysts have presented the various facets of the market with a particular focus on identifying the key industry influencers. The data thus presented is comprehensive, reliable, and the result of extensive research, both primary and secondary.

INFORMATION SOURCES

Primary sources

  • Manufacturers and suppliers
  • Channel partners
  • Industry experts
  • Strategic decision makers

Secondary sources

  • Industry journals and periodicals
  • Government data
  • Financial reports of key industry players
  • Historical data
  • Press releases

DATA ANALYSIS

Data Synthesis

  • Collation of data
  • Estimation of key figures
  • Analysis of derived insights

Data Validation

  • Triangulation with data models
  • Reference against proprietary databases
  • Corroboration with industry experts

REPORT WRITING

Qualitative

  • Market drivers
  • Market challenges
  • Market trends
  • Five forces analysis

Quantitative

  • Market size and forecast
  • Market segmentation
  • Geographical insights
  • Competitive landscape

Interested in this report?

Get your sample now to see our research methodology and insights!

Download Now

Frequently Asked Questions

Workforce Analytics market growth will increase by USD 4121.3 million during 2026-2030.

The Workforce Analytics market is expected to grow at a CAGR of 20.2% during 2026-2030.

Workforce Analytics market is segmented by End-user (Retail, BFSI, Telecom and IT, Healthcare, Others) Application (Large enterprises, Small and medium sized enterprise) Deployment (Cloud, On-premises, Hybrid)

Anaplan Inc., Automatic Data Processing Inc., ChartHop Inc., Cornerstone OnDemand Inc., Dayforce Inc., Eightfold AI, Genpact Ltd., IBM Corp., Infor Inc., Lattice Engines Inc., Microsoft Corp., One Model Inc., Oracle Corp., SAP SE, Sapience Analytics, SAS Institute Inc., UKG Inc., Visier Inc., Workday Inc., WorkForce Software LLC are a few of the key vendors in the Workforce Analytics market.

Europe will register the highest growth rate of 32.9% among the other regions. Therefore, the Workforce Analytics market in Europe is expected to garner significant business opportunities for the vendors during the forecast period.

US, Canada, Mexico, Germany, UK, France, Italy, Spain, The Netherlands, China, Japan, India, South Korea, Australia, Indonesia, Brazil, Argentina, Chile, Saudi Arabia, UAE, Turkey, South Africa, Israel

  • Generative AI integration and industrialization of predictive talent lifecycle architectures is the driving factor this market.

The Workforce Analytics market vendors should focus on grabbing business opportunities from the End-user segment as it accounted for the largest market share in the base year.