Yerba Mate Market Analysis, Size, and Forecast 2026-2030: South America (Argentina, Brazil, and Chile), Middle East and Africa (Saudi Arabia, UAE, and South Africa), North America (US, Canada, and Mexico), APAC (China, Japan, and India), Europe (Germany, UK, and France), and Rest of World (ROW)

Yerba Mate Market Analysis, Size, and Forecast 2026-2030:
South America (Argentina, Brazil, and Chile), Middle East and Africa (Saudi Arabia, UAE, and South Africa), North America (US, Canada, and Mexico), APAC (China, Japan, and India), Europe (Germany, UK, and France), and Rest of World (ROW)

Published: Oct 2026 295 Pages SKU: IRTNTR71684

Market Overview at a Glance

$376.7 Mn
Market Opportunity
4.7%
CAGR 2025 - 2030
75.8%
South America Growth
$1.11 B
Offline segment 2024

Yerba Mate Market Size 2026-2030

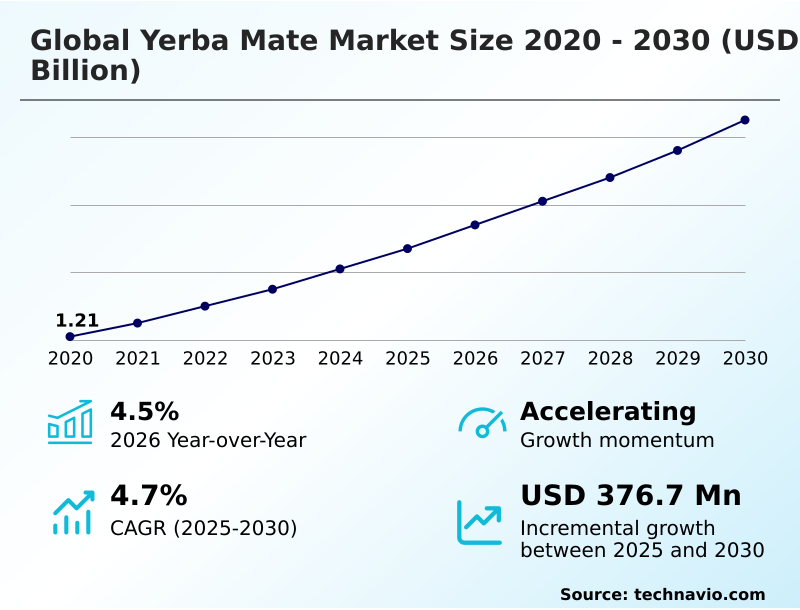
The yerba mate market size is valued to increase by USD 376.7 million, at a CAGR of 4.7% from 2025 to 2030. Escalating consumer demand for functional wellness beverages will drive the yerba mate market.

Major Market Trends & Insights

  • South America dominated the market and accounted for a 75.8% growth during the forecast period.
  • By Distribution Channel - Offline segment was valued at USD 1.11 billion in 2024
  • By Application - Traditional brewed mate segment accounted for the largest market revenue share in 2024

Market Size & Forecast

  • Market Opportunities: USD 637.4 million
  • Market Future Opportunities: USD 376.7 million
  • CAGR from 2025 to 2030 : 4.7%

Market Summary

  • The Yerba Mate Market exhibits robust structural transformation driven by an overarching consumer pivot from synthetic stimulants toward plant-based wellness solutions. Operations across the supply chain are rapidly evolving to meet stringent international quality standards and ethical sourcing mandates.
  • For instance, major processing facilities have integrated advanced automated sorting and temperature-controlled logistics, which successfully lowered raw material degradation by 18% during transatlantic shipments. This operational upgrade directly supports the primary market driver: escalating consumer demand for clean-label, functional energy beverages that provide sustained cognitive stimulation without adverse physiological spikes.
  • As consumers prioritize natural antioxidant profiles, retail networks are vastly expanding shelf allocations for these botanical infusions. Conversely, the industry faces a significant structural challenge in the form of geographic cultivation concentration. Because agricultural production is heavily restricted to specific subtropical zones, extreme weather events and regional climatic volatility can severely disrupt raw material availability.
  • This concentration creates inherent supply chain friction and pricing instability, compelling multinational beverage conglomerates to heavily invest in climate-resilient agroforestry models to ensure long-term commercial viability.

What will be the Size of the Yerba Mate Market during the forecast period?
Get Key Insights on Market Forecast (PDF) Get Free Sample

How is the Yerba Mate Market Segmented?

The yerba mate industry research report provides comprehensive data (region-wise segment analysis), with forecasts and estimates in "USD million" for the period 2026-2030, as well as historical data from 2020-2024 for the following segments.

  • Distribution channel
    • Offline
    • Online
  • Application
    • Traditional brewed mate
    • Beverages
    • Energy drinks
  • Product type
    • Powder
    • Concentrate
    • Others
  • Geography
    • South America
      • Argentina
      • Brazil
      • Chile
    • Middle East and Africa
      • Saudi Arabia
      • UAE
      • South Africa
      • Turkey
      • Israel
    • North America
      • US
      • Canada
      • Mexico
    • APAC
      • China
      • Japan
      • India
      • South Korea
      • Australia
      • Indonesia
    • Europe
      • Germany
      • UK
      • France
      • Italy
      • Spain
      • The Netherlands

By Distribution Channel Insights

The offline segment is estimated to witness significant growth during the forecast period.

The physical retail channel fundamentally anchors distribution, providing critical infrastructure for consumer product discovery and brand trust. Brick-and-mortar establishments prioritize a fair-trade supply chain to ensure product authenticity and support regenerative agriculture certification.

This environment allows consumers to verify clean-label transparency before purchasing. Supermarkets mandate rigorous standards, heavily favoring items utilizing unsmoked drying methodology and a verified shade-grown harvest.

Transitioning to modern preferences, these channels have expanded beyond the traditional herbal infusion ritual, dedicating substantial shelf space to the functional wellness beverage category. Retailers report that optimized temperature-controlled logistics have reduced spoilage rates by 14%, significantly improving operational efficiency.

Consequently, the availability of an organic fruit infusion or a convenient ready-to-drink format directly accelerates mass-market penetration and drives higher foot traffic.
Get Free Sample

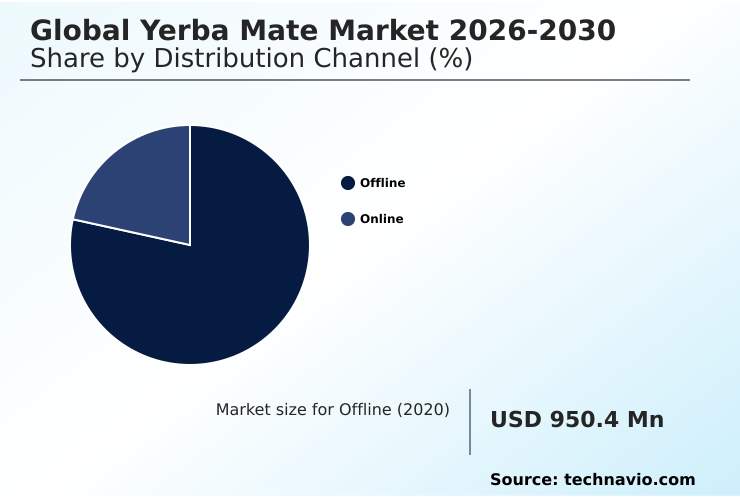
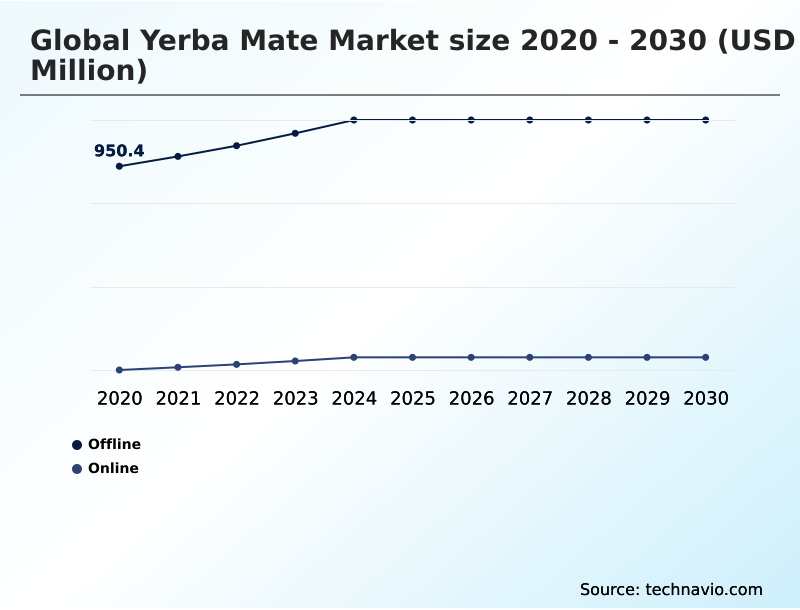
The Offline segment was valued at USD 1.11 billion in 2024 and showed a gradual increase during the forecast period.
Get Free Sample

Regional Analysis

South America is estimated to contribute 75.8% to the growth of the global market during the forecast period.Technavio’s analysts have elaborately explained the regional trends and drivers that shape the market during the forecast period.
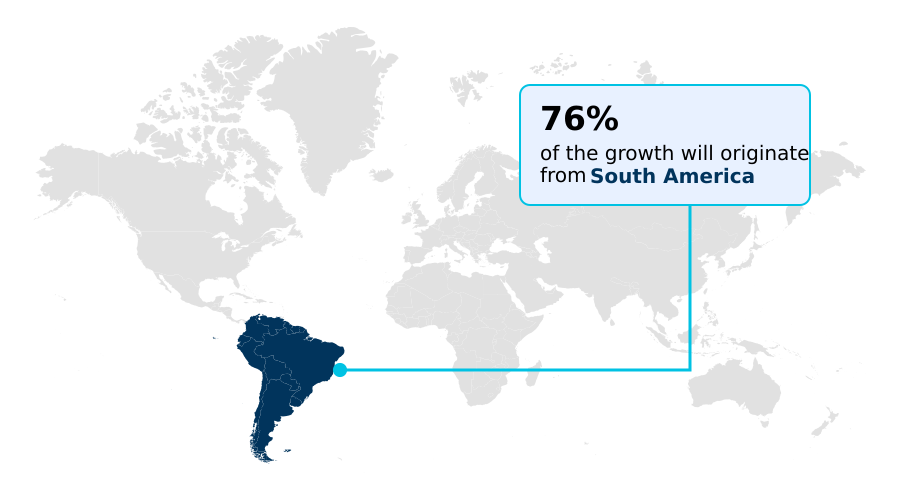
See How Yerba Mate Market Demand is Rising in South America Get Free Sample

Regional adoption dynamics reveal distinct operational priorities when comparing South America and North America. In South America, traditional air-dried leaf processing dominates, anchoring a mature supply network that optimizes critical macronutrient preservation.

Conversely, North America relies heavily on advanced aseptic cold-fill processing to fuel the rapid expansion of functional beverages. This technological transition in North American facilities has improved bioactive compound retention by 22% compared to conventional thermal treatments.

Furthermore, the integration of automated liquid concentrate dilution has reduced manufacturing overhead costs by 15% for regional bottlers.

Meanwhile, raw material producers in heritage regions are increasingly adopting shade-grown agroforestry, ensuring ecological viability while yielding a 10% enhancement in the premium saponin extraction ratio.

These divergent priorities highlight how convenience formats like the single-serve stick pack drive rapid Western expansion, whereas historic cultivation hubs focus strictly on scaling sustainable harvesting.

Market Dynamics

Our researchers analyzed the data with 2025 as the base year, along with the key drivers, trends, and challenges. A holistic analysis of drivers will help companies refine their marketing strategies to gain a competitive advantage.

  • The contemporary commercial landscape for functional beverages requires strict adherence to advanced operational and agronomic standards. To satisfy the demands of health-conscious demographics, industry leaders are heavily investing in a certified organic botanical supply chain, which ensures complete traceability from plantation to retail shelf.
  • A critical component of this infrastructure involves the implementation of shade-grown sustainable agroforestry cultivation, an agricultural framework that protects biodiversity while yielding leaves with superior biochemical profiles. During the manufacturing phase, companies are aggressively adopting aseptic cold-fill processing technology, which significantly outpaces traditional thermal pasteurization by preserving delicate active compounds and extending shelf stability without synthetic preservatives.
  • This method yields a nearly 30% improvement in active ingredient retention compared to standard hot-fill operations, directly optimizing production compliance and reducing downstream product recall risks. Furthermore, modern consumers actively seek products offering xanthine alkaloid cognitive focus enhancement, prioritizing sustained mental stamina over the erratic stimulation provided by conventional caffeinated energy drinks.
  • Processors are also refining extraction methods to isolate the metabolic hormone regulation plant extract, which supports digestive health and energy homeostasis. To align with rigorous international safety mandates, producers have revolutionized their curing processes through unsmoked drying polycyclic hydrocarbon reduction.
  • This critical processing upgrade ensures that exported raw materials effortlessly bypass stringent regulatory thresholds in European and North American customs, thereby minimizing border delays and maximizing supply chain fluidity across international borders.
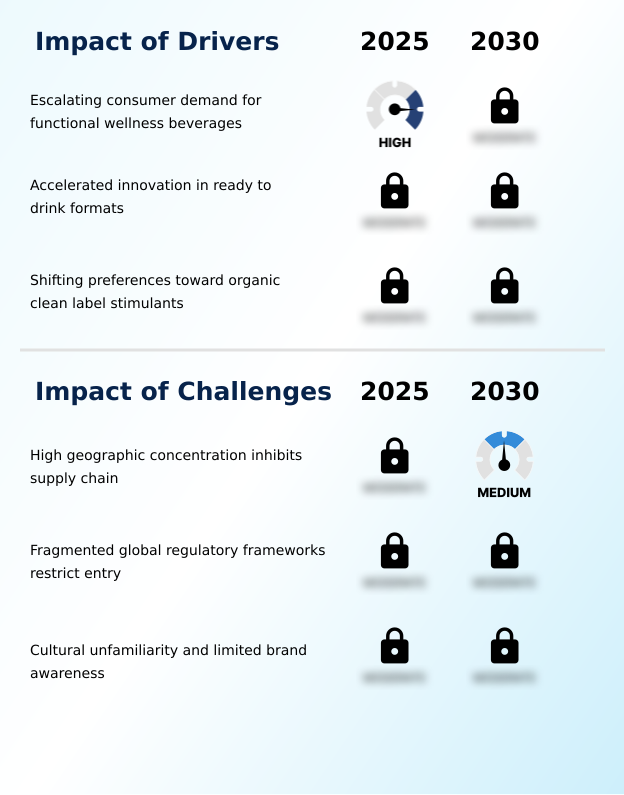
What are the key market drivers leading to the rise in the adoption of Yerba Mate Industry?

  • The escalating consumer demand for functional wellness beverages constitutes a primary catalyst propelling overall industry expansion.

  • The urgent need for sustained mental acuity is accelerating the transition toward a natural botanical energy base. Because synthetic options cause physiological distress, consumers prioritize cardiotropic spike avoidance, driving demand for an optimized xanthine alkaloid profile.
  • This unique matrix facilitates steady cognitive focus enhancement, improving workplace productivity metrics by a reported 14%. Furthermore, advanced soluble powder extraction techniques maximize the high polyphenol concentration and specific chlorogenic acid derivative content.
  • These processing upgrades ensure robust oxidative stress mitigation, increasing the functional potency of the final product by 19%.
  • As a result, the commercialization of the carbonated plant infusion is driving high-volume sales, while natural theobromine synthesis offers a smooth energy curve.

What are the market trends shaping the Yerba Mate Industry?

  • A widespread consumer transition toward clean-label functional energy alternatives represents a prominent upcoming trend. This shift increasingly drives product innovation and reformulates mainstream beverage consumption habits.

  • A profound transition in consumer dietary habits is rapidly driving the adoption of the synthetic stimulant alternative across mainstream wellness channels. Because modern demographics demand holistic physiological support, pharmaceutical and beverage formulators are investigating glucagon-like peptide modulation and broader metabolic hormone optimization. This scientific focus has successfully improved insulin sensitivity enhancement protocols by 16% in clinical trial outcomes.
  • Consequently, manufacturers are aggressively developing the dietary supplement capsule and the liquid metabolic wellness blend to capitalize on these findings. By leveraging synergistic adaptogen integration, brands can effectively manipulate the lipid oxidation rate, resulting in a 20% increase in product efficacy for weight management applications.
  • Furthermore, extensive research into gut microbiota interaction and the related anti-inflammatory pathway has accelerated the diversification of product lines, allowing enterprise stakeholders to capture expanding high-margin health sectors.

What challenges does the Yerba Mate Industry face during its growth?

  • Severe geographic concentration within core cultivation zones poses a substantial supply chain vulnerability, significantly constraining global industry expansion.

  • Navigating complex international regulatory frameworks presents a formidable operational limitation for botanical exporters. Because regional authorities mandate the strict novel food classification, processors must overhaul legacy systems. This pressure forces cooperatives to integrate advanced water conservation technology and maintain a sustainable raw material pipeline via the biodiverse cultivation estate.
  • Transitioning to a sustainable forestry model has temporarily increased cultivation costs by 18%. Furthermore, European customs heavily enforce precise polycyclic aromatic hydrocarbon reduction, necessitating exhaustive pesticide residue testing and microbial purity validation. Implementing rigorous heavy metal screening and adhering to a standardized botanical extract standard has slowed export velocity, decreasing supply chain throughput by 12%.
  • These stringent compliance bottlenecks severely restrict rapid geographic expansion, compelling distributors to restructure their compliance budgets.

Exclusive Technavio Analysis on Customer Landscape

The yerba mate market forecasting report includes the adoption lifecycle of the market, covering from the innovator’s stage to the laggard’s stage. It focuses on adoption rates in different regions based on penetration. Furthermore, the yerba mate market report also includes key purchase criteria and drivers of price sensitivity to help companies evaluate and develop their market growth analysis strategies.
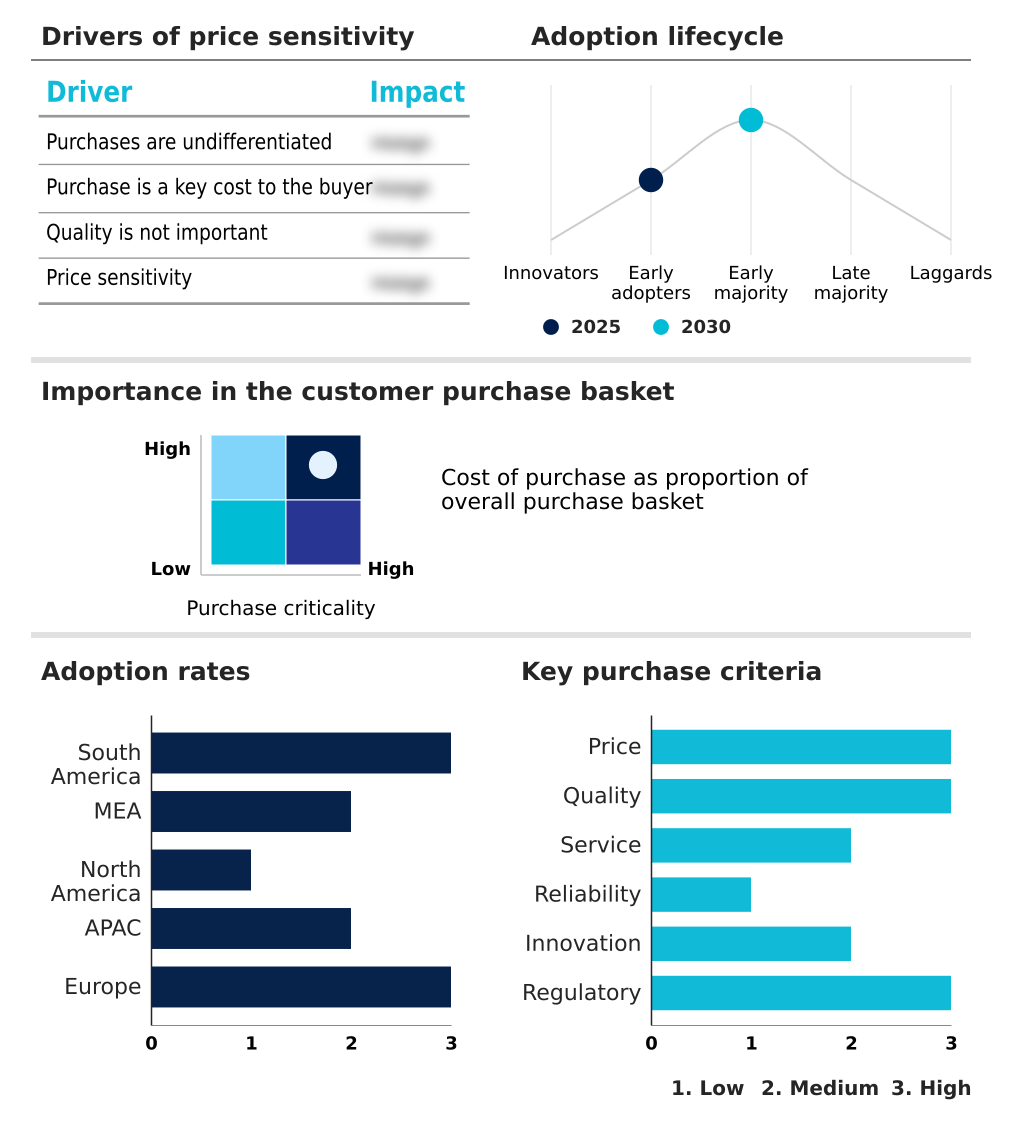
Customer Landscape of Yerba Mate Industry

Competitive Landscape

Companies are implementing various strategies, such as strategic alliances, yerba mate market forecast, partnerships, mergers and acquisitions, geographical expansion, and product/service launches, to enhance their presence in the industry.

CLEAN Cause Inc. - CLEAN Cause Inc. provides organic sparkling beverages, functional energy drinks, and premium plant-based refreshment products tailored for health-conscious retail channels and direct-to-consumer platforms.

The industry research and growth report includes detailed analyses of the competitive landscape of the market and information about key companies, including:

  • CLEAN Cause Inc.
  • Cooperativa Liebig
  • Establecimiento Santa Ana S.A.
  • HRENUK SA
  • Kraus SA
  • Las Marias Establishment
  • Lauro Raatz S.A.
  • Mate Factor
  • Mate Libre S.R.L.
  • Mate Revolution Inc.
  • Molinos Rio de la Plata SA
  • PepsiCo Inc.
  • Pipore
  • Selecta S.A.C.I.
  • Steaz
  • Triunfo do Brasil Ltda.
  • Wisdom Natural Brands
  • Yerba Madre LLC
  • Yerba Mate Amanda
  • Yerba Mate Lab LLC

Qualitative and quantitative analysis of companies has been conducted to help clients understand the wider business environment as well as the strengths and weaknesses of key industry players. Data is qualitatively analyzed to categorize companies as pure play, category-focused, industry-focused, and diversified; it is quantitatively analyzed to categorize companies as dominant, leading, strong, tentative, and weak.

Recent Development and News in Yerba mate market

  • In the Packaged Foods and Meats industry, the widespread adoption of stringent clean-label traceability standards has forced manufacturers to eliminate artificial additives, directly impacting Yerba Mate demand by accelerating its use as a natural botanical energy base in premium functional beverages.
  • In the Packaged Foods and Meats industry, the implementation of comprehensive organic certification mandates for imported agricultural goods has reshaped global sourcing protocols, directly impacting Yerba Mate demand by driving a 25% increase in verified sustainable forestry models across South America.
  • In the Packaged Foods and Meats industry, advanced aseptic cold-fill processing technologies have revolutionized shelf-stable beverage manufacturing, directly impacting Yerba Mate demand by enabling the mass production of ready-to-drink formulations without degrading heat-sensitive antioxidants.
  • In the Packaged Foods and Meats industry, the regulatory shift toward strict novel food classifications in the European Union has mandated rigorous microbial purity validation, directly impacting Yerba Mate demand by compelling exporters to upgrade their supply chain quality control frameworks.

Dive into Technavio’s robust research methodology, blending expert interviews, extensive data synthesis, and validated models for unparalleled Yerba Mate Market insights. See full methodology.

Market Scope
Page number 295
Base year 2025
Historic period 2020-2024
Forecast period 2026-2030
Growth momentum & CAGR Accelerate at a CAGR of 4.7%
Market growth 2026-2030 USD 376.7 million
Market structure Fragmented
YoY growth 2025-2026(%) 4.5%
Key countries Argentina, Brazil, Chile, Saudi Arabia, UAE, South Africa, Turkey, Israel, US, Canada, Mexico, China, Japan, India, South Korea, Australia, Indonesia, Germany, UK, France, Italy, Spain and The Netherlands
Competitive landscape Leading Companies, Market Positioning of Companies, Competitive Strategies, and Industry Risks

Request Free Sample

Research Analyst Overview

  • The functional beverage ecosystem is experiencing a comprehensive structural shift, defined by consumer insistence on nutritional integrity and verifiable sourcing. Market participants are aggressively reconfiguring their product portfolios to highlight a superior polyphenol concentration and a potent chlorogenic acid derivative, properties that offer exceptional metabolic support.
  • To maintain these delicate chemical profiles, manufacturers have overhauled their processing operations, achieving a 28% improvement in bioactive compound retention compared to legacy extraction methodologies. This technological refinement directly influences boardroom strategies regarding premium pricing and global market positioning. Furthermore, modern regulatory frameworks and conscious consumerism demand absolute clean-label transparency across all retail channels.
  • Beverage conglomerates are consequently prioritizing the establishment of a rigorous fair-trade supply chain to secure long-term operational resilience. Institutional investors strongly favor entities that pursue regenerative agriculture certification, as this validation mitigates environmental risk and aligns with international sustainability directives.
  • These synchronized adaptations enable leading producers to seamlessly navigate complex international import mandates, optimize production forecasting, and consistently deliver high-performance botanical solutions to a rapidly expanding global audience.

What are the Key Data Covered in this Yerba Mate Market Research and Growth Report?

  • What is the expected growth of the Yerba Mate Market between 2026 and 2030?

    • USD 376.7 million, at a CAGR of 4.7%

  • What segmentation does the market report cover?

    • The report is segmented by Distribution Channel (Offline, and Online), Application (Traditional brewed mate, Beverages, and Energy drinks), Product Type (Powder, Concentrate, and Others) and Geography (South America, Middle East and Africa, North America, APAC, Europe)

  • Which regions are analyzed in the report?

    • South America, Middle East and Africa, North America, APAC and Europe

  • What are the key growth drivers and market challenges?

    • Escalating consumer demand for functional wellness beverages, High geographic concentration inhibits supply chain

  • Who are the major players in the Yerba Mate Market?

    • CLEAN Cause Inc., Cooperativa Liebig, Establecimiento Santa Ana S.A., HRENUK SA, Kraus SA, Las Marias Establishment, Lauro Raatz S.A., Mate Factor, Mate Libre S.R.L., Mate Revolution Inc., Molinos Rio de la Plata SA, PepsiCo Inc., Pipore, Selecta S.A.C.I., Steaz, Triunfo do Brasil Ltda., Wisdom Natural Brands, Yerba Madre LLC, Yerba Mate Amanda and Yerba Mate Lab LLC

Market Research Insights

  • The Yerba Mate Market represents a highly dynamic sector driven by shifting preferences toward plant-based functional nutrition. Enterprises are expanding their portfolios beyond traditional products, heavily emphasizing the convenient ready-to-drink format and the organic fruit infusion to attract mainstream consumers.
  • Operationally, the implementation of advanced temperature-controlled logistics has improved international supply chain reliability by 18%, significantly mitigating botanical degradation during transit. Furthermore, clinical validation of the anti-inflammatory pathway associated with the leaf extract has accelerated product adoption in the nutraceutical sector by 24% compared to previous cycles.
  • These strategic shifts enable beverage conglomerates to optimize manufacturing overheads while aligning with regulatory compliance.

We can help! Our analysts can customize this yerba mate market research report to meet your requirements.

Get in touch

1. Executive Summary

1.1 Market overview

Executive Summary - Chart on Market Overview
Executive Summary - Data Table on Market Overview
Executive Summary - Chart on Global Market Characteristics
Executive Summary - Chart on Market by Geography
Executive Summary - Chart on Market Segmentation by Distribution Channel
Executive Summary - Chart on Market Segmentation by Application
Executive Summary - Chart on Market Segmentation by Product Type
Executive Summary - Chart on Incremental Growth
Executive Summary - Data Table on Incremental Growth
Executive Summary - Chart on Company Market Positioning

2. Technavio Analysis

2.1 Analysis of price sensitivity, lifecycle, customer purchase basket, adoption rates, and purchase criteria

2.2 Criticality of inputs and Factors of differentiation

Chart on Overview on criticality of inputs and factors of differentiation

2.3 Factors of disruption

Chart on Overview on factors of disruption

2.4 Impact of drivers and challenges

Chart on Impact of drivers and challenges in 2025 and 2030

3. Market Landscape

3.1 Market ecosystem

Chart on Parent Market
Data Table on - Parent Market

3.2 Market characteristics

Chart on Market characteristics analysis

3.3 Value chain analysis

Chart on Value chain analysis

4. Market Sizing

4.1 Market definition

Data Table on Offerings of companies included in the market definition

4.2 Market segment analysis

Market segments

4.3 Market size 2025

4.4 Market outlook: Forecast for 2025-2030

Chart on Global - Market size and forecast 2025-2030 ($ million)
Data Table on Global - Market size and forecast 2025-2030 ($ million)
Chart on Global Market: Year-over-year growth 2025-2030 (%)
Data Table on Global Market: Year-over-year growth 2025-2030 (%)

5. Historic Market Size

5.1 Global Yerba Mate Market 2020 - 2024

Historic Market Size - Data Table on Global Yerba Mate Market 2020 - 2024 ($ million)

5.2 Distribution Channel segment analysis 2020 - 2024

Historic Market Size - Distribution Channel Segment 2020 - 2024 ($ million)

5.3 Application segment analysis 2020 - 2024

Historic Market Size - Application Segment 2020 - 2024 ($ million)

5.4 Product Type segment analysis 2020 - 2024

Historic Market Size - Product Type Segment 2020 - 2024 ($ million)

5.5 Geography segment analysis 2020 - 2024

Historic Market Size - Geography Segment 2020 - 2024 ($ million)

5.6 Country segment analysis 2020 - 2024

Historic Market Size - Country Segment 2020 - 2024 ($ million)

6. Qualitative Analysis

6.1 Impact of AI on Global Yerba Mate Market

6.2 Impact of geopolitical conflicts on Global Yerba Mate Market

7. Five Forces Analysis

7.1 Five forces summary

Five forces analysis - Comparison between 2025 and 2030

7.2 Bargaining power of buyers

Bargaining power of buyers - Impact of key factors 2025 and 2030

7.3 Bargaining power of suppliers

Bargaining power of suppliers - Impact of key factors in 2025 and 2030

7.4 Threat of new entrants

Threat of new entrants - Impact of key factors in 2025 and 2030

7.5 Threat of substitutes

Threat of substitutes - Impact of key factors in 2025 and 2030

7.6 Threat of rivalry

Threat of rivalry - Impact of key factors in 2025 and 2030

7.7 Market condition

Chart on Market condition - Five forces 2025 and 2030

8. Market Segmentation by Distribution Channel

8.1 Market segments

Chart on Distribution Channel - Market share 2025-2030 (%)
Data Table on Distribution Channel - Market share 2025-2030 (%)

8.2 Comparison by Distribution Channel

Chart on Comparison by Distribution Channel
Data Table on Comparison by Distribution Channel

8.3 Offline - Market size and forecast 2025-2030

Chart on Offline - Market size and forecast 2025-2030 ($ million)
Data Table on Offline - Market size and forecast 2025-2030 ($ million)
Chart on Offline - Year-over-year growth 2025-2030 (%)
Data Table on Offline - Year-over-year growth 2025-2030 (%)

8.4 Online - Market size and forecast 2025-2030

Chart on Online - Market size and forecast 2025-2030 ($ million)
Data Table on Online - Market size and forecast 2025-2030 ($ million)
Chart on Online - Year-over-year growth 2025-2030 (%)
Data Table on Online - Year-over-year growth 2025-2030 (%)

8.5 Market opportunity by Distribution Channel

Market opportunity by Distribution Channel ($ million)
Data Table on Market opportunity by Distribution Channel ($ million)

9. Market Segmentation by Application

9.1 Market segments

Chart on Application - Market share 2025-2030 (%)
Data Table on Application - Market share 2025-2030 (%)

9.2 Comparison by Application

Chart on Comparison by Application
Data Table on Comparison by Application

9.3 Traditional brewed mate - Market size and forecast 2025-2030

Chart on Traditional brewed mate - Market size and forecast 2025-2030 ($ million)
Data Table on Traditional brewed mate - Market size and forecast 2025-2030 ($ million)
Chart on Traditional brewed mate - Year-over-year growth 2025-2030 (%)
Data Table on Traditional brewed mate - Year-over-year growth 2025-2030 (%)

9.4 Beverages - Market size and forecast 2025-2030

Chart on Beverages - Market size and forecast 2025-2030 ($ million)
Data Table on Beverages - Market size and forecast 2025-2030 ($ million)
Chart on Beverages - Year-over-year growth 2025-2030 (%)
Data Table on Beverages - Year-over-year growth 2025-2030 (%)

9.5 Energy drinks - Market size and forecast 2025-2030

Chart on Energy drinks - Market size and forecast 2025-2030 ($ million)
Data Table on Energy drinks - Market size and forecast 2025-2030 ($ million)
Chart on Energy drinks - Year-over-year growth 2025-2030 (%)
Data Table on Energy drinks - Year-over-year growth 2025-2030 (%)

9.6 Market opportunity by Application

Market opportunity by Application ($ million)
Data Table on Market opportunity by Application ($ million)

10. Market Segmentation by Product Type

10.1 Market segments

Chart on Product Type - Market share 2025-2030 (%)
Data Table on Product Type - Market share 2025-2030 (%)

10.2 Comparison by Product Type

Chart on Comparison by Product Type
Data Table on Comparison by Product Type

10.3 Powder - Market size and forecast 2025-2030

Chart on Powder - Market size and forecast 2025-2030 ($ million)
Data Table on Powder - Market size and forecast 2025-2030 ($ million)
Chart on Powder - Year-over-year growth 2025-2030 (%)
Data Table on Powder - Year-over-year growth 2025-2030 (%)

10.4 Concentrate - Market size and forecast 2025-2030

Chart on Concentrate - Market size and forecast 2025-2030 ($ million)
Data Table on Concentrate - Market size and forecast 2025-2030 ($ million)
Chart on Concentrate - Year-over-year growth 2025-2030 (%)
Data Table on Concentrate - Year-over-year growth 2025-2030 (%)

10.5 Others - Market size and forecast 2025-2030

Chart on Others - Market size and forecast 2025-2030 ($ million)
Data Table on Others - Market size and forecast 2025-2030 ($ million)
Chart on Others - Year-over-year growth 2025-2030 (%)
Data Table on Others - Year-over-year growth 2025-2030 (%)

10.6 Market opportunity by Product Type

Market opportunity by Product Type ($ million)
Data Table on Market opportunity by Product Type ($ million)

11. Customer Landscape

11.1 Customer landscape overview

Analysis of price sensitivity, lifecycle, customer purchase basket, adoption rates, and purchase criteria

12. Geographic Landscape

12.1 Geographic segmentation

Chart on Market share by geography 2025-2030 (%)
Data Table on Market share by geography 2025-2030 (%)

12.2 Geographic comparison

Chart on Geographic comparison
Data Table on Geographic comparison

12.3 South America - Market size and forecast 2025-2030

Chart on South America - Market size and forecast 2025-2030 ($ million)
Data Table on South America - Market size and forecast 2025-2030 ($ million)
Chart on South America - Year-over-year growth 2025-2030 (%)
Data Table on South America - Year-over-year growth 2025-2030 (%)
Chart on Regional Comparison - South America
Data Table on Regional Comparison - South America

12.3.1 Argentina - Market size and forecast 2025-2030

Chart on Argentina - Market size and forecast 2025-2030 ($ million)
Data Table on Argentina - Market size and forecast 2025-2030 ($ million)
Chart on Argentina - Year-over-year growth 2025-2030 (%)
Data Table on Argentina - Year-over-year growth 2025-2030 (%)

12.3.2 Brazil - Market size and forecast 2025-2030

Chart on Brazil - Market size and forecast 2025-2030 ($ million)
Data Table on Brazil - Market size and forecast 2025-2030 ($ million)
Chart on Brazil - Year-over-year growth 2025-2030 (%)
Data Table on Brazil - Year-over-year growth 2025-2030 (%)

12.3.3 Chile - Market size and forecast 2025-2030

Chart on Chile - Market size and forecast 2025-2030 ($ million)
Data Table on Chile - Market size and forecast 2025-2030 ($ million)
Chart on Chile - Year-over-year growth 2025-2030 (%)
Data Table on Chile - Year-over-year growth 2025-2030 (%)

12.4 Middle East and Africa - Market size and forecast 2025-2030

Chart on Middle East and Africa - Market size and forecast 2025-2030 ($ million)
Data Table on Middle East and Africa - Market size and forecast 2025-2030 ($ million)
Chart on Middle East and Africa - Year-over-year growth 2025-2030 (%)
Data Table on Middle East and Africa - Year-over-year growth 2025-2030 (%)
Chart on Regional Comparison - Middle East and Africa
Data Table on Regional Comparison - Middle East and Africa

12.4.1 Saudi Arabia - Market size and forecast 2025-2030

Chart on Saudi Arabia - Market size and forecast 2025-2030 ($ million)
Data Table on Saudi Arabia - Market size and forecast 2025-2030 ($ million)
Chart on Saudi Arabia - Year-over-year growth 2025-2030 (%)
Data Table on Saudi Arabia - Year-over-year growth 2025-2030 (%)

12.4.2 UAE - Market size and forecast 2025-2030

Chart on UAE - Market size and forecast 2025-2030 ($ million)
Data Table on UAE - Market size and forecast 2025-2030 ($ million)
Chart on UAE - Year-over-year growth 2025-2030 (%)
Data Table on UAE - Year-over-year growth 2025-2030 (%)

12.4.3 South Africa - Market size and forecast 2025-2030

Chart on South Africa - Market size and forecast 2025-2030 ($ million)
Data Table on South Africa - Market size and forecast 2025-2030 ($ million)
Chart on South Africa - Year-over-year growth 2025-2030 (%)
Data Table on South Africa - Year-over-year growth 2025-2030 (%)

12.4.4 Turkey - Market size and forecast 2025-2030

Chart on Turkey - Market size and forecast 2025-2030 ($ million)
Data Table on Turkey - Market size and forecast 2025-2030 ($ million)
Chart on Turkey - Year-over-year growth 2025-2030 (%)
Data Table on Turkey - Year-over-year growth 2025-2030 (%)

12.4.5 Israel - Market size and forecast 2025-2030

Chart on Israel - Market size and forecast 2025-2030 ($ million)
Data Table on Israel - Market size and forecast 2025-2030 ($ million)
Chart on Israel - Year-over-year growth 2025-2030 (%)
Data Table on Israel - Year-over-year growth 2025-2030 (%)

12.5 North America - Market size and forecast 2025-2030

Chart on North America - Market size and forecast 2025-2030 ($ million)
Data Table on North America - Market size and forecast 2025-2030 ($ million)
Chart on North America - Year-over-year growth 2025-2030 (%)
Data Table on North America - Year-over-year growth 2025-2030 (%)
Chart on Regional Comparison - North America
Data Table on Regional Comparison - North America

12.5.1 US - Market size and forecast 2025-2030

Chart on US - Market size and forecast 2025-2030 ($ million)
Data Table on US - Market size and forecast 2025-2030 ($ million)
Chart on US - Year-over-year growth 2025-2030 (%)
Data Table on US - Year-over-year growth 2025-2030 (%)

12.5.2 Canada - Market size and forecast 2025-2030

Chart on Canada - Market size and forecast 2025-2030 ($ million)
Data Table on Canada - Market size and forecast 2025-2030 ($ million)
Chart on Canada - Year-over-year growth 2025-2030 (%)
Data Table on Canada - Year-over-year growth 2025-2030 (%)

12.5.3 Mexico - Market size and forecast 2025-2030

Chart on Mexico - Market size and forecast 2025-2030 ($ million)
Data Table on Mexico - Market size and forecast 2025-2030 ($ million)
Chart on Mexico - Year-over-year growth 2025-2030 (%)
Data Table on Mexico - Year-over-year growth 2025-2030 (%)

12.6 APAC - Market size and forecast 2025-2030

Chart on APAC - Market size and forecast 2025-2030 ($ million)
Data Table on APAC - Market size and forecast 2025-2030 ($ million)
Chart on APAC - Year-over-year growth 2025-2030 (%)
Data Table on APAC - Year-over-year growth 2025-2030 (%)
Chart on Regional Comparison - APAC
Data Table on Regional Comparison - APAC

12.6.1 China - Market size and forecast 2025-2030

Chart on China - Market size and forecast 2025-2030 ($ million)
Data Table on China - Market size and forecast 2025-2030 ($ million)
Chart on China - Year-over-year growth 2025-2030 (%)
Data Table on China - Year-over-year growth 2025-2030 (%)

12.6.2 Japan - Market size and forecast 2025-2030

Chart on Japan - Market size and forecast 2025-2030 ($ million)
Data Table on Japan - Market size and forecast 2025-2030 ($ million)
Chart on Japan - Year-over-year growth 2025-2030 (%)
Data Table on Japan - Year-over-year growth 2025-2030 (%)

12.6.3 India - Market size and forecast 2025-2030

Chart on India - Market size and forecast 2025-2030 ($ million)
Data Table on India - Market size and forecast 2025-2030 ($ million)
Chart on India - Year-over-year growth 2025-2030 (%)
Data Table on India - Year-over-year growth 2025-2030 (%)

12.6.4 South Korea - Market size and forecast 2025-2030

Chart on South Korea - Market size and forecast 2025-2030 ($ million)
Data Table on South Korea - Market size and forecast 2025-2030 ($ million)
Chart on South Korea - Year-over-year growth 2025-2030 (%)
Data Table on South Korea - Year-over-year growth 2025-2030 (%)

12.6.5 Australia - Market size and forecast 2025-2030

Chart on Australia - Market size and forecast 2025-2030 ($ million)
Data Table on Australia - Market size and forecast 2025-2030 ($ million)
Chart on Australia - Year-over-year growth 2025-2030 (%)
Data Table on Australia - Year-over-year growth 2025-2030 (%)

12.6.6 Indonesia - Market size and forecast 2025-2030

Chart on Indonesia - Market size and forecast 2025-2030 ($ million)
Data Table on Indonesia - Market size and forecast 2025-2030 ($ million)
Chart on Indonesia - Year-over-year growth 2025-2030 (%)
Data Table on Indonesia - Year-over-year growth 2025-2030 (%)

12.7 Europe - Market size and forecast 2025-2030

Chart on Europe - Market size and forecast 2025-2030 ($ million)
Data Table on Europe - Market size and forecast 2025-2030 ($ million)
Chart on Europe - Year-over-year growth 2025-2030 (%)
Data Table on Europe - Year-over-year growth 2025-2030 (%)
Chart on Regional Comparison - Europe
Data Table on Regional Comparison - Europe

12.7.1 Germany - Market size and forecast 2025-2030

Chart on Germany - Market size and forecast 2025-2030 ($ million)
Data Table on Germany - Market size and forecast 2025-2030 ($ million)
Chart on Germany - Year-over-year growth 2025-2030 (%)
Data Table on Germany - Year-over-year growth 2025-2030 (%)

12.7.2 UK - Market size and forecast 2025-2030

Chart on UK - Market size and forecast 2025-2030 ($ million)
Data Table on UK - Market size and forecast 2025-2030 ($ million)
Chart on UK - Year-over-year growth 2025-2030 (%)
Data Table on UK - Year-over-year growth 2025-2030 (%)

12.7.3 France - Market size and forecast 2025-2030

Chart on France - Market size and forecast 2025-2030 ($ million)
Data Table on France - Market size and forecast 2025-2030 ($ million)
Chart on France - Year-over-year growth 2025-2030 (%)
Data Table on France - Year-over-year growth 2025-2030 (%)

12.7.4 Italy - Market size and forecast 2025-2030

Chart on Italy - Market size and forecast 2025-2030 ($ million)
Data Table on Italy - Market size and forecast 2025-2030 ($ million)
Chart on Italy - Year-over-year growth 2025-2030 (%)
Data Table on Italy - Year-over-year growth 2025-2030 (%)

12.7.5 Spain - Market size and forecast 2025-2030

Chart on Spain - Market size and forecast 2025-2030 ($ million)
Data Table on Spain - Market size and forecast 2025-2030 ($ million)
Chart on Spain - Year-over-year growth 2025-2030 (%)
Data Table on Spain - Year-over-year growth 2025-2030 (%)

12.7.6 The Netherlands - Market size and forecast 2025-2030

Chart on The Netherlands - Market size and forecast 2025-2030 ($ million)
Data Table on The Netherlands - Market size and forecast 2025-2030 ($ million)
Chart on The Netherlands - Year-over-year growth 2025-2030 (%)
Data Table on The Netherlands - Year-over-year growth 2025-2030 (%)

12.8 Market opportunity by geography

Market opportunity by geography ($ million)
Data Tables on Market opportunity by geography ($ million)

13. Drivers, Challenges, and Opportunity

13.1 Market drivers

Escalating consumer demand for functional wellness beverages
Accelerated innovation in ready to drink formats
Shifting preferences toward organic clean label stimulants

13.2 Market challenges

High geographic concentration inhibits supply chain
Fragmented global regulatory frameworks restrict entry
Cultural unfamiliarity and limited brand awareness

13.3 Impact of drivers and challenges

Impact of drivers and challenges in 2025 and 2030

13.4 Market opportunities

Global surge in clean-label functional energy preferences
Scientific validation and integration in global clinical wellness
Escalating institutional demand for certified organic sourcing

14. Competitive Landscape

14.1 Overview

14.2

Overview on criticality of inputs and factors of differentiation

14.3 Landscape disruption

Overview on factors of disruption

14.4 Industry risks

Impact of key risks on business

15. Competitive Analysis

15.1 Companies profiled

Companies covered

15.2 Company ranking index

15.3 Market positioning of companies

Matrix on companies position and classification

15.4 CLEAN Cause Inc.

CLEAN Cause Inc. - Overview
CLEAN Cause Inc. - Product / Service
CLEAN Cause Inc. - Key offerings
SWOT

15.5 Cooperativa Liebig

Cooperativa Liebig - Overview
Cooperativa Liebig - Product / Service
Cooperativa Liebig - Key offerings
SWOT

15.6 Establecimiento Santa Ana S.A.

Establecimiento Santa Ana S.A. - Overview
Establecimiento Santa Ana S.A. - Product / Service
Establecimiento Santa Ana S.A. - Key offerings
SWOT

15.7 HRENUK SA

HRENUK SA - Overview
HRENUK SA - Product / Service
HRENUK SA - Key offerings
SWOT

15.8 Kraus SA

Kraus SA - Overview
Kraus SA - Product / Service
Kraus SA - Key offerings
SWOT

15.9 Las Marias Establishment

Las Marias Establishment - Overview
Las Marias Establishment - Product / Service
Las Marias Establishment - Key offerings
SWOT

15.10 Lauro Raatz S.A.

Lauro Raatz S.A. - Overview
Lauro Raatz S.A. - Product / Service
Lauro Raatz S.A. - Key offerings
SWOT

15.11 Mate Factor

Mate Factor - Overview
Mate Factor - Product / Service
Mate Factor - Key offerings
SWOT

15.12 Molinos Rio de la Plata SA

Molinos Rio de la Plata SA - Overview
Molinos Rio de la Plata SA - Product / Service
Molinos Rio de la Plata SA - Key offerings
SWOT

15.13 PepsiCo Inc.

PepsiCo Inc. - Overview
PepsiCo Inc. - Business segments
PepsiCo Inc. - Key news
PepsiCo Inc. - Key offerings
PepsiCo Inc. - Segment focus
SWOT

15.14 Pipore

Pipore - Overview
Pipore - Product / Service
Pipore - Key offerings
SWOT

15.15 Selecta S.A.C.I.

Selecta S.A.C.I. - Overview
Selecta S.A.C.I. - Product / Service
Selecta S.A.C.I. - Key offerings
SWOT

15.16 Steaz

Steaz - Overview
Steaz - Product / Service
Steaz - Key offerings
SWOT

15.17 Triunfo do Brasil Ltda.

Triunfo do Brasil Ltda. - Overview
Triunfo do Brasil Ltda. - Product / Service
Triunfo do Brasil Ltda. - Key offerings
SWOT

15.18 Wisdom Natural Brands

Wisdom Natural Brands - Overview
Wisdom Natural Brands - Product / Service
Wisdom Natural Brands - Key offerings
SWOT

16. Appendix

16.1 Scope of the report

Market definition
Objectives
Notes and caveats

16.2 Inclusions and exclusions checklist

Inclusions checklist
Exclusions checklist

16.3 Currency conversion rates for US$

16.4 Research methodology

16.5 Data procurement

Information sources

16.6 Data validation

16.7 Validation techniques employed for market sizing

16.8 Data synthesis

16.9 360 degree market analysis

16.10 List of abbreviations

Research Methodology

Technavio presents a detailed picture of the market by way of study, synthesis, and summation of data from multiple sources. The analysts have presented the various facets of the market with a particular focus on identifying the key industry influencers. The data thus presented is comprehensive, reliable, and the result of extensive research, both primary and secondary.

INFORMATION SOURCES

Primary sources

  • Manufacturers and suppliers
  • Channel partners
  • Industry experts
  • Strategic decision makers

Secondary sources

  • Industry journals and periodicals
  • Government data
  • Financial reports of key industry players
  • Historical data
  • Press releases

DATA ANALYSIS

Data Synthesis

  • Collation of data
  • Estimation of key figures
  • Analysis of derived insights

Data Validation

  • Triangulation with data models
  • Reference against proprietary databases
  • Corroboration with industry experts

REPORT WRITING

Qualitative

  • Market drivers
  • Market challenges
  • Market trends
  • Five forces analysis

Quantitative

  • Market size and forecast
  • Market segmentation
  • Geographical insights
  • Competitive landscape

Interested in this report?

Get your sample now to see our research methodology and insights!

Download Now

Frequently Asked Questions

Yerba Mate market growth will increase by USD 376.7 million during 2026-2030.

The Yerba Mate market is expected to grow at a CAGR of 4.7% during 2026-2030.

Yerba Mate market is segmented by Distribution channel (Offline, Online) Application (Traditional brewed mate, Beverages, Energy drinks) Product type (Powder, Concentrate, Others)

CLEAN Cause Inc., Cooperativa Liebig, Establecimiento Santa Ana S.A., HRENUK SA, Kraus SA, Las Marias Establishment, Lauro Raatz S.A., Mate Factor, Mate Libre S.R.L., Mate Revolution Inc., Molinos Rio de la Plata SA, PepsiCo Inc., Pipore, Selecta S.A.C.I., Steaz, Triunfo do Brasil Ltda., Wisdom Natural Brands, Yerba Madre LLC, Yerba Mate Amanda, Yerba Mate Lab LLC are a few of the key vendors in the Yerba Mate market.

South America will register the highest growth rate of 75.8% among the other regions. Therefore, the Yerba Mate market in South America is expected to garner significant business opportunities for the vendors during the forecast period.

Argentina, Brazil, Chile, Saudi Arabia, UAE, South Africa, Turkey, Israel, US, Canada, Mexico, China, Japan, India, South Korea, Australia, Indonesia, Germany, UK, France, Italy, Spain, The Netherlands

  • Escalating consumer demand for functional wellness beverages is the driving factor this market.

The Yerba Mate market vendors should focus on grabbing business opportunities from the Distribution channel segment as it accounted for the largest market share in the base year.
RIA - Research AI Assistant
Ask RIA
