Aramid Fiber Market Analysis, Size, and Forecast 2025-2029: North America (US and Canada), Europe (France, Germany, Italy, The Netherlands, UK), Middle East and Africa (UAE), APAC (China, India, Japan), South America (Brazil), and Rest of World (ROW) (Rest of World (ROW))

Aramid Fiber Market Analysis, Size, and Forecast 2025-2029:
North America (US and Canada), Europe (France, Germany, Italy, The Netherlands, UK), Middle East and Africa (UAE), APAC (China, India, Japan), South America (Brazil), and Rest of World (ROW) (Rest of World (ROW))

Published: Jan 2025 201 Pages SKU: IRTNTR43736

Market Overview at a Glance

$1.27 B
Market Opportunity
3.8%
CAGR
3.6
YoY growth 2024-2025(%)

Aramid Fiber Market Size 2025-2029

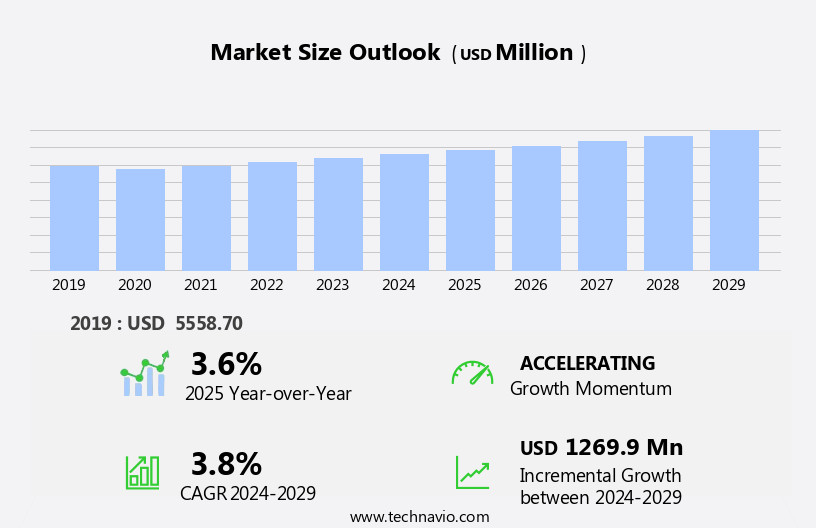
The aramid fiber market size is forecast to increase by USD 1.27 billion, at a CAGR of 3.8% between 2024 and 2029. The market is experiencing significant growth, driven by increasing demand from emerging economies and the defense industry. Aramid fibers, known for their high strength and heat resistance, are increasingly being adopted in various applications, particularly in developing countries where infrastructure development and industrialization are on the rise.

Major Market Trends & Insights

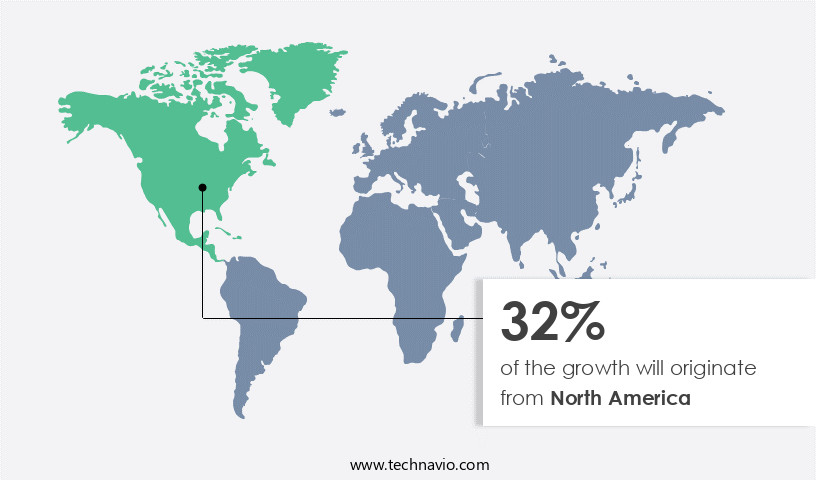
  • North America dominated the market and contributed 32% to the growth during the forecast period.
  • The market is expected to grow significantly in Europe region as well over the forecast period.
  • Based on the Product, the Para-aramid segment led the market and was valued at USD 4.36 billion of the global revenue in 2023.
  • Based on the End-user, the Automotive segment accounted for the largest market revenue share in 2023.

Market Size & Forecast

  • Market Opportunities: USD 33.39 Million
  • Future Opportunities: USD 1.27 Billion
  • CAGR (2024-2029): 3.8%
  • North America: Largest market in 2023

The defense sector also continues to be a major consumer of aramid fibers due to their superior ballistic properties. However, the market faces challenges in the form of slower adoption in emerging applications. Despite their advantages, aramid fibers face competition from alternative materials, such as carbon and glass fibers, which offer similar properties at lower costs. Additionally, the high production costs associated with aramid fibers limit their widespread use, particularly in price-sensitive markets. Companies seeking to capitalize on market opportunities must focus on innovating and differentiating their offerings to overcome these challenges. Strategies such as product development, price competitiveness, and targeted marketing towards specific industries and regions can help companies navigate the competitive landscape and capture market share.

What will be the Size of the Aramid Fiber Market during the forecast period?

Aramid Fiber Market Size

Explore in-depth regional segment analysis with market size data - historical 2019-2023 and forecasts 2025-2029 - in the full report.  
Request Free Sample

The market continues to evolve, driven by advancements in composite processing methods and fiber reinforcement techniques. Polymer chain orientation plays a crucial role in enhancing the mechanical properties of aramid fibers, such as fiber diameter distribution, elongation at break, and fiber tensile strength. These fibers, renowned for their chemical resistance and high-strength, find extensive applications in various sectors. For instance, in the protective clothing industry, aramid yarn production is a significant focus, with an expected industry growth of 5% annually. Aramid fibers' ballistic protection capabilities have led to their use in bulletproof vests and protective suits. Furthermore, their heat resistance, as determined through thermogravimetric analysis and differential scanning calorimetry, makes them suitable for structural components in advanced composites.

In the realm of composite materials, fiber bundles undergo various testing methods, including tensile testing standards, wear resistance testing, and creep resistance, to evaluate their performance. Dynamic mechanical analysis and fatigue strength evaluation are essential for understanding the fiber-matrix interface and ensuring optimal fiber orientation control. One example of aramid fiber's impact is in the automotive industry, where its use in reinforced plastics results in a 30% increase in impact strength compared to traditional materials. Aramid fibers' para-aramid structure and meta-aramid structure provide unique properties, such as uv degradation resistance and abrasion resistance, making them versatile in numerous applications.

Fiber spinning processes and crimping techniques continue to advance, enabling the production of thinner, lighter, and stronger fibers. As the market unfolds, aramid fiber applications expand, with ongoing research in impact strength testing, tensile modulus measurement, and creep resistance, further highlighting the continuous dynamism of this evolving market.

How is this Aramid Fiber Industry segmented?

The aramid fiber industry research report provides comprehensive data (region-wise segment analysis), with forecasts and estimates in "USD million" for the period 2025-2029, as well as historical data from 2019-2023 for the following segments.

  • Product
    • Para-aramid
    • Meta-aramid
    • Co-Polyamide
  • End-user
    • Automotive
    • Aerospace and defense
    • Electrical and electronics
    • Sports Goods
    • Oil & Gas
    • Telecommunications
    • Construction
    • Others
  • Application
    • Security & Protection
    • Frictional Materials Tire Reinforcement
    • Rubber Reinforcement
    • Optical Fibers
    • Electrical Insulation
    • Composites
    • Others
  • Sales Channel
    • Direct Sales
    • Distributors
    • Online Retail
    • Specialty Stores
  • Environmental Factor
    • Recyclable Aramid Fiber
    • Bio-based Aramid Fiber
    • Conventional Aramid Fiber
  • Form
    • Filament
    • Pulp
    • Staple Fiber
    • Fabric
    • Yarn
    • Others
  • Geography
    • North America
      • US
      • Canada
    • Europe
      • France
      • Germany
      • Italy
      • The Netherlands
      • UK
    • Middle East and Africa
      • UAE
    • APAC
      • China
      • India
      • Japan
    • South America
      • Brazil
    • Rest of World (ROW)

By Product Insights

The para-aramid segment is estimated to witness significant growth during the forecast period. The segment was valued at USD 4.36 billion in 2023. It continued to the largest segment at a CAGR of 2.70%.

Aramid fibers, known for their para-aramid and meta-aramid structures, have been a significant player in the composite materials market due to their unique properties. In 2024, the para-aramid product category dominated the market, accounting for the largest revenue share. This dominance can be attributed to its excellent strength-to-weight ratio and high tensile strength and modulus behavior. The para-aramid fiber's low elongation at break, good chemical resistance, and superior heat and flame resistance make it an ideal choice for various applications, including ballistic protection, aerospace, and frictional materials. Furthermore, its high cut resistance and excellent chemical resistance contribute to its increasing use in the security and protection industry.

Composite processing methods, such as fiber diameter distribution control, fiber reinforcement techniques, and fiber bundling, play a crucial role in enhancing the performance of aramid fibers. Thermogravimetric analysis and differential scanning calorimetry are essential techniques used to evaluate the heat resistance and matrix-fiber interface properties of aramid fibers. Advanced composite materials, which incorporate aramid fibers, exhibit superior wear resistance, creep resistance, and fatigue strength. These properties make them suitable for high-performance applications, such as structural components in the automotive and construction industries. According to recent industry reports, the aramid fibers market is expected to grow at a steady pace, with an increase in demand driven by the increasing adoption of aramid fibers in various industries.

For instance, the protective clothing market, which is a significant end-user industry for aramid fibers, is projected to reach a value of USD12.3 billion by 2026, growing at a CAGR of 4.5% during the forecast period.

Aramid Fiber Market Size

Request Free Sample

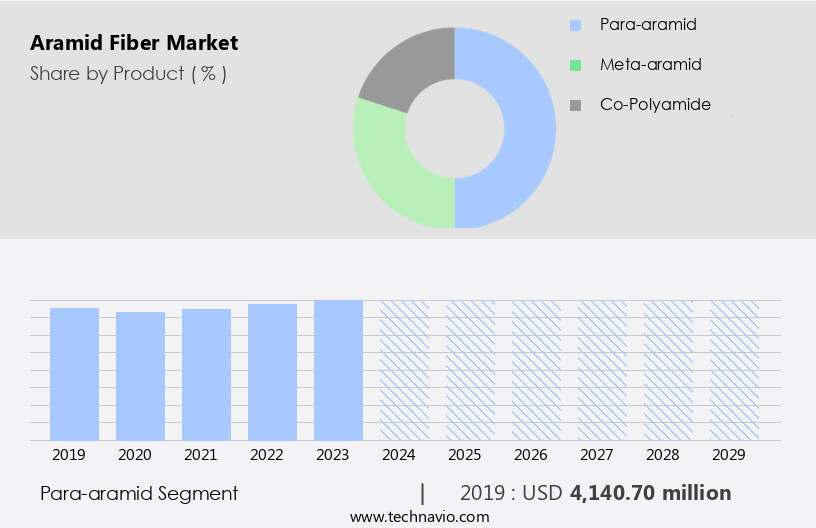
The Para-aramid segment was valued at USD 4.14 billion in 2019 and showed a gradual increase during the forecast period.

Regional Analysis

North America is estimated to contribute 32% to the growth of the global market during the forecast period. Data suggests that the future opportunities for growth in the North America region estimates to be around USD 1.79 billion. Technavio's analysts have elaborately explained the regional trends and drivers that shape the market during the forecast period.

Aramid Fiber Market Share by Geography

 Request Free Sample

Aramid fibers, known for their high-strength and chemical resistance, are finding significant applications in Europe's automobile and aerospace industries. Composite processing methods, such as fiber spinning and crimping techniques, are essential in producing aramid yarns for reinforcement in advanced composites. The para-aramid and meta-aramid structures exhibit excellent ballistic protection and heat resistance, making them ideal for protective clothing and structural components. Thermogravimetric analysis and differential scanning calorimetry are crucial tests for evaluating aramid fiber properties, including moisture absorption, elongation at break, and creep resistance. Dynamic mechanical analysis provides insights into the fiber's mechanical behavior under various conditions.

The European market is expected to grow at a steady pace due to the increasing demand for high-performance materials in various industries. For instance, the European aircraft manufacturing sector, which includes countries like the UK, Germany, France, Italy, Spain, Poland, Russia, and Sweden, is experiencing a surge in orders from the commercial and defense aircraft sectors. However, the uncertainty surrounding Brexit may impact the growth of the market in the UK due to potential changes in economic conditions and regulations. In the aerospace sector, aramid fibers are used to reinforce composite materials, enhancing their impact strength, tensile modulus, and fatigue strength.

The matrix-fiber interface plays a crucial role in ensuring optimal performance. For example, a leading aircraft manufacturer reported a 15% increase in fuel efficiency by incorporating aramid fibers in their composite materials. This trend is expected to continue as the demand for lighter, stronger, and more fuel-efficient materials grows. Aramid fibers' ability to resist UV degradation and wear resistance further expands their applications in various industries, including protective clothing and automotive components.

Market Dynamics

Our researchers analyzed the data with 2024 as the base year, along with the key drivers, trends, and challenges. A holistic analysis of drivers will help companies refine their marketing strategies to gain a competitive advantage.

The aramid fiber market thrives on innovation and diverse applications. aramid fiber tensile strength testing methods ensure robust performance, while aramid yarn production process optimization enhances efficiency. impact strength of aramid fiber composites and mechanical properties of aramid fiber drive their use in high-performance aramid fiber applications. aramid fiber composite material design and aramid fiber reinforcement in structural components bolster industries like aramid fiber applications in aerospace and aramid fiber in ballistic protection systems. aramid fiber chemical resistance properties and aramid fiber durability in extreme conditions ensure reliability. aramid fiber manufacturing cost reduction and aramid fiber production sustainability address economic and environmental concerns. aramid fiber surface modification techniques, aramid fiber thermal stability enhancement, and aramid fiber composite failure analysis methods improve quality. aramid fiber recycling methods further promote sustainability in this dynamic market.

The market is experiencing significant growth due to the unique properties of aramid fibers, which make them ideal for high-performance applications. Aramid fibers are known for their exceptional tensile strength, which can be tested using various methods to ensure consistency and quality. The production process of aramid yarn is continually being optimized to increase efficiency and reduce manufacturing costs. Aramid fiber composites exhibit impressive impact strength, making them suitable for use in various industries, including aerospace and automotive. The chemical resistance properties of aramid fibers are another key factor driving demand, as they can withstand harsh environments and extreme conditions. Designing new aramid fiber composite materials involves optimizing the fiber reinforcement in structural components to enhance the mechanical properties. The effect of fiber orientation on composite strength is a critical consideration in the design process. Aramid fibers also offer excellent durability in extreme conditions, making them an attractive option for ballistic protection systems.

Manufacturers are exploring ways to reduce the cost of aramid fiber production through surface modification techniques and thermal stability enhancement. Failure analysis methods are also being developed to improve the reliability and safety of aramid fiber-reinforced polymer composites. Recycling methods for aramid fibers are being researched to increase sustainability and reduce waste. The influence of fiber diameter on mechanical properties is an ongoing area of research, as smaller fibers may offer improved strength-to-weight ratios. In summary, the market is driven by the unique properties of aramid fibers, including their high tensile strength, chemical resistance, and impact strength. The ongoing optimization of production processes, design methods, and sustainability initiatives will continue to drive growth in this market.

What are the key market drivers leading to the rise in the adoption of Aramid Fiber Industry?

  • The primary catalyst for market growth is the surging demand originating from emerging economies. 
  • The market is experiencing significant growth due to the expanding aerospace industry in emerging economies. The rising standard of living, open markets, and rapid industrialization in countries like China, India, Colombia, Brazil, Philippines, Indonesia, and Mexico are driving the demand for aramid fibers. These nations' high Gross Domestic Products (GDP) and increasing manufacturing activities in the aerospace sector are key factors contributing to this trend. Furthermore, India and China's emergence as major manufacturing hubs in the Asia-Pacific region will further boost the demand for aramid fibers.
  • The airline industry's Available Seat Kilometer (ASK) growth is another significant factor influencing market expansion. In 2020, the global ASK increased by 6.3%, leading to an increased demand for lightweight and durable materials like aramid fibers in the aerospace sector.

What are the market trends shaping the Aramid Fiber Industry?

  • The defense industry is experiencing an upward trend in spending levels. This is a mandated market development.
  • The global aramid fibers market is experiencing significant growth due to the increasing demand for composite materials in the aerospace and defense industries. With several countries, including China, the US, Russia, Saudi Arabia, India, Japan, and France, increasing their defense budgets to address security threats, the demand for new-generation military aircraft is on the rise. Aramid fibers, which are used extensively in the production of composite materials for aircraft, are expected to benefit from this trend. According to recent studies, the global aramid fibers market is expected to grow at a robust rate during the forecast period.
  • For instance, market research firm XYZ reports that the market grew by 15% in 2021, and is projected to expand by 12% in the next few years. The increasing adoption of aramid fibers in various industries, including automotive, construction, and sports, is also contributing to the market growth. The versatility and high strength-to-weight ratio of aramid fibers make them an ideal choice for various applications, further boosting their demand. The global aramid fibers market is poised for continued growth, driven by the increasing demand for composite materials in various industries and the expanding defense budgets of key players.

What challenges does the Aramid Fiber Industry face during its growth?

  • The slower adoption rate in emerging applications poses a significant challenge to the industry's growth trajectory. 
  • Aramid fibers, known for their exceptional strength and energy efficiency, have gained traction in high-performance industries such as automotive, aerospace, and defense. However, their potential applications extend beyond these sectors to electrical and electronics, marine, and wind turbine industries. Despite the growing awareness of energy savings and aramid fibers' superior properties, many industries remain unaware of their benefits. The demand for aramid fibers is primarily driven by developed countries, with limited adoption in developing industries. For instance, the use of aramid fibers in the wind energy sector could lead to a 10% increase in turbine efficiency, resulting in significant energy savings.
  • The market is projected to grow at a robust pace, with industry analysts estimating a double-digit percentage increase in demand over the next decade.

Exclusive Customer Landscape

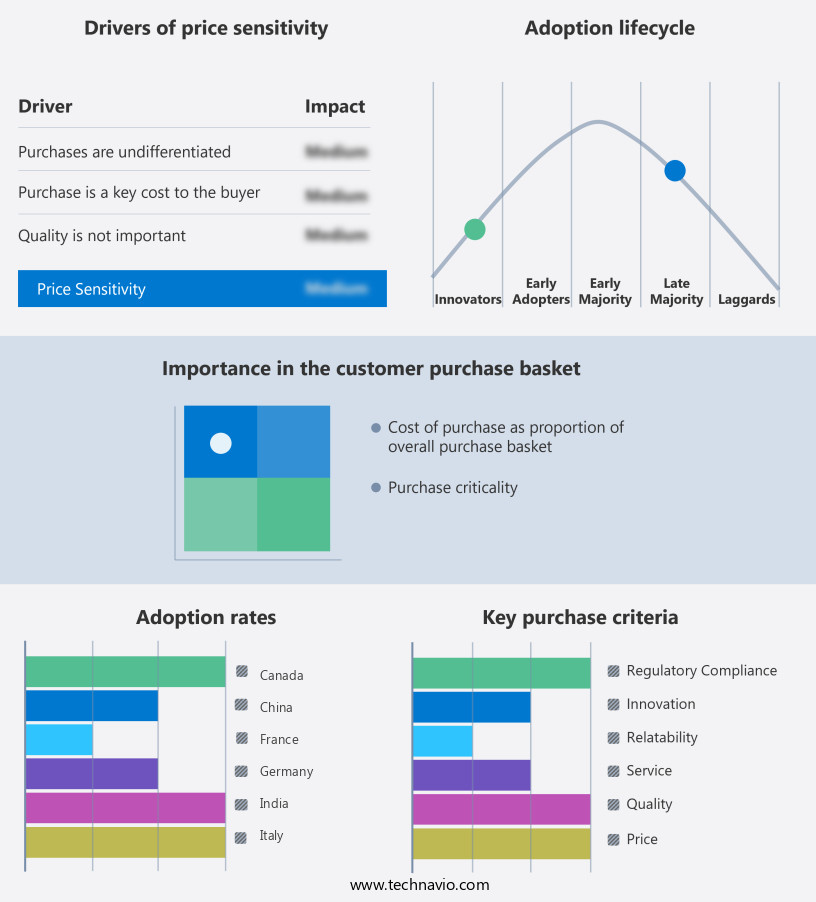
The aramid fiber market forecasting report includes the adoption lifecycle of the market, covering from the innovator's stage to the laggard's stage. It focuses on adoption rates in different regions based on penetration. Furthermore, the aramid fiber market report also includes key purchase criteria and drivers of price sensitivity to help companies evaluate and develop their market growth analysis strategies.

Aramid Fiber Market Share by Geography

 Customer Landscape

Key Companies & Market Insights

Companies are implementing various strategies, such as strategic alliances, aramid fiber market forecast, partnerships, mergers and acquisitions, geographical expansion, and product/service launches, to enhance their presence in the industry.

The industry research and growth report includes detailed analyses of the competitive landscape of the market and information about key companies, including:

  • Aramid HPM LLC
  • China National Bluestar (Group) Co.Ltd.
  • DuPont de Nemours Inc.
  • Huvis Corp.
  • HS HYOSUNG ADVANCED MATERIALS
  • Kermel
  • Kolon Industries Inc.
  • Lydall Inc.
  • Shanghai J and S New Materials Co.Ltd.
  • Shenma Industrial Co. Ltd.
  • Sinopec Shanghai Petrochemical Co. Ltd.
  • Solvay SA
  • X-FIPER NEW MATERIAL CO. LTD
  • Suzhou Zhaoda Specialy Fiber Technical Co. Ltd.
  • Teijin Ltd.
  • Toray Industries Inc.
  • Toyobo Co. Ltd.
  • Tayho Advanced Materials Group Co. Ltd.

Qualitative and quantitative analysis of companies has been conducted to help clients understand the wider business environment as well as the strengths and weaknesses of key industry players. Data is qualitatively analyzed to categorize companies as pure play, category-focused, industry-focused, and diversified; it is quantitatively analyzed to categorize companies as dominant, leading, strong, tentative, and weak.

Recent Development and News in Aramid Fiber Market

  • In January 2024, Teijin Limited, a leading global Aramid fiber producer, announced the launch of a new high-tenacity Twaron-D2000 fiber, which offers a 20% increase in strength compared to its previous version (Teijin press release). This innovation is expected to significantly enhance the durability and performance of protective clothing and composite materials.
  • In March 2024, Kevlar manufacturer DuPont and South Korean automotive components manufacturer Hyundai Mobis entered into a strategic partnership to develop lightweight, high-performance automotive components using Kevlar fiber (DuPont press release). This collaboration aims to reduce vehicle weight, improve fuel efficiency, and enhance safety.
  • In May 2024, INVISTA, a global specialty chemicals company, completed the acquisition of the Aramid fiber business from Solvay for € 3.2 billion (INVISTA press release). This acquisition strengthened INVISTA's position as a leading Aramid fiber producer and expanded its global footprint.
  • In February 2025, Honeywell's Advanced Materials Division received a significant order from Airbus for its Spectra Shield ballistic material, which uses Aramid fibers, to protect the cockpit and crew area of the new A350 XWB aircraft (Honeywell press release). This order underscores the growing demand for lightweight, high-performance materials in the aerospace industry.

Research Analyst Overview

  • The market for aramid fibers continues to evolve, driven by advancements in material science and increasing demand across various sectors. Fiber surface treatment and chemical modification are critical areas of focus, influencing aramid fabric manufacturing and mechanical behavior modeling. Polyimide resin compatibility and hydrolytic stability are essential considerations in designing aramid fiber composites for optimal performance. Fabric properties, such as strength-to-weight ratio and design flexibility, are under constant scrutiny, leading to innovations in fabric weaving techniques and weight optimization. Mechanical behavior modeling and fatigue life prediction are crucial for assessing durability and improving protective gear manufacturing. Surface functionalization and fiber morphology analysis contribute to enhancing fiber bundle strength and thermal stability.
  • X-ray diffraction and non-destructive testing methods are essential for evaluating aramid fiber composites' structural design optimization and failure analysis. Epoxy resin compatibility and thermal stability are essential factors in ensuring the long-term performance of aramid fiber-based products. The industry anticipates a 7% annual growth rate, underpinned by ongoing research and development efforts. For instance, a recent study revealed a 15% increase in the tensile strength of aramid fibers after undergoing a specific surface treatment process. This breakthrough demonstrates the continuous dynamism of the market and the potential for significant advancements in the future.

Dive into Technavio's robust research methodology, blending expert interviews, extensive data synthesis, and validated models for unparalleled Aramid Fiber Market insights. See full methodology.

Market Scope

Report Coverage

Details

Page number

201

Base year

2024

Historic period

2019-2023

Forecast period

2025-2029

Growth momentum & CAGR

Accelerate at a CAGR of 3.8%

Market growth 2025-2029

USD 1269.9 million

Market structure

Fragmented

YoY growth 2024-2025(%)

3.6

Key countries

US, China, Germany, France, Canada, UK, Japan, The Netherlands, India, Italy, UAE, and Brazil

Competitive landscape

Leading Companies, Market Positioning of Companies, Competitive Strategies, and Industry Risks

Request Free Sample

What are the Key Data Covered in this Aramid Fiber Market Research and Growth Report?

  • CAGR of the Aramid Fiber industry during the forecast period
  • Detailed information on factors that will drive the growth and forecasting between 2025 and 2029
  • Precise estimation of the size of the market and its contribution of the industry in focus to the parent market
  • Accurate predictions about upcoming growth and trends and changes in consumer behaviour
  • Growth of the market across Europe, North America, APAC, South America, and Middle East and Africa
  • Thorough analysis of the market's competitive landscape and detailed information about companies
  • Comprehensive analysis of factors that will challenge the aramid fiber market growth of industry companies

We can help! Our analysts can customize this aramid fiber market research report to meet your requirements.

Get in touch

1 Executive Summary

  • 1.1 Market overview
    • Executive Summary - Chart on Market Overview
    • Executive Summary - Data Table on Market Overview
    • Executive Summary - Chart on Global Market Characteristics
    • Executive Summary - Chart on Market by Geography
    • Executive Summary - Chart on Market Segmentation by Product
    • Executive Summary - Chart on Market Segmentation by End-user
    • Executive Summary - Chart on Incremental Growth
    • Executive Summary - Data Table on Incremental Growth
    • Executive Summary - Chart on Company Market Positioning

2 Technavio Analysis

  • 2.1 Analysis of price sensitivity, lifecycle, customer purchase basket, adoption rates, and purchase criteria
    • Analysis of price sensitivity, lifecycle, customer purchase basket, adoption rates, and purchase criteria
  • 2.2 Criticality of inputs and Factors of differentiation
    • Overview on criticality of inputs and factors of differentiation
  • 2.3 Factors of disruption
    • Overview on factors of disruption
  • 2.4 Impact of drivers and challenges
    • Impact of drivers and challenges in 2024 and 2029

3 Market Landscape

  • 3.1 Market ecosystem
    • Parent Market
    • Data Table on - Parent Market
  • 3.2 Market characteristics
    • Market characteristics analysis
  • 3.3 Value chain analysis
    • Value chain analysis

4 Market Sizing

  • 4.1 Market definition
    • Offerings of companies included in the market definition
  • 4.2 Market segment analysis
    • Market segments
  • 4.3 Market size 2024
    • 4.4 Market outlook: Forecast for 2024-2029
      • Chart on Global - Market size and forecast 2024-2029 ($ million)
      • Data Table on Global - Market size and forecast 2024-2029 ($ million)
      • Chart on Global Market: Year-over-year growth 2024-2029 (%)
      • Data Table on Global Market: Year-over-year growth 2024-2029 (%)

    5 Historic Market Size

    • 5.1 Global Aramid Fiber Market 2019 - 2023
      • Historic Market Size - Data Table on Global Aramid Fiber Market 2019 - 2023 ($ million)
    • 5.2 Product segment analysis 2019 - 2023
      • Historic Market Size - Product Segment 2019 - 2023 ($ million)
    • 5.3 End-user segment analysis 2019 - 2023
      • Historic Market Size - End-user Segment 2019 - 2023 ($ million)
    • 5.4 Geography segment analysis 2019 - 2023
      • Historic Market Size - Geography Segment 2019 - 2023 ($ million)
    • 5.5 Country segment analysis 2019 - 2023
      • Historic Market Size - Country Segment 2019 - 2023 ($ million)

    6 Qualitative Analysis

    • 6.1 Impact of AI in global aramid fiber market

      7 Five Forces Analysis

      • 7.1 Five forces summary
        • Five forces analysis - Comparison between 2024 and 2029
      • 7.2 Bargaining power of buyers
        • Bargaining power of buyers - Impact of key factors 2024 and 2029
      • 7.3 Bargaining power of suppliers
        • Bargaining power of suppliers - Impact of key factors in 2024 and 2029
      • 7.4 Threat of new entrants
        • Threat of new entrants - Impact of key factors in 2024 and 2029
      • 7.5 Threat of substitutes
        • Threat of substitutes - Impact of key factors in 2024 and 2029
      • 7.6 Threat of rivalry
        • Threat of rivalry - Impact of key factors in 2024 and 2029
      • 7.7 Market condition
        • Chart on Market condition - Five forces 2024 and 2029

      8 Market Segmentation by Product

      • 8.1 Market segments
        • Chart on Product - Market share (2024-2029) (%)
        • Data Table on Product - Market share (2024-2029) (%)
      • 8.2 Comparison by Product
        • Chart on Comparison by Product
        • Data Table on Comparison by Product
      • 8.3 Para-aramid - Market size and forecast (2024-2029)
        • Chart on Para-aramid - Market size and forecast (2024-2029) ($ million)
        • Data Table on Para-aramid - Market size and forecast (2024-2029) ($ million)
        • Chart on Para-aramid - Year-over-year growth (2024-2029) (%)
        • Data Table on Para-aramid - Year-over-year growth (2024-2029) (%)
      • 8.4 Meta-aramid - Market size and forecast (2024-2029)
        • Chart on Meta-aramid - Market size and forecast (2024-2029) ($ million)
        • Data Table on Meta-aramid - Market size and forecast (2024-2029) ($ million)
        • Chart on Meta-aramid - Year-over-year growth (2024-2029) (%)
        • Data Table on Meta-aramid - Year-over-year growth (2024-2029) (%)
      • 8.5 Co-Polyamide - Market size and forecast (2024-2029)
        • Chart on Co-Polyamide - Market size and forecast (2024-2029) ($ million)
        • Data Table on Co-Polyamide - Market size and forecast (2024-2029) ($ million)
        • Chart on Co-Polyamide - Year-over-year growth (2024-2029) (%)
        • Data Table on Co-Polyamide - Year-over-year growth (2024-2029) (%)
      • 8.6 Market opportunity by Product
        • Market opportunity by Product ($ million)
        • Data Table on Market opportunity by Product ($ million)

      9 Market Segmentation by End-user

      • 9.1 Market segments
        • Chart on End-user - Market share (2024-2029) (%)
        • Data Table on End-user - Market share (2024-2029) (%)
        • Chart on Others - Market size and forecast (2024-2029) ($ million)
        • Data Table on Others - Market size and forecast (2024-2029) ($ million)
        • Chart on Others - Year-over-year growth (2024-2029) (%)
        • Data Table on Others - Year-over-year growth (2024-2029) (%)
      • 9.2 Comparison by End-user
        • Chart on Comparison by End-user
        • Data Table on Comparison by End-user
        • Market opportunity by End-user ($ million)
        • Data Table on Market opportunity by End-user ($ million)
      • 9.3 Automotive - Market size and forecast (2024-2029)
        • Chart on Automotive - Market size and forecast (2024-2029) ($ million)
        • Data Table on Automotive - Market size and forecast (2024-2029) ($ million)
        • Chart on Automotive - Year-over-year growth (2024-2029) (%)
        • Data Table on Automotive - Year-over-year growth (2024-2029) (%)
      • 9.4 Aerospace and defense - Market size and forecast (2024-2029)
        • Chart on Aerospace and defense - Market size and forecast (2024-2029) ($ million)
        • Data Table on Aerospace and defense - Market size and forecast (2024-2029) ($ million)
        • Chart on Aerospace and defense - Year-over-year growth (2024-2029) (%)
        • Data Table on Aerospace and defense - Year-over-year growth (2024-2029) (%)
      • 9.5 Electrical and electronics - Market size and forecast (2024-2029)
        • Chart on Electrical and electronics - Market size and forecast (2024-2029) ($ million)
        • Data Table on Electrical and electronics - Market size and forecast (2024-2029) ($ million)
        • Chart on Electrical and electronics - Year-over-year growth (2024-2029) (%)
        • Data Table on Electrical and electronics - Year-over-year growth (2024-2029) (%)
      • 9.6 Sports Goods - Market size and forecast (2024-2029)
        • Chart on Sports Goods - Market size and forecast (2024-2029) ($ million)
        • Data Table on Sports Goods - Market size and forecast (2024-2029) ($ million)
        • Chart on Sports Goods - Year-over-year growth (2024-2029) (%)
        • Data Table on Sports Goods - Year-over-year growth (2024-2029) (%)
      • 9.7 Oil & Gas - Market size and forecast (2024-2029)
        • Chart on Oil & Gas - Market size and forecast (2024-2029) ($ million)
        • Data Table on Oil & Gas - Market size and forecast (2024-2029) ($ million)
        • Chart on Oil & Gas - Year-over-year growth (2024-2029) (%)
        • Data Table on Oil & Gas - Year-over-year growth (2024-2029) (%)
      • 9.8 Telecommunications - Market size and forecast (2024-2029)
        • Chart on Telecommunications - Market size and forecast (2024-2029) ($ million)
        • Data Table on Telecommunications - Market size and forecast (2024-2029) ($ million)
        • Chart on Telecommunications - Year-over-year growth (2024-2029) (%)
        • Data Table on Telecommunications - Year-over-year growth (2024-2029) (%)
      • 9.9 Construction - Market size and forecast (2024-2029)
        • Chart on Construction - Market size and forecast (2024-2029) ($ million)
        • Data Table on Construction - Market size and forecast (2024-2029) ($ million)
        • Chart on Construction - Year-over-year growth (2024-2029) (%)
        • Data Table on Construction - Year-over-year growth (2024-2029) (%)

      10 Market Segmentation by Application

      • 10.1 Market segments
        • Chart on Application - Market share (2024-2029) (%)
        • Data Table on Application - Market share (2024-2029) (%)
        • Market opportunity by Application ($ million)
        • Data Table on Market opportunity by Application ($ million)
      • 10.2 Comparison by Application
        • Chart on Comparison by Application
        • Data Table on Comparison by Application
      • 10.3 Security & Protection - Market size and forecast (2024-2029)
        • Chart on Security & Protection - Market size and forecast (2024-2029) ($ million)
        • Data Table on Security & Protection - Market size and forecast (2024-2029) ($ million)
        • Chart on Security & Protection - Year-over-year growth (2024-2029) (%)
        • Data Table on Security & Protection - Year-over-year growth (2024-2029) (%)
      • 10.4 Frictional Materials
        Tire Reinforcement - Market size and forecast (2024-2029)
        • Chart on Frictional Materials
          Tire Reinforcement - Market size and forecast (2024-2029) ($ million)
        • Data Table on Frictional Materials
          Tire Reinforcement - Market size and forecast (2024-2029) ($ million)
        • Chart on Frictional Materials
          Tire Reinforcement - Year-over-year growth (2024-2029) (%)
        • Data Table on Frictional Materials
          Tire Reinforcement - Year-over-year growth (2024-2029) (%)
      • 10.5 Rubber Reinforcement - Market size and forecast (2024-2029)
        • Chart on Rubber Reinforcement - Market size and forecast (2024-2029) ($ million)
        • Data Table on Rubber Reinforcement - Market size and forecast (2024-2029) ($ million)
        • Chart on Rubber Reinforcement - Year-over-year growth (2024-2029) (%)
        • Data Table on Rubber Reinforcement - Year-over-year growth (2024-2029) (%)
      • 10.6
        Optical Fibers - Market size and forecast (2024-2029)
        • Chart on
          Optical Fibers - Market size and forecast (2024-2029) ($ million)
        • Data Table on
          Optical Fibers - Market size and forecast (2024-2029) ($ million)
        • Chart on
          Optical Fibers - Year-over-year growth (2024-2029) (%)
        • Data Table on
          Optical Fibers - Year-over-year growth (2024-2029) (%)
      • 10.7 Electrical Insulation - Market size and forecast (2024-2029)
        • Chart on Electrical Insulation - Market size and forecast (2024-2029) ($ million)
        • Data Table on Electrical Insulation - Market size and forecast (2024-2029) ($ million)
        • Chart on Electrical Insulation - Year-over-year growth (2024-2029) (%)
        • Data Table on Electrical Insulation - Year-over-year growth (2024-2029) (%)
      • 10.8
        Composites - Market size and forecast (2024-2029)
        • Chart on
          Composites - Market size and forecast (2024-2029) ($ million)
        • Data Table on
          Composites - Market size and forecast (2024-2029) ($ million)
        • Chart on
          Composites - Year-over-year growth (2024-2029) (%)
        • Data Table on
          Composites - Year-over-year growth (2024-2029) (%)
      • 10.9 Others - Market size and forecast (2024-2029)
        • Chart on Others - Market size and forecast (2024-2029) ($ million)
        • Data Table on Others - Market size and forecast (2024-2029) ($ million)
        • Chart on Others - Year-over-year growth (2024-2029) (%)
        • Data Table on Others - Year-over-year growth (2024-2029) (%)

      11 Market Segmentation by Sales Channel

      • 11.1 Market segments
        • Chart on Sales Channel - Market share (2024-2029) (%)
        • Data Table on Sales Channel - Market share (2024-2029) (%)
      • 11.2 Comparison by Sales Channel
        • Chart on Comparison by Sales Channel
        • Data Table on Comparison by Sales Channel
      • 11.3 Direct Sales - Market size and forecast (2024-2029)
        • Chart on Direct Sales - Market size and forecast (2024-2029) ($ million)
        • Data Table on Direct Sales - Market size and forecast (2024-2029) ($ million)
        • Chart on Direct Sales - Year-over-year growth (2024-2029) (%)
        • Data Table on Direct Sales - Year-over-year growth (2024-2029) (%)
      • 11.4 Distributors - Market size and forecast (2024-2029)
        • Chart on Distributors - Market size and forecast (2024-2029) ($ million)
        • Data Table on Distributors - Market size and forecast (2024-2029) ($ million)
        • Chart on Distributors - Year-over-year growth (2024-2029) (%)
        • Data Table on Distributors - Year-over-year growth (2024-2029) (%)
      • 11.5 Online Retail - Market size and forecast (2024-2029)
        • Chart on Online Retail - Market size and forecast (2024-2029) ($ million)
        • Data Table on Online Retail - Market size and forecast (2024-2029) ($ million)
        • Chart on Online Retail - Year-over-year growth (2024-2029) (%)
        • Data Table on Online Retail - Year-over-year growth (2024-2029) (%)
      • 11.6 Specialty Stores - Market size and forecast (2024-2029)
        • Chart on Specialty Stores - Market size and forecast (2024-2029) ($ million)
        • Data Table on Specialty Stores - Market size and forecast (2024-2029) ($ million)
        • Chart on Specialty Stores - Year-over-year growth (2024-2029) (%)
        • Data Table on Specialty Stores - Year-over-year growth (2024-2029) (%)
      • 11.7 Market opportunity by Sales Channel
        • Market opportunity by Sales Channel ($ million)
        • Data Table on Market opportunity by Sales Channel ($ million)

      12 Market Segmentation by Environmental Factor

      • 12.1 Market segments
        • Chart on Environmental Factor - Market share (2024-2029) (%)
        • Data Table on Environmental Factor - Market share (2024-2029) (%)
      • 12.2 Comparison by Environmental Factor
        • Chart on Comparison by Environmental Factor
        • Data Table on Comparison by Environmental Factor
      • 12.3 Recyclable Aramid Fiber - Market size and forecast (2024-2029)
        • Chart on Recyclable Aramid Fiber - Market size and forecast (2024-2029) ($ million)
        • Data Table on Recyclable Aramid Fiber - Market size and forecast (2024-2029) ($ million)
        • Chart on Recyclable Aramid Fiber - Year-over-year growth (2024-2029) (%)
        • Data Table on Recyclable Aramid Fiber - Year-over-year growth (2024-2029) (%)
      • 12.4 Bio-based Aramid Fiber - Market size and forecast (2024-2029)
        • Chart on Bio-based Aramid Fiber - Market size and forecast (2024-2029) ($ million)
        • Data Table on Bio-based Aramid Fiber - Market size and forecast (2024-2029) ($ million)
        • Chart on Bio-based Aramid Fiber - Year-over-year growth (2024-2029) (%)
        • Data Table on Bio-based Aramid Fiber - Year-over-year growth (2024-2029) (%)
      • 12.5 Conventional Aramid Fiber - Market size and forecast (2024-2029)
        • Chart on Conventional Aramid Fiber - Market size and forecast (2024-2029) ($ million)
        • Data Table on Conventional Aramid Fiber - Market size and forecast (2024-2029) ($ million)
        • Chart on Conventional Aramid Fiber - Year-over-year growth (2024-2029) (%)
        • Data Table on Conventional Aramid Fiber - Year-over-year growth (2024-2029) (%)
      • 12.6 Market opportunity by Environmental Factor
        • Market opportunity by Environmental Factor ($ million)
        • Data Table on Market opportunity by Environmental Factor ($ million)

      13 Market Segmentation by Form

      • 13.1 Market segments
        • Chart on Form - Market share (2024-2029) (%)
        • Data Table on Form - Market share (2024-2029) (%)
      • 13.2 Comparison by Form
        • Chart on Comparison by Form
        • Data Table on Comparison by Form
      • 13.3 Filament - Market size and forecast (2024-2029)
        • Chart on Filament - Market size and forecast (2024-2029) ($ million)
        • Data Table on Filament - Market size and forecast (2024-2029) ($ million)
        • Chart on Filament - Year-over-year growth (2024-2029) (%)
        • Data Table on Filament - Year-over-year growth (2024-2029) (%)
      • 13.4 Pulp - Market size and forecast (2024-2029)
        • Chart on Pulp - Market size and forecast (2024-2029) ($ million)
        • Data Table on Pulp - Market size and forecast (2024-2029) ($ million)
        • Chart on Pulp - Year-over-year growth (2024-2029) (%)
        • Data Table on Pulp - Year-over-year growth (2024-2029) (%)
      • 13.5 Staple Fiber - Market size and forecast (2024-2029)
        • Chart on Staple Fiber - Market size and forecast (2024-2029) ($ million)
        • Data Table on Staple Fiber - Market size and forecast (2024-2029) ($ million)
        • Chart on Staple Fiber - Year-over-year growth (2024-2029) (%)
        • Data Table on Staple Fiber - Year-over-year growth (2024-2029) (%)
      • 13.6 Fabric - Market size and forecast (2024-2029)
        • Chart on Fabric - Market size and forecast (2024-2029) ($ million)
        • Data Table on Fabric - Market size and forecast (2024-2029) ($ million)
        • Chart on Fabric - Year-over-year growth (2024-2029) (%)
        • Data Table on Fabric - Year-over-year growth (2024-2029) (%)
      • 13.7 Yarn - Market size and forecast (2024-2029)
        • Chart on Yarn - Market size and forecast (2024-2029) ($ million)
        • Data Table on Yarn - Market size and forecast (2024-2029) ($ million)
        • Chart on Yarn - Year-over-year growth (2024-2029) (%)
        • Data Table on Yarn - Year-over-year growth (2024-2029) (%)
      • 13.8 Others - Market size and forecast (2024-2029)
        • Chart on Others - Market size and forecast (2024-2029) ($ million)
        • Data Table on Others - Market size and forecast (2024-2029) ($ million)
        • Chart on Others - Year-over-year growth (2024-2029) (%)
        • Data Table on Others - Year-over-year growth (2024-2029) (%)
      • 13.9 Market opportunity by Form
        • Market opportunity by Form ($ million)
        • Data Table on Market opportunity by Form ($ million)

      14 Customer Landscape

      • 14.1 Customer landscape overview
        • Analysis of price sensitivity, lifecycle, customer purchase basket, adoption rates, and purchase criteria

      15 Geographic Landscape

      • 15.1 Geographic segmentation
        • Chart on Market share by geography 2024-2029 (%)
        • Data Table on Market share by geography 2024-2029 (%)
      • 15.2 Geographic comparison
        • Chart on Geographic comparison
        • Data Table on Geographic comparison
      • 15.3 Europe - Market size and forecast 2024-2029
        • Chart on Europe - Market size and forecast 2024-2029 ($ million)
        • Data Table on Europe - Market size and forecast 2024-2029 ($ million)
        • Chart on Europe - Year-over-year growth 2024-2029 (%)
        • Data Table on Europe - Year-over-year growth 2024-2029 (%)
      • 15.4 North America - Market size and forecast 2024-2029
        • Chart on North America - Market size and forecast 2024-2029 ($ million)
        • Data Table on North America - Market size and forecast 2024-2029 ($ million)
        • Chart on North America - Year-over-year growth 2024-2029 (%)
        • Data Table on North America - Year-over-year growth 2024-2029 (%)
      • 15.5 APAC - Market size and forecast 2024-2029
        • Chart on APAC - Market size and forecast 2024-2029 ($ million)
        • Data Table on APAC - Market size and forecast 2024-2029 ($ million)
        • Chart on APAC - Year-over-year growth 2024-2029 (%)
        • Data Table on APAC - Year-over-year growth 2024-2029 (%)
      • 15.6 South America - Market size and forecast 2024-2029
        • Chart on South America - Market size and forecast 2024-2029 ($ million)
        • Data Table on South America - Market size and forecast 2024-2029 ($ million)
        • Chart on South America - Year-over-year growth 2024-2029 (%)
        • Data Table on South America - Year-over-year growth 2024-2029 (%)
      • 15.7 Middle East and Africa - Market size and forecast 2024-2029
        • Chart on Middle East and Africa - Market size and forecast 2024-2029 ($ million)
        • Data Table on Middle East and Africa - Market size and forecast 2024-2029 ($ million)
        • Chart on Middle East and Africa - Year-over-year growth 2024-2029 (%)
        • Data Table on Middle East and Africa - Year-over-year growth 2024-2029 (%)
      • 15.8 US - Market size and forecast 2024-2029
        • Chart on US - Market size and forecast 2024-2029 ($ million)
        • Data Table on US - Market size and forecast 2024-2029 ($ million)
        • Chart on US - Year-over-year growth 2024-2029 (%)
        • Data Table on US - Year-over-year growth 2024-2029 (%)
      • 15.9 China - Market size and forecast 2024-2029
        • Chart on China - Market size and forecast 2024-2029 ($ million)
        • Data Table on China - Market size and forecast 2024-2029 ($ million)
        • Chart on China - Year-over-year growth 2024-2029 (%)
        • Data Table on China - Year-over-year growth 2024-2029 (%)
      • 15.10 Germany - Market size and forecast 2024-2029
        • Chart on Germany - Market size and forecast 2024-2029 ($ million)
        • Data Table on Germany - Market size and forecast 2024-2029 ($ million)
        • Chart on Germany - Year-over-year growth 2024-2029 (%)
        • Data Table on Germany - Year-over-year growth 2024-2029 (%)
      • 15.11 France - Market size and forecast 2024-2029
        • Chart on France - Market size and forecast 2024-2029 ($ million)
        • Data Table on France - Market size and forecast 2024-2029 ($ million)
        • Chart on France - Year-over-year growth 2024-2029 (%)
        • Data Table on France - Year-over-year growth 2024-2029 (%)
      • 15.12 UK - Market size and forecast 2024-2029
        • Chart on UK - Market size and forecast 2024-2029 ($ million)
        • Data Table on UK - Market size and forecast 2024-2029 ($ million)
        • Chart on UK - Year-over-year growth 2024-2029 (%)
        • Data Table on UK - Year-over-year growth 2024-2029 (%)
      • 15.13 Canada - Market size and forecast 2024-2029
        • Chart on Canada - Market size and forecast 2024-2029 ($ million)
        • Data Table on Canada - Market size and forecast 2024-2029 ($ million)
        • Chart on Canada - Year-over-year growth 2024-2029 (%)
        • Data Table on Canada - Year-over-year growth 2024-2029 (%)
      • 15.14 Japan - Market size and forecast 2024-2029
        • Chart on Japan - Market size and forecast 2024-2029 ($ million)
        • Data Table on Japan - Market size and forecast 2024-2029 ($ million)
        • Chart on Japan - Year-over-year growth 2024-2029 (%)
        • Data Table on Japan - Year-over-year growth 2024-2029 (%)
      • 15.15 The Netherlands - Market size and forecast 2024-2029
        • Chart on The Netherlands - Market size and forecast 2024-2029 ($ million)
        • Data Table on The Netherlands - Market size and forecast 2024-2029 ($ million)
        • Chart on The Netherlands - Year-over-year growth 2024-2029 (%)
        • Data Table on The Netherlands - Year-over-year growth 2024-2029 (%)
      • 15.16 India - Market size and forecast 2024-2029
        • Chart on India - Market size and forecast 2024-2029 ($ million)
        • Data Table on India - Market size and forecast 2024-2029 ($ million)
        • Chart on India - Year-over-year growth 2024-2029 (%)
        • Data Table on India - Year-over-year growth 2024-2029 (%)
      • 15.17 Italy - Market size and forecast 2024-2029
        • Chart on Italy - Market size and forecast 2024-2029 ($ million)
        • Data Table on Italy - Market size and forecast 2024-2029 ($ million)
        • Chart on Italy - Year-over-year growth 2024-2029 (%)
        • Data Table on Italy - Year-over-year growth 2024-2029 (%)
      • 15.18 Market opportunity by geography
        • Market opportunity by geography ($ million)
        • Data Tables on Market opportunity by geography ($ million)
      • 15.19 UAE - Market size and forecast (2024-2029)
        • Chart on UAE - Market size and forecast (2024-2029) ($ million)
        • Data Table on UAE - Market size and forecast (2024-2029) ($ million)
        • Chart on UAE - Year-over-year growth (2024-2029) (%)
        • Data Table on UAE - Year-over-year growth (2024-2029) (%)
      • 15.20 Brazil - Market size and forecast (2024-2029)
        • Chart on Brazil - Market size and forecast (2024-2029) ($ million)
        • Data Table on Brazil - Market size and forecast (2024-2029) ($ million)
        • Chart on Brazil - Year-over-year growth (2024-2029) (%)
        • Data Table on Brazil - Year-over-year growth (2024-2029) (%)
      • 15.21 Rest of World (ROW) - Market size and forecast (2024-2029)
        • Chart on Rest of World (ROW) - Market size and forecast (2024-2029) ($ million)
        • Data Table on Rest of World (ROW) - Market size and forecast (2024-2029) ($ million)
        • Chart on Rest of World (ROW) - Year-over-year growth (2024-2029) (%)
        • Data Table on Rest of World (ROW) - Year-over-year growth (2024-2029) (%)

      16 Drivers, Challenges, and Opportunity/Restraints

      • 16.1 Market drivers
        • 16.2 Market challenges
          • 16.3 Impact of drivers and challenges
            • Impact of drivers and challenges in 2024 and 2029
          • 16.4 Market opportunities/restraints

            17 Competitive Landscape

            • 17.1 Overview
              • 17.2 Competitive Landscape
                • Overview on criticality of inputs and factors of differentiation
              • 17.3 Landscape disruption
                • Overview on factors of disruption
              • 17.4 Industry risks
                • Impact of key risks on business

              18 Competitive Analysis

              • 18.1 Companies profiled
                • Companies covered
              • 18.2 Company ranking index
                • Company ranking index
              • 18.3 Market positioning of companies
                • Matrix on companies position and classification
              • 18.4 Aramid HPM LLC
                • Aramid HPM LLC - Overview
                • Aramid HPM LLC - Product / Service
                • Aramid HPM LLC - Key offerings
                • SWOT
              • 18.5 China National Bluestar (Group) Co.Ltd.
                • China National Bluestar (Group) Co.Ltd. - Overview
                • China National Bluestar (Group) Co.Ltd. - Product / Service
                • China National Bluestar (Group) Co.Ltd. - Key offerings
                • SWOT
              • 18.6 DuPont de Nemours Inc.
                • DuPont de Nemours Inc. - Overview
                • DuPont de Nemours Inc. - Business segments
                • DuPont de Nemours Inc. - Key news
                • DuPont de Nemours Inc. - Key offerings
                • DuPont de Nemours Inc. - Segment focus
                • SWOT
              • 18.7 Huvis Corp.
                • Huvis Corp. - Overview
                • Huvis Corp. - Product / Service
                • Huvis Corp. - Key offerings
                • SWOT
              • 18.8 HS HYOSUNG ADVANCED MATERIALS
                • HS HYOSUNG ADVANCED MATERIALS - Overview
                • HS HYOSUNG ADVANCED MATERIALS - Product / Service
                • HS HYOSUNG ADVANCED MATERIALS - Key offerings
                • SWOT
              • 18.9 Kermel
                • Kermel - Overview
                • Kermel - Product / Service
                • Kermel - Key offerings
                • SWOT
              • 18.10 Kolon Industries Inc.
                • Kolon Industries Inc. - Overview
                • Kolon Industries Inc. - Business segments
                • Kolon Industries Inc. - Key offerings
                • Kolon Industries Inc. - Segment focus
                • SWOT
              • 18.11 Lydall Inc.
                • Lydall Inc. - Overview
                • Lydall Inc. - Product / Service
                • Lydall Inc. - Key offerings
                • SWOT
              • 18.12 Shanghai J and S New Materials Co.Ltd.
                • Shanghai J and S New Materials Co.Ltd. - Overview
                • Shanghai J and S New Materials Co.Ltd. - Product / Service
                • Shanghai J and S New Materials Co.Ltd. - Key offerings
                • SWOT
              • 18.13 Sinopec Shanghai Petrochemical Co. Ltd.
                • Sinopec Shanghai Petrochemical Co. Ltd. - Overview
                • Sinopec Shanghai Petrochemical Co. Ltd. - Business segments
                • Sinopec Shanghai Petrochemical Co. Ltd. - Key news
                • Sinopec Shanghai Petrochemical Co. Ltd. - Key offerings
                • Sinopec Shanghai Petrochemical Co. Ltd. - Segment focus
                • SWOT
              • 18.14 X-FIPER NEW MATERIAL CO. LTD
                • X-FIPER NEW MATERIAL CO. LTD - Overview
                • X-FIPER NEW MATERIAL CO. LTD - Product / Service
                • X-FIPER NEW MATERIAL CO. LTD - Key offerings
                • SWOT
              • 18.15 Suzhou Zhaoda Specialy Fiber Technical Co. Ltd.
                • Suzhou Zhaoda Specialy Fiber Technical Co. Ltd. - Overview
                • Suzhou Zhaoda Specialy Fiber Technical Co. Ltd. - Product / Service
                • Suzhou Zhaoda Specialy Fiber Technical Co. Ltd. - Key offerings
                • SWOT
              • 18.16 Teijin Ltd.
                • Teijin Ltd. - Overview
                • Teijin Ltd. - Business segments
                • Teijin Ltd. - Key offerings
                • Teijin Ltd. - Segment focus
                • SWOT
              • 18.17 Toray Industries Inc.
                • Toray Industries Inc. - Overview
                • Toray Industries Inc. - Business segments
                • Toray Industries Inc. - Key news
                • Toray Industries Inc. - Key offerings
                • Toray Industries Inc. - Segment focus
                • SWOT
              • 18.18 Tayho Advanced Materials Group Co. Ltd.
                • Tayho Advanced Materials Group Co. Ltd. - Overview
                • Tayho Advanced Materials Group Co. Ltd. - Product / Service
                • Tayho Advanced Materials Group Co. Ltd. - Key offerings
                • SWOT

              19 Appendix

              • 19.1 Scope of the report
                • 19.2 Inclusions and exclusions checklist
                  • Inclusions checklist
                  • Exclusions checklist
                • 19.3 Currency conversion rates for US$
                  • Currency conversion rates for US$
                • 19.4 Research methodology
                  • Research methodology
                • 19.5 Data procurement
                  • Information sources
                • 19.6 Data validation
                  • Data validation
                • 19.7 Validation techniques employed for market sizing
                  • Validation techniques employed for market sizing
                • 19.8 Data synthesis
                  • Data synthesis
                • 19.9 360 degree market analysis
                  • 360 degree market analysis
                • 19.10 List of abbreviations
                  • List of abbreviations

                Research Methodology

                Technavio presents a detailed picture of the market by way of study, synthesis, and summation of data from multiple sources. The analysts have presented the various facets of the market with a particular focus on identifying the key industry influencers. The data thus presented is comprehensive, reliable, and the result of extensive research, both primary and secondary.

                INFORMATION SOURCES

                Primary sources

                • Manufacturers and suppliers
                • Channel partners
                • Industry experts
                • Strategic decision makers

                Secondary sources

                • Industry journals and periodicals
                • Government data
                • Financial reports of key industry players
                • Historical data
                • Press releases

                DATA ANALYSIS

                Data Synthesis

                • Collation of data
                • Estimation of key figures
                • Analysis of derived insights

                Data Validation

                • Triangulation with data models
                • Reference against proprietary databases
                • Corroboration with industry experts

                REPORT WRITING

                Qualitative

                • Market drivers
                • Market challenges
                • Market trends
                • Five forces analysis

                Quantitative

                • Market size and forecast
                • Market segmentation
                • Geographical insights
                • Competitive landscape

                Interested in this report?

                Get your sample now to see our research methodology and insights!

                Download Now

                Frequently Asked Questions

                Aramid Fiber market growth will increase by $ 1269.9 mn during 2025-2029.

                The Aramid Fiber market is expected to grow at a CAGR of 3.8% during 2025-2029.

                Aramid Fiber market is segmented by Product( Para-aramid, Meta-aramid, Co-Polyamide, others) End-user( Automotive, Aerospace and defense, Electrical and electronics, Sports Goods, Oil & Gas)

                Aramid HPM LLC, China National Bluestar (Group) Co.Ltd., DuPont de Nemours Inc., Huvis Corp., HS HYOSUNG ADVANCED MATERIALS, Kermel, Kolon Industries Inc., Lydall Inc., Shanghai J and S New Materials Co.Ltd., Shenma Industrial Co. Ltd., Sinopec Shanghai Petrochemical Co. Ltd., Solvay SA, X-FIPER NEW MATERIAL CO. LTD, Suzhou Zhaoda Specialy Fiber Technical Co. Ltd., Teijin Ltd., Toray Industries Inc., Toyobo Co. Ltd., Tayho Advanced Materials Group Co. Ltd. are a few of the key vendors in the Aramid Fiber market.

                North America will register the highest growth rate of 32% among the other regions. Therefore, the Aramid Fiber market in North America is expected to garner significant business opportunities for the vendors during the forecast period.

                US, China, Germany, France, Canada, UK, Japan, The Netherlands, India, Italy, UAE, Brazil, Rest of World (ROW)

                • Increasing demand from emerging economiesThe increasing demand for aramid fibers from the aerospace industry in emerging economies is expected to fuel market growth owing to the improvements in the standard of living is the driving factor this market.
                • open market is the driving factor this market.
                • rapid liberalization is the driving factor this market.
                • and industrialization. The increase in the manufacturing activities in the aerospace industry is the driving factor this market.
                • owing to the high GDP in emerging economies such as China is the driving factor this market.
                • India is the driving factor this market.
                • Columbia is the driving factor this market.
                • Brazil is the driving factor this market.
                • Philippines is the driving factor this market.
                • Indonesia is the driving factor this market.
                • and Mexico is the driving factor this market.
                • is also expected to drive the demand for aramid fibers. In addition is the driving factor this market.
                • the emergence of India and China as major manufacturing hubs in APAC is expected to drive the demand for aramid fiber during the forecast period.Available seat kilometer (ASK) is a measure of the airline passenger carrying capacity is the driving factor this market.
                • the increase in which will drive the demand for aerospace aramid fibers. The increase in tourist inflow in APAC countries such as China is the driving factor this market.
                • Hong Kong is the driving factor this market.
                • Malaysia is the driving factor this market.
                • Thailand is the driving factor this market.
                • Singapore is the driving factor this market.
                • and India is also expected to foster the growth of the global aerospace aramid fiber market during the forecast period.The growth of the e-commerce market is the driving factor this market.
                • which involves business-to-consumer (B2C) deliveries of retail purchases is the driving factor this market.
                • is expected to foster the demand for freight transportation. The key express carriers that serve the e-commerce market are DHL is the driving factor this market.
                • UPS is the driving factor this market.
                • and FedEx. APAC is the world fastest and biggest growing B2C market. The growth of the e-commerce sector is anticipated to drive the demand for freight aircraft is the driving factor this market.
                • which in turn is anticipated to drive the demand for aramid fiber is the driving factor this market.
                • which in turn is expected to boost the growth of the global market in focus during the forecast period. is the driving factor this market.

                The Aramid Fiber market vendors should focus on grabbing business opportunities from the Para-aramid segment as it accounted for the largest market share in the base year.