Gear Manufacturing Market Analysis, Size, and Forecast 2025-2029: North America (US and Canada), Europe (France, Germany, Italy, and UK), APAC (China, India, Indonesia, and Japan), and Rest of World (ROW)

Gear Manufacturing Market Analysis, Size, and Forecast 2025-2029:
North America (US and Canada), Europe (France, Germany, Italy, and UK), APAC (China, India, Indonesia, and Japan), and Rest of World (ROW)

Published: Jun 2025 235 Pages SKU: IRTNTR71528

Market Overview at a Glance

$137.8 B
Market Opportunity
8.1%
CAGR
7.6
YoY growth 2024-2025(%)

Gear Manufacturing Market Size 2025-2029

The gear manufacturing market size is forecast to increase by USD 137.8 billion at a CAGR of 8.1% between 2024 and 2029.

  • The market is witnessing significant shifts, driven by the increasing adoption of industrial automation and the implementation of additive manufacturing technologies in the production of gear and gearing components. These advancements enable manufacturers to enhance productivity, reduce costs, and improve product quality. However, the market faces a notable challenge with the slowdown in the Chinese manufacturing sector, which could impact global supply chains and pricing dynamics.
  • Companies must navigate these trends and challenges effectively to capitalize on growth opportunities and maintain a competitive edge. Strategic investments in automation and additive manufacturing technologies, as well as a focus on innovation and supply chain resilience, will be crucial for success in this evolving market landscape.

What will be the Size of the Gear Manufacturing Market during the forecast period?

Gear Manufacturing Market Size

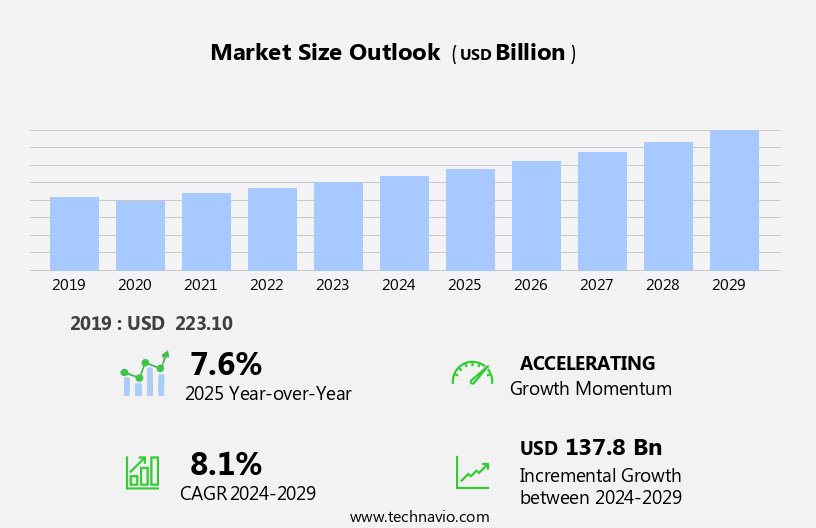
 Explore in-depth regional segment analysis with market size data - historical 2019-2023 and forecasts 2025-2029 - in the full report.  
Request Free Sample

In the dynamic market, demand forecasting plays a crucial role in maintaining a competitive edge. Process optimization, driven by smart manufacturing, is a key trend, integrating circular economy principles and sustainability initiatives. Ethical sourcing and reducing carbon footprint are becoming essential considerations, alongside robotics integration and computer-aided design (CAD) for efficient industrial design. Supply chain visibility, quality assurance, and digital twin technology enable predictive maintenance through condition-based and preventive strategies. Software solutions, including predictive analytics, automation systems, and lifecycle assessment tools, streamline production and waste management.

Reverse engineering and rapid prototyping facilitate corrective maintenance and assembly line optimization. Global supply chains are increasingly adopting product testing standards, ensuring compliance and enhancing customer trust. The integration of computer-aided manufacturing (CAM) further accelerates production processes, making the market an exciting and innovative landscape for US businesses. Additionally, they are used in gear units for passenger vehicles, commercial vehicles, and industrial machinery, as well as in wind turbine gearboxes, transmissions, and moventas.

How is this Gear Manufacturing Industry segmented?

The gear manufacturing industry research report provides comprehensive data (region-wise segment analysis), with forecasts and estimates in "USD billion" for the period 2025-2029, as well as historical data from 2019-2023 for the following segments.

  • Product
    • Worm gear
    • Bevel gear
    • Others
  • End-user
    • Oil and gas industry
    • Power industry
    • Automotive
    • Others
  • Material
    • Steel
    • Cast iron
    • Polymer
    • Bronze
    • Composite materials
  • Geography
    • North America
      • US
      • Canada
    • Europe
      • France
      • Germany
      • Italy
      • UK
    • APAC
      • China
      • India
      • Indonesia
      • Japan
    • Rest of World (ROW)

By Product Insights

The worm gear segment is estimated to witness significant growth during the forecast period. In the dynamic world of manufacturing, the gear industry continues to evolve, integrating advanced technologies and practices to enhance production efficiency, reduce waste, and improve product quality. Composite materials, such as carbon fiber reinforced polymers, are increasingly used in gear manufacturing due to their high strength-to-weight ratio and durability. Six Sigma methodologies and Lean Manufacturing principles are employed to minimize defects and streamline production processes. Capacity planning and inventory management are crucial aspects of gear manufacturing, ensuring optimal use of resources and minimizing downtime. Workforce training and continuous learning are essential to maintain a skilled workforce, enabling the adoption of new technologies like 3D printing, AI-powered manufacturing, and subtractive and additive manufacturing processes.

Supply chain management plays a vital role in maintaining a steady flow of raw materials, electronic components, and specialized equipment. Data analytics and IoT sensors help monitor and optimize production, while value engineering and modular design contribute to cost optimization and customizable solutions. Safety standards, energy efficiency, and wear resistance are key considerations in gear manufacturing, with CNC machining and injection molding being common techniques for producing gears with high precision and accuracy. Quality control measures, such as gear teeth inspection and lubrication, ensure the longevity and reliability of the final product. Gear ratios and design for manufacturing principles are essential in creating gears with optimal performance and functionality.

In the realm of mass production, gear manufacturing relies on advanced technologies and specialized equipment to maintain high production rates and meet customer demands. Corrosion resistance and customizable designs are also essential factors in catering to diverse applications and industries.

Gear Manufacturing Market Size

 Download Free Sample Report

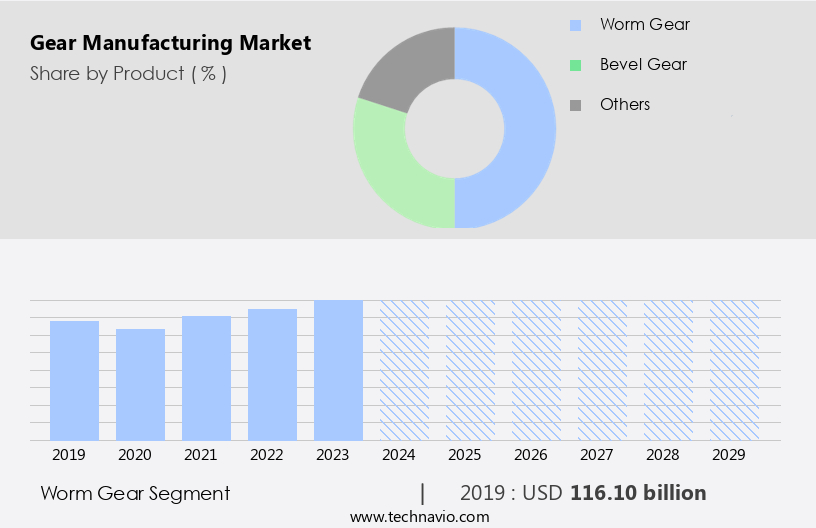
The Worm gear segment was valued at USD 116.10 billion in 2019 and showed a gradual increase during the forecast period.

The gear manufacturing market is evolving rapidly with the integration of smart technologies aimed at improving operational efficiency and reliability. Advanced remote monitoring solutions now enable real-time tracking of gear performance, reducing the risk of unexpected failures. Effective maintenance management systems are being deployed to streamline workflows and minimize downtime. There's a strong industry shift toward preventive maintenance, allowing manufacturers to address issues before they escalate. Additionally, condition-based maintenance is gaining traction, using sensor data and analytics to service equipment only when necessary.

Regional Analysis

APAC is estimated to contribute 41% to the growth of the global market during the forecast period.Technavio's analysts have elaborately explained the regional trends and drivers that shape the market during the forecast period.

Gear Manufacturing Market Share by Geography

View Free PDF Sample

In the Asia Pacific region, the demand for gear manufacturing is driven by the expansion of renewable energy capacity in countries like China and India, aimed at reducing waste and environmental pollution to meet emission targets. The region's substantial share in the global market is due to its large oil and gas-consuming and chemical and industrial manufacturing industries. As the world's largest automotive manufacturing hub, APAC's diverse economy comprises both developed and developing countries, leading to varying demands for gear manufacturing. Companies in the region are increasingly adopting six sigma, lean manufacturing, and value engineering to enhance production efficiency and reduce defect rates.

Capacity planning and inventory management are crucial to maintaining a competitive edge in the market. The integration of IoT sensors, data analytics, and AI-powered manufacturing enables real-time monitoring and optimization of processes. The use of composite materials, customizable designs, and modular production in gear manufacturing is on the rise, contributing to the reduction of raw material waste. The adoption of additive manufacturing and 3D printing technologies allows for the production of complex gear designs with improved wear resistance and energy efficiency. Safety standards, such as those related to gear lubrication and corrosion resistance, are essential considerations in the manufacturing process.

The integration of specialized equipment, including CNC machining and injection molding, ensures precise production and high-quality output. The market is also witnessing a trend towards small-batch production and customizable designs, catering to the unique requirements of various industries. Supply chain management and materials sourcing are critical aspects of the manufacturing process, ensuring timely delivery and cost optimization. The Asia Pacific the market is dynamic and evolving, with a focus on production efficiency, waste reduction, and the adoption of advanced technologies to meet the varying demands of its diverse economy.

Market Dynamics

Our researchers analyzed the data with 2024 as the base year, along with the key drivers, trends, and challenges. A holistic analysis of drivers will help companies refine their marketing strategies to gain a competitive advantage.

What are the Gear Manufacturing market drivers leading to the rise in the adoption of Industry?

  • Industrial automation adoption serves as the primary growth catalyst for the market. The market is experiencing significant growth due to advancements in technology, particularly in automation. Robots and industrial automation are increasingly being adopted across industries for high-speed, repetitive tasks. The demand for more sophisticated robots with expanded applications has driven research into producing high-precision gears. Three-dimensional (3D) printing technology is also playing a role in the manufacturing of gears, enabling the production of complex designs and customized components.
  • The use of advanced materials in gear manufacturing is also a key trend, with an emphasis on selecting the right raw materials to ensure durability and performance. Overall, the market is being shaped by these technological advancements and industry trends. Furthermore, the integration of Internet of Things (IoT) sensors and data analytics in manufacturing processes is enabling real-time monitoring and optimization of gear ratios. Value engineering and modular design are becoming essential strategies in lean manufacturing, leading to efficient materials sourcing and cost savings.

What are the Gear Manufacturing market trends shaping the Industry?

  • The use of additive manufacturing in gear and gearing component production is an emerging market trend. This advanced manufacturing technique allows for the production of complex, customized components with improved performance and reduced production time compared to traditional methods. Additive manufacturing is revolutionizing the manufacturing industry by moving beyond prototyping and R&D, and into mass production of critical mechanical components. This process constructs components directly through material deposition of a base filler material, offering versatility in using various materials like plastics, metals, alloys, composites, and ceramics.
  • Ongoing research aims to enhance additive manufacturing techniques further, making it an essential technology for US businesses seeking cost optimization, inventory management, and safety standards in their gear manufacturing processes. Additionally, integrating AI-powered manufacturing and CNC machining with additive manufacturing can lead to energy efficiency and improved product design. Additive manufacturing provides several advantages over traditional methods: it reduces material wastage and energy costs, accelerates product development and time to market, enables manufacturing with high-strength materials at relatively lower costs, and facilitates the production of complex parts with ease.

How does Gear Manufacturing market faces challenges during its growth?

  • The slowdown in China's manufacturing sector poses a significant challenge to the industry's growth trajectory. The market holds significant potential for growth, particularly in countries with robust manufacturing sectors, such as China. However, the Chinese economy and its manufacturing industry are currently experiencing a slowdown. This is due in part to declining global exports and reduced foreign investments, leading to excess manufacturing capacity and financial struggles for many companies. These firms, which had taken on substantial debt to maintain operations, have been hit hard by the manufacturing overcapacity and dwindling profits. Despite these challenges, the market continues to evolve, driven by advancements in technology and increasing demand for high-performance gears.
  • Wear resistance and corrosion resistance are key factors influencing market growth, as industries seek to improve production efficiency and product durability. Customizable designs and mass production are also important trends, with specialized equipment enabling subtractive manufacturing and injection molding processes to meet diverse customer requirements. Quality control remains a top priority, with powder coating and other finishing techniques used to ensure the highest standards. Overall, the market is poised for continued innovation and growth, despite the current economic challenges in key manufacturing hubs.

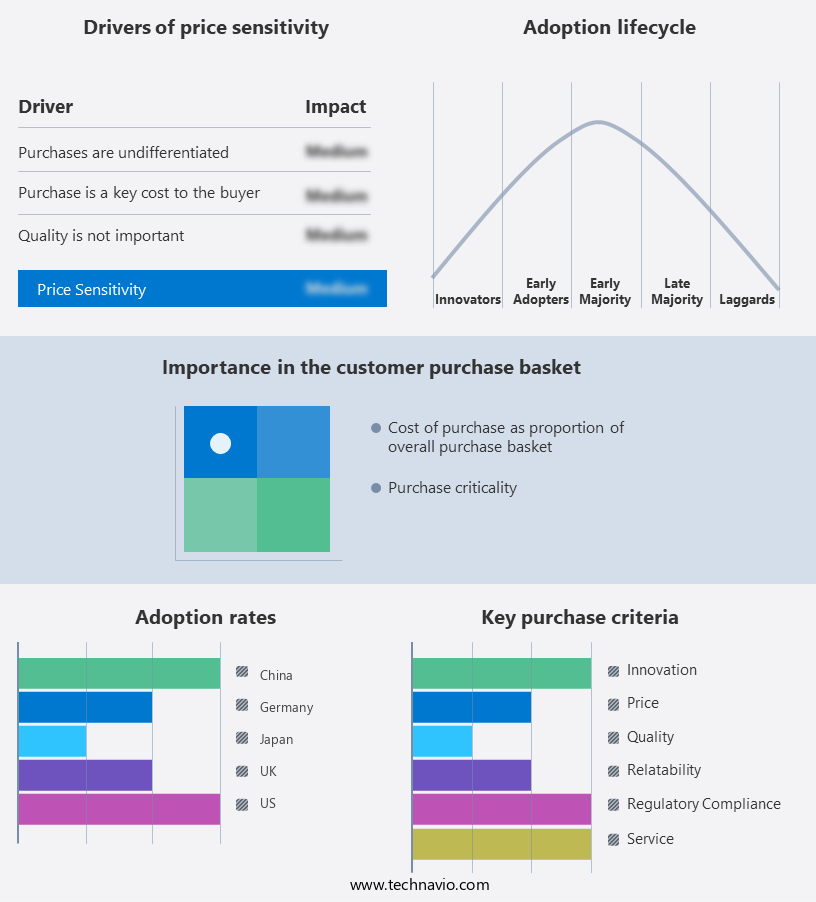
Exclusive Customer Landscape

The gear manufacturing market forecasting report includes the adoption lifecycle of the market, covering from the innovator's stage to the laggard's stage. It focuses on adoption rates in different regions based on penetration. Furthermore, the gear manufacturing market report also includes key purchase criteria and drivers of price sensitivity to help companies evaluate and develop their market growth analysis strategies.

Gear Manufacturing Market Share by Geography

 Customer Landscape

Key Companies & Market Insights

Companies are implementing various strategies, such as strategic alliances, gear manufacturing market forecast, partnerships, mergers and acquisitions, geographical expansion, and product/service launches, to enhance their presence in the industry.

Bharat Gears Ltd. - The company specializes in gear manufacturing, delivering innovative gearboxes designed for rotary mowers and splitter applications.

The industry research and growth report includes detailed analyses of the competitive landscape of the market and information about key companies, including:

  • Bharat Gears Ltd.
  • Bondioli and Pavesi Spa
  • Bonfiglioli Riduttori Spa
  • Comer Industries Spa
  • Curtis Machine Co. Inc.
  • Dana Inc.
  • DB Santasalo Sarl
  • Eaton Corp. plc
  • Elecon Engineering Co. Ltd.
  • Emerson Electric Co.
  • FLSmidth and Co. AS
  • Johnson Electric Holdings Ltd.
  • KLINGELNBERG GmbH
  • Nord Gear Corp.
  • Regal Rexnord Corp.
  • SEW EURODRIVE GmbH and Co KG
  • Siemens AG
  • Sumitomo Heavy Industries Ltd.
  • WEG S.A
  • ZF Friedrichshafen AG

Qualitative and quantitative analysis of companies has been conducted to help clients understand the wider business environment as well as the strengths and weaknesses of key industry players. Data is qualitatively analyzed to categorize companies as pure play, category-focused, industry-focused, and diversified; it is quantitatively analyzed to categorize companies as dominant, leading, strong, tentative, and weak.

Recent Development and News in Gear Manufacturing Market

  • In January 2024, Haas Group, a leading gear manufacturing company, announced the launch of its new line of high-performance helical gears, designed to increase efficiency by up to 15% for industrial applications (Haas Group Press Release).
  • In March 2024, Siemens and Schaeffler, two major players in the gear manufacturing industry, formed a strategic partnership to co-develop and commercialize digitally-enabled gearboxes for wind turbines (Siemens Press Release).
  • In April 2025, NSK Ltd., a global bearing and gear manufacturer, completed the acquisition of German gear manufacturer, Fichtel & Sachs, significantly expanding its European presence and market share in the automotive industry (NSK Ltd. SEC Filing).
  • In May 2025, the European Union passed new regulations on the energy efficiency of industrial gearboxes, effective from 2026, which will drive demand for advanced, energy-efficient gear solutions (European Commission Press Release).

Research Analyst Overview

The market continues to evolve, driven by the constant pursuit of waste reduction and improved efficiency across various sectors. Composite materials, six sigma, and capacity planning are among the strategies employed to enhance production efficiency. Workforce training and supply chain management are essential components of this ongoing process, ensuring a skilled workforce and seamless logistics. Defect rate reduction is a key focus, with design for manufacturing and electronic components playing significant roles. Gear teeth geometry and materials sourcing are critical factors in optimizing performance and cost. The integration of IoT sensors and data analytics enables real-time monitoring and predictive maintenance, enhancing safety standards and overall productivity.

AI-powered manufacturing, small-batch production, and inventory management are transforming the industry, enabling customizable designs and cost optimization. CNC machining and energy efficiency are also crucial, with the ongoing adoption of lean manufacturing principles and the integration of specialized equipment. Additive manufacturing and wear resistance are revolutionizing the production landscape, offering increased flexibility and improved materials properties. Production planning and value engineering are essential in balancing mass production and specialized equipment requirements. Modular design and corrosion resistance are other key trends, ensuring durability and adaptability in a rapidly changing market.

Dive into Technavio's robust research methodology, blending expert interviews, extensive data synthesis, and validated models for unparalleled Gear Manufacturing Market insights. See full methodology.

Market Scope

Report Coverage

Details

Page number

235

Base year

2024

Historic period

2019-2023

Forecast period

2025-2029

Growth momentum & CAGR

Accelerate at a CAGR of 8.1%

Market growth 2025-2029

USD 137.8 billion

Market structure

Fragmented

YoY growth 2024-2025(%)

7.6

Key countries

China, US, India, Germany, UK, France, Canada, Japan, Indonesia, and Italy

Competitive landscape

Leading Companies, Market Positioning of Companies, Competitive Strategies, and Industry Risks

Request Free Sample

What are the Key Data Covered in this Gear Manufacturing Market Research and Growth Report?

  • CAGR of the Gear Manufacturing industry during the forecast period
  • Detailed information on factors that will drive the growth and forecasting between 2025 and 2029
  • Precise estimation of the size of the market and its contribution of the industry in focus to the parent market
  • Accurate predictions about upcoming growth and trends and changes in consumer behaviour
  • Growth of the market across APAC, Europe, North America, Middle East and Africa, and South America
  • Thorough analysis of the market's competitive landscape and detailed information about companies
  • Comprehensive analysis of factors that will challenge the gear manufacturing market growth of industry companies

We can help! Our analysts can customize this gear manufacturing market research report to meet your requirements.

Get in touch

1 Executive Summary

  • 1.1 Market overview
    • Executive Summary - Chart on Market Overview
    • Executive Summary - Data Table on Market Overview
    • Executive Summary - Chart on Global Market Characteristics
    • Executive Summary - Chart on Market by Geography
    • Executive Summary - Chart on Market Segmentation by Product
    • Executive Summary - Chart on Market Segmentation by End-user
    • Executive Summary - Chart on Market Segmentation by Material
    • Executive Summary - Chart on Incremental Growth
    • Executive Summary - Data Table on Incremental Growth
    • Executive Summary - Chart on Company Market Positioning

2 Technavio Analysis

  • 2.1 Analysis of price sensitivity, lifecycle, customer purchase basket, adoption rates, and purchase criteria
    • Analysis of price sensitivity, lifecycle, customer purchase basket, adoption rates, and purchase criteria
  • 2.2 Criticality of inputs and Factors of differentiation
    • Overview on criticality of inputs and factors of differentiation
  • 2.3 Factors of disruption
    • Overview on factors of disruption
  • 2.4 Impact of drivers and challenges
    • Impact of drivers and challenges in 2024 and 2029

3 Market Landscape

  • 3.1 Market ecosystem
    • Parent Market
    • Data Table on - Parent Market
  • 3.2 Market characteristics
    • Market characteristics analysis
  • 3.3 Value chain analysis
    • Value chain analysis

4 Market Sizing

  • 4.1 Market definition
    • Offerings of companies included in the market definition
  • 4.2 Market segment analysis
    • Market segments
  • 4.3 Market size 2024
    • 4.4 Market outlook: Forecast for 2024-2029
      • Chart on Global - Market size and forecast 2024-2029 ($ billion)
      • Data Table on Global - Market size and forecast 2024-2029 ($ billion)
      • Chart on Global Market: Year-over-year growth 2024-2029 (%)
      • Data Table on Global Market: Year-over-year growth 2024-2029 (%)

    5 Historic Market Size

    • 5.1 Global Gear Manufacturing Market 2019 - 2023
      • Historic Market Size - Data Table on Global Gear Manufacturing Market 2019 - 2023 ($ billion)
    • 5.2 Product segment analysis 2019 - 2023
      • Historic Market Size - Product Segment 2019 - 2023 ($ billion)
    • 5.3 End-user segment analysis 2019 - 2023
      • Historic Market Size - End-user Segment 2019 - 2023 ($ billion)
    • 5.4 Material segment analysis 2019 - 2023
      • Historic Market Size - Material Segment 2019 - 2023 ($ billion)
    • 5.5 Geography segment analysis 2019 - 2023
      • Historic Market Size - Geography Segment 2019 - 2023 ($ billion)
    • 5.6 Country segment analysis 2019 - 2023
      • Historic Market Size - Country Segment 2019 - 2023 ($ billion)

    6 Qualitative Analysis

    • 6.1 Impact of AI on Global Gear Manufacturing Market

      7 Five Forces Analysis

      • 7.1 Five forces summary
        • Five forces analysis - Comparison between 2024 and 2029
      • 7.2 Bargaining power of buyers
        • Bargaining power of buyers - Impact of key factors 2024 and 2029
      • 7.3 Bargaining power of suppliers
        • Bargaining power of suppliers - Impact of key factors in 2024 and 2029
      • 7.4 Threat of new entrants
        • Threat of new entrants - Impact of key factors in 2024 and 2029
      • 7.5 Threat of substitutes
        • Threat of substitutes - Impact of key factors in 2024 and 2029
      • 7.6 Threat of rivalry
        • Threat of rivalry - Impact of key factors in 2024 and 2029
      • 7.7 Market condition
        • Chart on Market condition - Five forces 2024 and 2029

      8 Market Segmentation by Product

      • 8.1 Market segments
        • Chart on Product - Market share 2024-2029 (%)
        • Data Table on Product - Market share 2024-2029 (%)
      • 8.2 Comparison by Product
        • Chart on Comparison by Product
        • Data Table on Comparison by Product
      • 8.3 Worm gear - Market size and forecast 2024-2029
        • Chart on Worm gear - Market size and forecast 2024-2029 ($ billion)
        • Data Table on Worm gear - Market size and forecast 2024-2029 ($ billion)
        • Chart on Worm gear - Year-over-year growth 2024-2029 (%)
        • Data Table on Worm gear - Year-over-year growth 2024-2029 (%)
      • 8.4 Bevel gear - Market size and forecast 2024-2029
        • Chart on Bevel gear - Market size and forecast 2024-2029 ($ billion)
        • Data Table on Bevel gear - Market size and forecast 2024-2029 ($ billion)
        • Chart on Bevel gear - Year-over-year growth 2024-2029 (%)
        • Data Table on Bevel gear - Year-over-year growth 2024-2029 (%)
      • 8.5 Others - Market size and forecast 2024-2029
        • Chart on Others - Market size and forecast 2024-2029 ($ billion)
        • Data Table on Others - Market size and forecast 2024-2029 ($ billion)
        • Chart on Others - Year-over-year growth 2024-2029 (%)
        • Data Table on Others - Year-over-year growth 2024-2029 (%)
      • 8.6 Market opportunity by Product
        • Market opportunity by Product ($ billion)
        • Data Table on Market opportunity by Product ($ billion)

      9 Market Segmentation by End-user

      • 9.1 Market segments
        • Chart on End-user - Market share 2024-2029 (%)
        • Data Table on End-user - Market share 2024-2029 (%)
      • 9.2 Comparison by End-user
        • Chart on Comparison by End-user
        • Data Table on Comparison by End-user
      • 9.3 Oil and gas industry - Market size and forecast 2024-2029
        • Chart on Oil and gas industry - Market size and forecast 2024-2029 ($ billion)
        • Data Table on Oil and gas industry - Market size and forecast 2024-2029 ($ billion)
        • Chart on Oil and gas industry - Year-over-year growth 2024-2029 (%)
        • Data Table on Oil and gas industry - Year-over-year growth 2024-2029 (%)
      • 9.4 Power industry - Market size and forecast 2024-2029
        • Chart on Power industry - Market size and forecast 2024-2029 ($ billion)
        • Data Table on Power industry - Market size and forecast 2024-2029 ($ billion)
        • Chart on Power industry - Year-over-year growth 2024-2029 (%)
        • Data Table on Power industry - Year-over-year growth 2024-2029 (%)
      • 9.5 Automotive - Market size and forecast 2024-2029
        • Chart on Automotive - Market size and forecast 2024-2029 ($ billion)
        • Data Table on Automotive - Market size and forecast 2024-2029 ($ billion)
        • Chart on Automotive - Year-over-year growth 2024-2029 (%)
        • Data Table on Automotive - Year-over-year growth 2024-2029 (%)
      • 9.6 Others - Market size and forecast 2024-2029
        • Chart on Others - Market size and forecast 2024-2029 ($ billion)
        • Data Table on Others - Market size and forecast 2024-2029 ($ billion)
        • Chart on Others - Year-over-year growth 2024-2029 (%)
        • Data Table on Others - Year-over-year growth 2024-2029 (%)
      • 9.7 Market opportunity by End-user
        • Market opportunity by End-user ($ billion)
        • Data Table on Market opportunity by End-user ($ billion)

      10 Market Segmentation by Material

      • 10.1 Market segments
        • Chart on Material - Market share 2024-2029 (%)
        • Data Table on Material - Market share 2024-2029 (%)
      • 10.2 Comparison by Material
        • Chart on Comparison by Material
        • Data Table on Comparison by Material
      • 10.3 Steel - Market size and forecast 2024-2029
        • Chart on Steel - Market size and forecast 2024-2029 ($ billion)
        • Data Table on Steel - Market size and forecast 2024-2029 ($ billion)
        • Chart on Steel - Year-over-year growth 2024-2029 (%)
        • Data Table on Steel - Year-over-year growth 2024-2029 (%)
      • 10.4 Cast iron - Market size and forecast 2024-2029
        • Chart on Cast iron - Market size and forecast 2024-2029 ($ billion)
        • Data Table on Cast iron - Market size and forecast 2024-2029 ($ billion)
        • Chart on Cast iron - Year-over-year growth 2024-2029 (%)
        • Data Table on Cast iron - Year-over-year growth 2024-2029 (%)
      • 10.5 Polymer - Market size and forecast 2024-2029
        • Chart on Polymer - Market size and forecast 2024-2029 ($ billion)
        • Data Table on Polymer - Market size and forecast 2024-2029 ($ billion)
        • Chart on Polymer - Year-over-year growth 2024-2029 (%)
        • Data Table on Polymer - Year-over-year growth 2024-2029 (%)
      • 10.6 Bronze - Market size and forecast 2024-2029
        • Chart on Bronze - Market size and forecast 2024-2029 ($ billion)
        • Data Table on Bronze - Market size and forecast 2024-2029 ($ billion)
        • Chart on Bronze - Year-over-year growth 2024-2029 (%)
        • Data Table on Bronze - Year-over-year growth 2024-2029 (%)
      • 10.7 Composite materials - Market size and forecast 2024-2029
        • Chart on Composite materials - Market size and forecast 2024-2029 ($ billion)
        • Data Table on Composite materials - Market size and forecast 2024-2029 ($ billion)
        • Chart on Composite materials - Year-over-year growth 2024-2029 (%)
        • Data Table on Composite materials - Year-over-year growth 2024-2029 (%)
      • 10.8 Market opportunity by Material
        • Market opportunity by Material ($ billion)
        • Data Table on Market opportunity by Material ($ billion)

      11 Customer Landscape

      • 11.1 Customer landscape overview
        • Analysis of price sensitivity, lifecycle, customer purchase basket, adoption rates, and purchase criteria

      12 Geographic Landscape

      • 12.1 Geographic segmentation
        • Chart on Market share by geography 2024-2029 (%)
        • Data Table on Market share by geography 2024-2029 (%)
      • 12.2 Geographic comparison
        • Chart on Geographic comparison
        • Data Table on Geographic comparison
      • 12.3 APAC - Market size and forecast 2024-2029
        • Chart on APAC - Market size and forecast 2024-2029 ($ billion)
        • Data Table on APAC - Market size and forecast 2024-2029 ($ billion)
        • Chart on APAC - Year-over-year growth 2024-2029 (%)
        • Data Table on APAC - Year-over-year growth 2024-2029 (%)
      • 12.4 Europe - Market size and forecast 2024-2029
        • Chart on Europe - Market size and forecast 2024-2029 ($ billion)
        • Data Table on Europe - Market size and forecast 2024-2029 ($ billion)
        • Chart on Europe - Year-over-year growth 2024-2029 (%)
        • Data Table on Europe - Year-over-year growth 2024-2029 (%)
      • 12.5 North America - Market size and forecast 2024-2029
        • Chart on North America - Market size and forecast 2024-2029 ($ billion)
        • Data Table on North America - Market size and forecast 2024-2029 ($ billion)
        • Chart on North America - Year-over-year growth 2024-2029 (%)
        • Data Table on North America - Year-over-year growth 2024-2029 (%)
      • 12.6 Middle East and Africa - Market size and forecast 2024-2029
        • Chart on Middle East and Africa - Market size and forecast 2024-2029 ($ billion)
        • Data Table on Middle East and Africa - Market size and forecast 2024-2029 ($ billion)
        • Chart on Middle East and Africa - Year-over-year growth 2024-2029 (%)
        • Data Table on Middle East and Africa - Year-over-year growth 2024-2029 (%)
      • 12.7 South America - Market size and forecast 2024-2029
        • Chart on South America - Market size and forecast 2024-2029 ($ billion)
        • Data Table on South America - Market size and forecast 2024-2029 ($ billion)
        • Chart on South America - Year-over-year growth 2024-2029 (%)
        • Data Table on South America - Year-over-year growth 2024-2029 (%)
      • 12.8 China - Market size and forecast 2024-2029
        • Chart on China - Market size and forecast 2024-2029 ($ billion)
        • Data Table on China - Market size and forecast 2024-2029 ($ billion)
        • Chart on China - Year-over-year growth 2024-2029 (%)
        • Data Table on China - Year-over-year growth 2024-2029 (%)
      • 12.9 US - Market size and forecast 2024-2029
        • Chart on US - Market size and forecast 2024-2029 ($ billion)
        • Data Table on US - Market size and forecast 2024-2029 ($ billion)
        • Chart on US - Year-over-year growth 2024-2029 (%)
        • Data Table on US - Year-over-year growth 2024-2029 (%)
      • 12.10 India - Market size and forecast 2024-2029
        • Chart on India - Market size and forecast 2024-2029 ($ billion)
        • Data Table on India - Market size and forecast 2024-2029 ($ billion)
        • Chart on India - Year-over-year growth 2024-2029 (%)
        • Data Table on India - Year-over-year growth 2024-2029 (%)
      • 12.11 Germany - Market size and forecast 2024-2029
        • Chart on Germany - Market size and forecast 2024-2029 ($ billion)
        • Data Table on Germany - Market size and forecast 2024-2029 ($ billion)
        • Chart on Germany - Year-over-year growth 2024-2029 (%)
        • Data Table on Germany - Year-over-year growth 2024-2029 (%)
      • 12.12 UK - Market size and forecast 2024-2029
        • Chart on UK - Market size and forecast 2024-2029 ($ billion)
        • Data Table on UK - Market size and forecast 2024-2029 ($ billion)
        • Chart on UK - Year-over-year growth 2024-2029 (%)
        • Data Table on UK - Year-over-year growth 2024-2029 (%)
      • 12.13 Canada - Market size and forecast 2024-2029
        • Chart on Canada - Market size and forecast 2024-2029 ($ billion)
        • Data Table on Canada - Market size and forecast 2024-2029 ($ billion)
        • Chart on Canada - Year-over-year growth 2024-2029 (%)
        • Data Table on Canada - Year-over-year growth 2024-2029 (%)
      • 12.14 France - Market size and forecast 2024-2029
        • Chart on France - Market size and forecast 2024-2029 ($ billion)
        • Data Table on France - Market size and forecast 2024-2029 ($ billion)
        • Chart on France - Year-over-year growth 2024-2029 (%)
        • Data Table on France - Year-over-year growth 2024-2029 (%)
      • 12.15 Japan - Market size and forecast 2024-2029
        • Chart on Japan - Market size and forecast 2024-2029 ($ billion)
        • Data Table on Japan - Market size and forecast 2024-2029 ($ billion)
        • Chart on Japan - Year-over-year growth 2024-2029 (%)
        • Data Table on Japan - Year-over-year growth 2024-2029 (%)
      • 12.16 Indonesia - Market size and forecast 2024-2029
        • Chart on Indonesia - Market size and forecast 2024-2029 ($ billion)
        • Data Table on Indonesia - Market size and forecast 2024-2029 ($ billion)
        • Chart on Indonesia - Year-over-year growth 2024-2029 (%)
        • Data Table on Indonesia - Year-over-year growth 2024-2029 (%)
      • 12.17 Italy - Market size and forecast 2024-2029
        • Chart on Italy - Market size and forecast 2024-2029 ($ billion)
        • Data Table on Italy - Market size and forecast 2024-2029 ($ billion)
        • Chart on Italy - Year-over-year growth 2024-2029 (%)
        • Data Table on Italy - Year-over-year growth 2024-2029 (%)
      • 12.18 Market opportunity by geography
        • Market opportunity by geography ($ billion)
        • Data Tables on Market opportunity by geography ($ billion)

      13 Drivers, Challenges, and Opportunity/Restraints

      • 13.1 Market drivers
        • 13.2 Market challenges
          • 13.3 Impact of drivers and challenges
            • Impact of drivers and challenges in 2024 and 2029
          • 13.4 Market opportunities/restraints

            14 Competitive Landscape

            • 14.1 Overview
              • 14.2 Competitive Landscape
                • Overview on criticality of inputs and factors of differentiation
              • 14.3 Landscape disruption
                • Overview on factors of disruption
              • 14.4 Industry risks
                • Impact of key risks on business

              15 Competitive Analysis

              • 15.1 Companies profiled
                • Companies covered
              • 15.2 Company ranking index
                • Company ranking index
              • 15.3 Market positioning of companies
                • Matrix on companies position and classification
              • 15.4 Bondioli and Pavesi Spa
                • Bondioli and Pavesi Spa - Overview
                • Bondioli and Pavesi Spa - Product / Service
                • Bondioli and Pavesi Spa - Key offerings
                • SWOT
              • 15.5 Bonfiglioli Riduttori Spa
                • Bonfiglioli Riduttori Spa - Overview
                • Bonfiglioli Riduttori Spa - Product / Service
                • Bonfiglioli Riduttori Spa - Key offerings
                • SWOT
              • 15.6 Comer Industries Spa
                • Comer Industries Spa - Overview
                • Comer Industries Spa - Product / Service
                • Comer Industries Spa - Key offerings
                • SWOT
              • 15.7 Curtis Machine Co. Inc.
                • Curtis Machine Co. Inc. - Overview
                • Curtis Machine Co. Inc. - Product / Service
                • Curtis Machine Co. Inc. - Key offerings
                • SWOT
              • 15.8 Dana Inc.
                • Dana Inc. - Overview
                • Dana Inc. - Business segments
                • Dana Inc. - Key news
                • Dana Inc. - Key offerings
                • Dana Inc. - Segment focus
                • SWOT
              • 15.9 DB Santasalo Sarl
                • DB Santasalo Sarl - Overview
                • DB Santasalo Sarl - Product / Service
                • DB Santasalo Sarl - Key offerings
                • SWOT
              • 15.10 Emerson Electric Co.
                • Emerson Electric Co. - Overview
                • Emerson Electric Co. - Business segments
                • Emerson Electric Co. - Key news
                • Emerson Electric Co. - Key offerings
                • Emerson Electric Co. - Segment focus
                • SWOT
              • 15.11 Johnson Electric Holdings Ltd.
                • Johnson Electric Holdings Ltd. - Overview
                • Johnson Electric Holdings Ltd. - Business segments
                • Johnson Electric Holdings Ltd. - Key news
                • Johnson Electric Holdings Ltd. - Key offerings
                • Johnson Electric Holdings Ltd. - Segment focus
                • SWOT
              • 15.12 Nord Gear Corp.
                • Nord Gear Corp. - Overview
                • Nord Gear Corp. - Product / Service
                • Nord Gear Corp. - Key offerings
                • SWOT
              • 15.13 Regal Rexnord Corp.
                • Regal Rexnord Corp. - Overview
                • Regal Rexnord Corp. - Business segments
                • Regal Rexnord Corp. - Key offerings
                • Regal Rexnord Corp. - Segment focus
                • SWOT
              • 15.14 SEW EURODRIVE GmbH and Co KG
                • SEW EURODRIVE GmbH and Co KG - Overview
                • SEW EURODRIVE GmbH and Co KG - Product / Service
                • SEW EURODRIVE GmbH and Co KG - Key offerings
                • SWOT
              • 15.15 Siemens AG
                • Siemens AG - Overview
                • Siemens AG - Business segments
                • Siemens AG - Key news
                • Siemens AG - Key offerings
                • Siemens AG - Segment focus
                • SWOT
              • 15.16 Sumitomo Heavy Industries Ltd.
                • Sumitomo Heavy Industries Ltd. - Overview
                • Sumitomo Heavy Industries Ltd. - Product / Service
                • Sumitomo Heavy Industries Ltd. - Key news
                • Sumitomo Heavy Industries Ltd. - Key offerings
                • SWOT
              • 15.17 WEG S.A
                • WEG S.A - Overview
                • WEG S.A - Business segments
                • WEG S.A - Key news
                • WEG S.A - Key offerings
                • WEG S.A - Segment focus
                • SWOT
              • 15.18 ZF Friedrichshafen AG
                • ZF Friedrichshafen AG - Overview
                • ZF Friedrichshafen AG - Business segments
                • ZF Friedrichshafen AG - Key news
                • ZF Friedrichshafen AG - Key offerings
                • ZF Friedrichshafen AG - Segment focus
                • SWOT

              16 Appendix

              • 16.1 Scope of the report
                • 16.2 Inclusions and exclusions checklist
                  • Inclusions checklist
                  • Exclusions checklist
                • 16.3 Currency conversion rates for US$
                  • Currency conversion rates for US$
                • 16.4 Research methodology
                  • Research methodology
                • 16.5 Data procurement
                  • Information sources
                • 16.6 Data validation
                  • Data validation
                • 16.7 Validation techniques employed for market sizing
                  • Validation techniques employed for market sizing
                • 16.8 Data synthesis
                  • Data synthesis
                • 16.9 360 degree market analysis
                  • 360 degree market analysis
                • 16.10 List of abbreviations
                  • List of abbreviations

                Research Methodology

                Technavio presents a detailed picture of the market by way of study, synthesis, and summation of data from multiple sources. The analysts have presented the various facets of the market with a particular focus on identifying the key industry influencers. The data thus presented is comprehensive, reliable, and the result of extensive research, both primary and secondary.

                INFORMATION SOURCES

                Primary sources

                • Manufacturers and suppliers
                • Channel partners
                • Industry experts
                • Strategic decision makers

                Secondary sources

                • Industry journals and periodicals
                • Government data
                • Financial reports of key industry players
                • Historical data
                • Press releases

                DATA ANALYSIS

                Data Synthesis

                • Collation of data
                • Estimation of key figures
                • Analysis of derived insights

                Data Validation

                • Triangulation with data models
                • Reference against proprietary databases
                • Corroboration with industry experts

                REPORT WRITING

                Qualitative

                • Market drivers
                • Market challenges
                • Market trends
                • Five forces analysis

                Quantitative

                • Market size and forecast
                • Market segmentation
                • Geographical insights
                • Competitive landscape

                Interested in this report?

                Get your sample now to see our research methodology and insights!

                Download Now

                Frequently Asked Questions

                Gear Manufacturing market growth will increase by $ 137.8 bn during 2025-2029 .

                The Gear Manufacturing market is expected to grow at a CAGR of 8.1% during 2025-2029 .

                Gear Manufacturing market is segmented by Product( Worm gear, Bevel gear, Others) End-user( Oil and gas industry, Power industry, Automotive, Others) Material( Steel, Cast iron, Polymer, Bronze, Composite materials)

                Bharat Gears Ltd., Bondioli and Pavesi Spa, Bonfiglioli Riduttori Spa, Comer Industries Spa, Curtis Machine Co. Inc., Dana Inc., DB Santasalo Sarl, Eaton Corp. plc, Elecon Engineering Co. Ltd., Emerson Electric Co., FLSmidth and Co. AS, Johnson Electric Holdings Ltd., KLINGELNBERG GmbH, Nord Gear Corp., Regal Rexnord Corp., SEW EURODRIVE GmbH and Co KG, Siemens AG, Sumitomo Heavy Industries Ltd., WEG S.A, ZF Friedrichshafen AG are a few of the key vendors in the Gear Manufacturing market.

                APAC will register the highest growth rate of 41% among the other regions. Therefore, the Gear Manufacturing market in APAC is expected to garner significant business opportunities for the vendors during the forecast period.

                China, US, India, Germany, UK, France, Canada, Japan, Indonesia, Italy

                • Adoption of industrial automationThe growth in technology over the past few decades is driving advances in automation is the driving factor this market.
                • prompting the adoption of robots and industrial automation. The use of automation across all industrial sectors globally is increasing. The rate of adoption of automation is especially high in the manufacturing sector is the driving factor this market.
                • which is expected to become a driving force for the global gear manufacturing market during the forecast period.Robots and automation equipment are most often used in high-speed is the driving factor this market.
                • repetitive tasks in manufacturing and other industries. The need to manufacture robots with a higher level of sophistication and scope of application has led to research work on developing high-precision gears.A major factor contributing to the growing adoption of automation is the rise in labor costs and the focus on eliminating production inefficiencies and reducing costs. The cost of labor has been steadily rising globally due to economic growth in most countries. The economic growth in developing countries such as India is the driving factor this market.
                • China is the driving factor this market.
                • and the Philippines is higher than that in developed countries such as Germany is the driving factor this market.
                • UK is the driving factor this market.
                • and France. The waning interest in manufacturing jobs is expected to exacerbate this problem globally as companies find it increasingly difficult to source and retain a skilled workforce.Due to the increase in the cost of labor is the driving factor this market.
                • coupled with manufacturing overcapacity in some countries is the driving factor this market.
                • many companies are facing erosion in profit margins and difficulties in maintaining their operations. These factors are pushing manufacturers to opt for automation in place of manual labor. Although the integration of automation in manufacturing processes requires huge initial capital investments is the driving factor this market.
                • the advantages of automated robots and machines usually outweigh these costs in the long term.The use of automation allows manufacturers to reduce their operational costs is the driving factor this market.
                • simultaneously improve work efficiency is the driving factor this market.
                • and reduce losses from human errors arising from manual handling and processing.The growing mechanization of manual jobs in industries is expected to result in the simultaneous growth of the global gear manufacturing market during the forecast period. is the driving factor this market.

                The Gear Manufacturing market vendors should focus on grabbing business opportunities from the Worm gear segment as it accounted for the largest market share in the base year.