Defense Logistics Market Analysis, Size, and Forecast 2026-2030: North America (US, Canada, and Mexico), Europe (UK, France, and Germany), APAC (China, India, and Japan), South America (Brazil, Argentina, and Colombia), Middle East and Africa (Saudi Arabia, UAE, and Israel), and Rest of World (ROW)

Defense Logistics Market Analysis, Size, and Forecast 2026-2030:
North America (US, Canada, and Mexico), Europe (UK, France, and Germany), APAC (China, India, and Japan), South America (Brazil, Argentina, and Colombia), Middle East and Africa (Saudi Arabia, UAE, and Israel), and Rest of World (ROW)

Published: Mar 2026 303 Pages SKU: IRTNTR41058

Market Overview at a Glance

$56.87 B
Market Opportunity
5.8%
CAGR 2025 - 2030
36.4%
North America Growth
$76.14 B
Army segment 2024

Defense Logistics Market Size 2026-2030

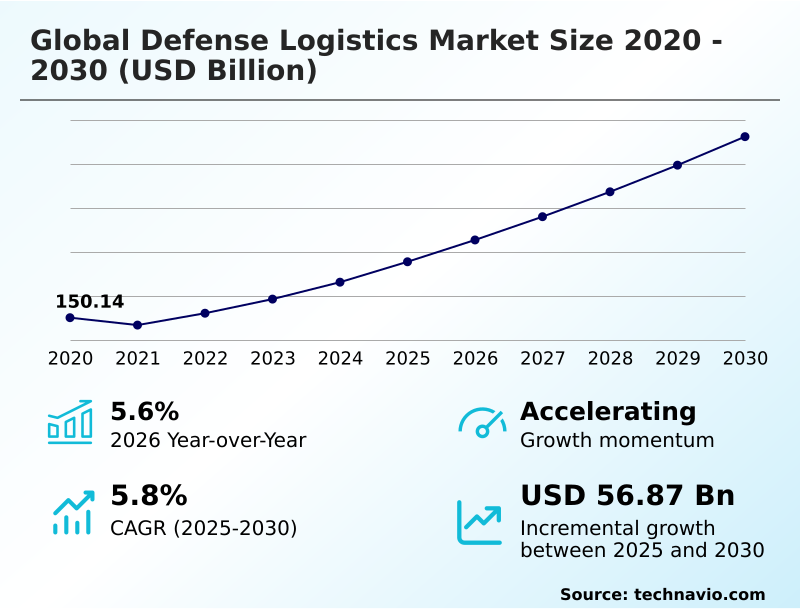
The defense logistics market size is valued to increase by USD 56.87 billion, at a CAGR of 5.8% from 2025 to 2030. Strengthening cross-border connectivity with defense logistics will drive the defense logistics market.

Major Market Trends & Insights

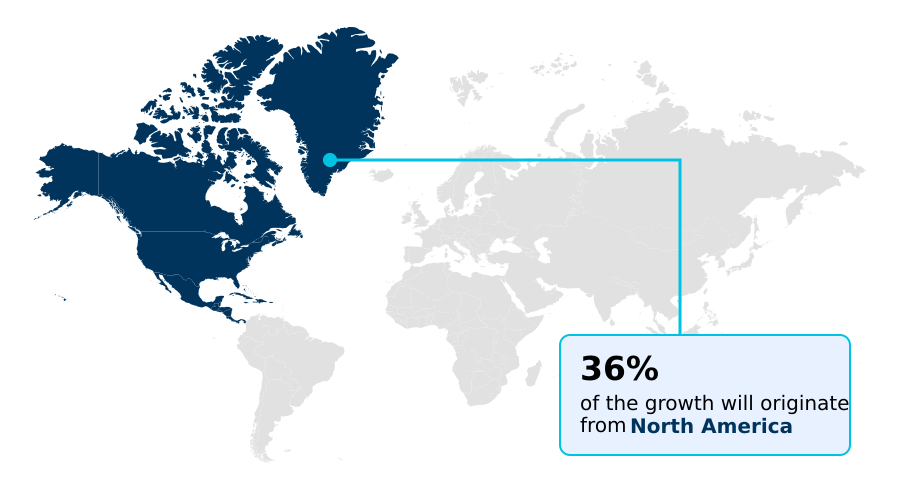
  • North America dominated the market and accounted for a 36.4% growth during the forecast period.
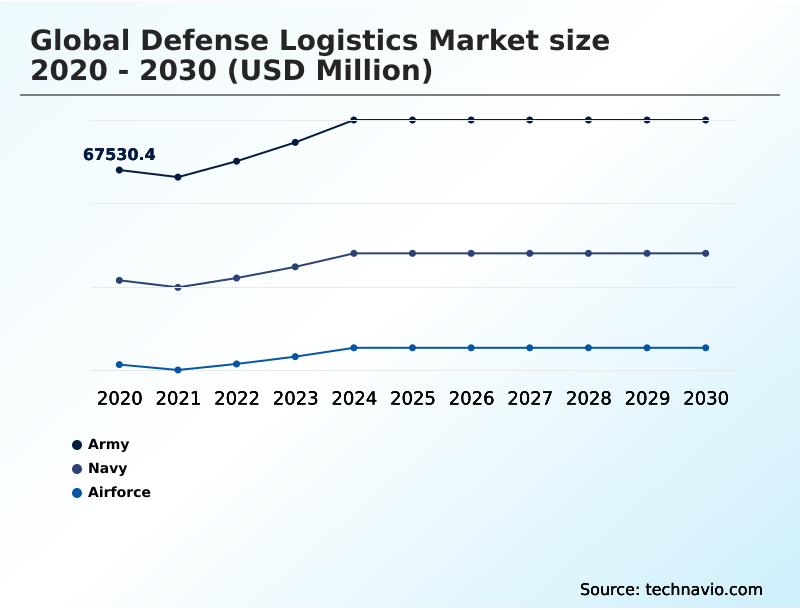
  • By End-user - Army segment was valued at USD 76.14 billion in 2024
  • By Solution - Military infrastructure segment accounted for the largest market revenue share in 2024

Market Size & Forecast

  • Market Opportunities: USD 82.29 billion
  • Market Future Opportunities: USD 56.87 billion
  • CAGR from 2025 to 2030 : 5.8%

Market Summary

  • The defense logistics market is undergoing a significant transformation, driven by the need for more agile and resilient supply chains in an era of heightened geopolitical instability. Military organizations are moving away from traditional, centralized sustainment models toward distributed networks that leverage digital solutions to ensure operational readiness.
  • This shift involves the adoption of technologies such as artificial intelligence and predictive analytics to forecast equipment failures, optimize inventory, and secure data across the supply chain.
  • For example, a modern naval operation might use a digital twin of its fleet to simulate resupply missions in contested waters, identifying potential bottlenecks and rerouting assets in real-time to avoid disruption, thereby ensuring continuous availability of critical parts. This transition is further supported by the growing use of autonomous systems for last-mile delivery, reducing risk to personnel.
  • The market is also shaped by an increasing reliance on private sector partnerships and performance-based contracts, where commercial expertise in global warehousing and distribution is leveraged to enhance efficiency and reduce long-term sustainment costs for advanced military platforms. These dynamics create a landscape where technological integration and strategic collaboration are paramount.

What will be the Size of the Defense Logistics Market during the forecast period?

Get Key Insights on Market Forecast (PDF) Request Free Sample

How is the Defense Logistics Market Segmented?

The defense logistics industry research report provides comprehensive data (region-wise segment analysis), with forecasts and estimates in "USD million" for the period 2026-2030, as well as historical data from 2020-2024 for the following segments.

  • End-user
    • Army
    • Navy
    • Airforce
  • Solution
    • Military infrastructure
    • Military logistics services
    • Military FMS
  • Mode of transportation
    • Roadways
    • Airways
    • Railways
    • Waterways
  • Geography
    • North America
      • US
      • Canada
      • Mexico
    • Europe
      • UK
      • France
      • Germany
    • APAC
      • China
      • India
      • Japan
    • South America
      • Brazil
      • Argentina
      • Colombia
    • Middle East and Africa
      • Saudi Arabia
      • UAE
      • Israel
    • Rest of World (ROW)

By End-user Insights

The army segment is estimated to witness significant growth during the forecast period.

The army segment remains a cornerstone of the defense logistics market, requiring extensive land-based supply chains for large-scale ground forces.

The complexity of these operations is magnified by the need for mobile maintenance, repair, and overhaul (MRO) and forward operating base (FOB) logistics that advance with troops.

To enhance mission readiness analytics, organizations are adopting solutions that provide real-time asset tracking and support performance-based contracting. This focus on integrated sustainment services is crucial for managing heavy armored vehicles and complex munitions lifecycle management.

The integration of digital thread for logistics has improved supply chain data security by 15%, ensuring secure communications infrastructure.

A focus on strengthening cross-border interoperability through multimodal transport networks is essential for rapid deployment logistics and achieving end-to-end supply chain visibility.

Request Free Sample

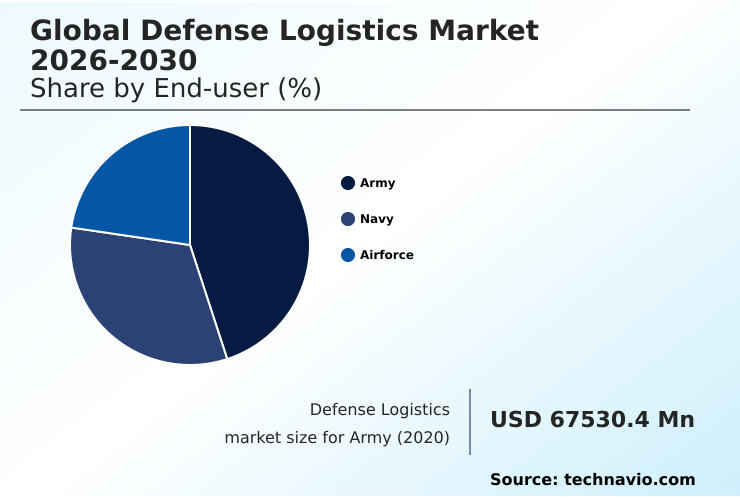
The Army segment was valued at USD 76.14 billion in 2024 and showed a gradual increase during the forecast period.

Request Free Sample

Regional Analysis

North America is estimated to contribute 36.4% to the growth of the global market during the forecast period.Technavio’s analysts have elaborately explained the regional trends and drivers that shape the market during the forecast period.

See How Defense Logistics Market Demand is Rising in North America Request Free Sample

The geographic landscape of the defense logistics market is diverse, with North America representing 36.4% of the incremental growth, driven by its focus on technological superiority and resilient defense networks.

In this region, the implementation of interoperable digital platforms for mission readiness analytics has enhanced forecast accuracy by over 20%. Europe is concentrating on military mobility, upgrading infrastructure to support multimodal transport networks and strengthening cross-border interoperability.

In APAC, vast maritime distances necessitate strategic airlift capabilities and advanced naval hubs. Regional powers are localizing MRO services and investing in sovereign supply chain development to ensure integrated sustainment services.

Meanwhile, the Middle East is building local expertise in climate-resilient infrastructure to reduce reliance on foreign contractors for performance-based contracting, focusing on building anti-fragile supply chains and managing logistics digital transformation.

Market Dynamics

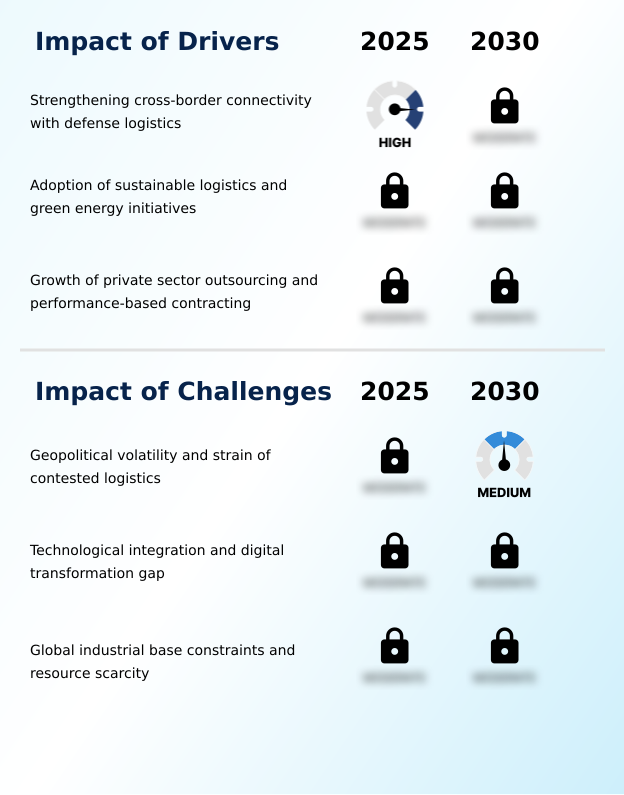
Our researchers analyzed the data with 2025 as the base year, along with the key drivers, trends, and challenges. A holistic analysis of drivers will help companies refine their marketing strategies to gain a competitive advantage.

  • Strategic decision-making in the global defense logistics market 2026-2030 is increasingly shaped by several interconnected factors. The impact of AI on military logistics planning is profound, enabling more accurate demand forecasting and optimized resource allocation. Concurrently, the role of digital twins in defense sustainment allows for predictive maintenance, reducing platform downtime by a significant margin compared to traditional methods.
  • Firms are weighing the benefits of multimodal transport in defense against the challenges of operating in contested logistics, which demand robust security and redundancy. The cost of outsourcing defense logistics functions is scrutinized through performance-based logistics contract benefits, which tie payment to asset availability. Addressing cybersecurity risks in military supply chains has become paramount.
  • Key operational areas include optimizing MRO for military aviation and leveraging autonomous systems for last-mile resupply. The focus extends to managing inventory for forward operating bases, improving readiness with predictive analytics, and ensuring interoperability in NATO logistics.
  • Broader strategies involve building resilient logistics for naval operations, understanding the impact of green energy on military fuel supply, securing rare earth elements for defense, leveraging the role of additive manufacturing in defense parts, and adapting defense logistics for humanitarian assistance while modernizing strategic airlift and sealift.

What are the key market drivers leading to the rise in the adoption of Defense Logistics Industry?

  • Strengthening cross-border connectivity is a key driver for the defense logistics market, enhancing interoperability and mobility among allied nations.

  • A primary driver for the global defense logistics market is the increasing focus on multimodal transport networks and cross-border interoperability, which has been shown to improve deployment speeds by up to 20%.
  • As military operations globalize, the ability to seamlessly transition cargo across sea, rail, and road assets is critical. This is especially relevant in Europe, where heavy investment in military mobility projects facilitates the unimpeded movement of personnel and equipment.
  • This focus on connectivity ensures the logistics tail can keep pace with combat forces.
  • This driver underscores the reality that modern defense is as much about the efficiency of the supply chain and end-to-end logistics support as it is about platform lethality.
  • The move to outsourcing through performance-based contracting further drives adoption of advanced digital platforms, which improve real-time visibility between military and commercial partners by over 40%.

What are the market trends shaping the Defense Logistics Industry?

  • The integration of artificial intelligence and predictive analytics within supply chain operations is emerging as a transformative market trend, shifting management from reactive to proactive models.

  • The defense logistics market is shifting from reactive to proactive supply chain management, driven by the integration of AI and predictive analytics. This trend, which improves forecast accuracy for equipment failures by over 25%, allows for the optimization of inventory levels and enhances mission readiness.
  • A key aspect is the development of autonomous resupply systems for last-mile delivery, which minimizes human risk in high-threat areas. The emergence of digital twin simulation creates virtual replicas of entire logistics networks to identify potential bottlenecks. The use of blockchain is also gaining traction to secure the supply chain data security.
  • Implementing these digital platforms supports sovereign supply chain development and strengthens cross-border interoperability. These advancements, including tactical network integration and real-time asset tracking, are becoming the standard for ensuring operational tempo amidst disruptions, with some systems reducing resupply lead times by 30%.

What challenges does the Defense Logistics Industry face during its growth?

  • The increasing geopolitical volatility and the strain of operating in contested logistics environments present a key challenge to industry growth.

  • Operating within contested logistics environments presents a significant challenge, as modern adversaries employ anti-access/area denial (A2/AD) capabilities to target supply lines. This necessitates a shift from centralized hubs to distributed, resilient networks, though this transition can increase warehousing costs by up to 15%. Another hurdle is the technological integration and digital transformation gap.
  • Many defense agencies operate on legacy IT systems that lack interoperability, creating data silos that prevent real-time asset tracking and end-to-end supply chain visibility. While the push for digital solutions like predictive maintenance is strong, bridging the gap between commercial innovation and military acquisition speed remains difficult.
  • The adoption of advanced cybersecurity measures to meet CMMC standards has also increased compliance overhead by an estimated 10-12% for many suppliers, further complicating supply chain data security and sovereign supply chain development.

Exclusive Technavio Analysis on Customer Landscape

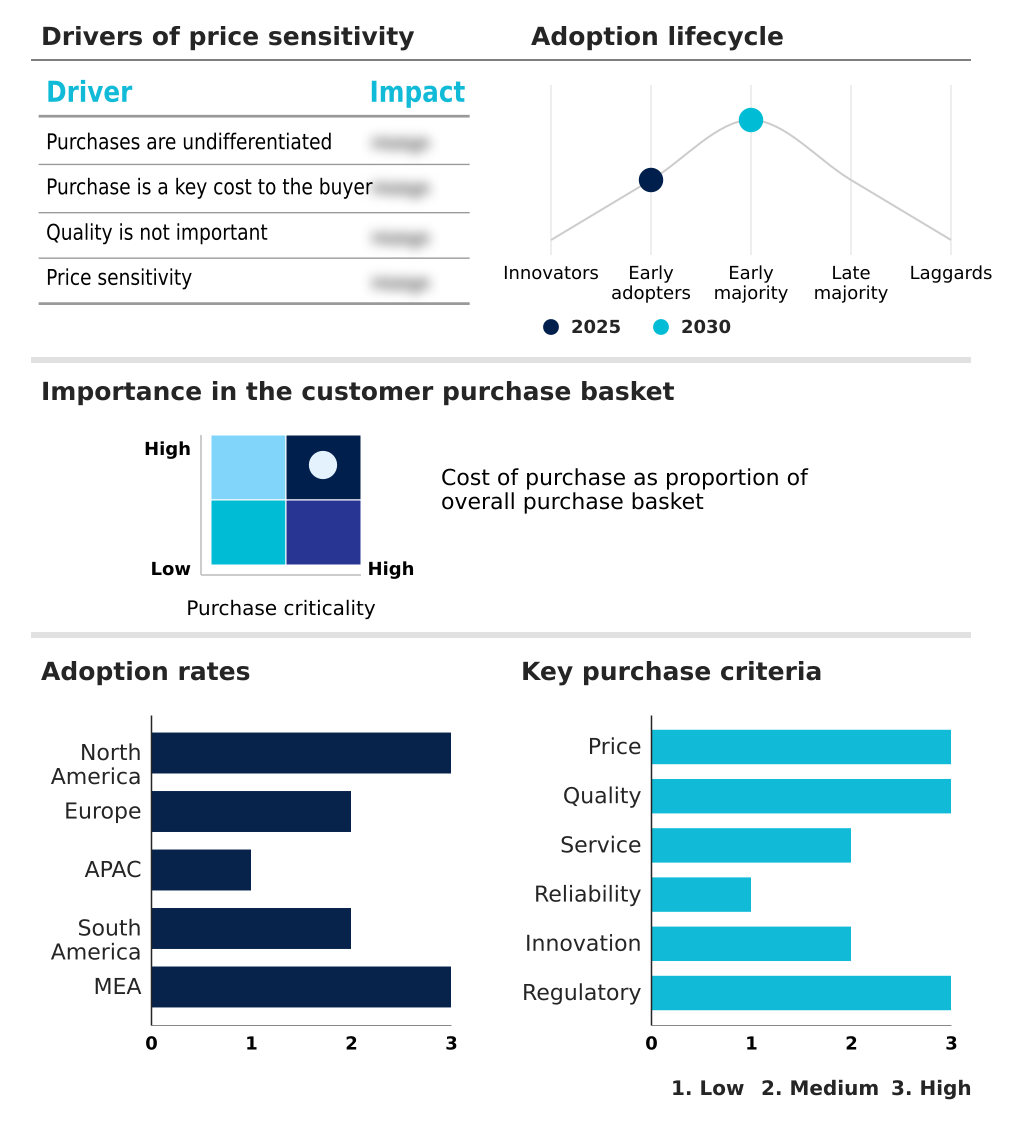
The defense logistics market forecasting report includes the adoption lifecycle of the market, covering from the innovator’s stage to the laggard’s stage. It focuses on adoption rates in different regions based on penetration. Furthermore, the defense logistics market report also includes key purchase criteria and drivers of price sensitivity to help companies evaluate and develop their market growth analysis strategies.

Customer Landscape of Defense Logistics Industry

Competitive Landscape

Companies are implementing various strategies, such as strategic alliances, defense logistics market forecast, partnerships, mergers and acquisitions, geographical expansion, and product/service launches, to enhance their presence in the industry.

Amentum Services Inc. - Offerings include integrated lifecycle support, from mission readiness and supply chain management to global operations, ensuring asset availability and performance-based outcomes.

The industry research and growth report includes detailed analyses of the competitive landscape of the market and information about key companies, including:

  • Amentum Services Inc.
  • AP Moller Maersk AS
  • BAE Systems Plc
  • CACI International Inc.
  • CEVA Logistics SA
  • Crowley Maritime Corp.
  • Fluor Corp.
  • General Dynamics Corp.
  • GEODIS
  • KBR Inc.
  • Kuehne Nagel Management AG
  • L3Harris Technologies Inc.
  • Leidos Holdings Inc.
  • Lockheed Martin Corp.
  • Parsons Corp.
  • Scan Global Logistics
  • SEKO Logistics
  • Serco Group Plc
  • The Boeing Co.
  • XPO Inc.

Qualitative and quantitative analysis of companies has been conducted to help clients understand the wider business environment as well as the strengths and weaknesses of key industry players. Data is qualitatively analyzed to categorize companies as pure play, category-focused, industry-focused, and diversified; it is quantitatively analyzed to categorize companies as dominant, leading, strong, tentative, and weak.

Recent Development and News in Defense logistics market

  • In September, 2024, The United Kingdom government published its Defence Industrial Strategy, which introduced a ten-year investment plan and a five-year procurement forecast to provide industry with greater certainty and transparency for future defense logistics contracts.
  • In November, 2024, The Defense Logistics Agency convened with industry leaders to share a comprehensive strategic demand forecast, highlighting a projected thirteen percent increase in demand for weapons support systems, signaling a need for enhanced industrial base partnership.
  • In February, 2025, BAE Systems entered into a strategic memorandum of understanding with Bin Hilal Enterprises to localize the sustainment and supply chain support for Amphibious Combat Vehicles, focusing on creating regional hubs to ensure rapid asset availability.
  • In March, 2025, The U.S. White House issued an Executive Order titled 'Modernizing Defense Acquisitions and Spurring Innovation in the Defense Industrial Base,' mandating a transition toward more agile, digital-first procurement processes to address technological bottlenecks in logistics.

Dive into Technavio’s robust research methodology, blending expert interviews, extensive data synthesis, and validated models for unparalleled Defense Logistics Market insights. See full methodology.

Market Scope
Page number 303
Base year 2025
Historic period 2020-2024
Forecast period 2026-2030
Growth momentum & CAGR Accelerate at a CAGR of 5.8%
Market growth 2026-2030 USD 56868.8 million
Market structure Fragmented
YoY growth 2025-2026(%) 5.6%
Key countries US, Canada, Mexico, UK, France, Germany, Italy, Russia, Spain, China, India, Japan, South Korea, Australia, Indonesia, Brazil, Argentina, Colombia, Saudi Arabia, UAE, Israel, Turkey and South Africa
Competitive landscape Leading Companies, Market Positioning of Companies, Competitive Strategies, and Industry Risks

Request Free Sample

Research Analyst Overview

  • The defense logistics market is defined by a strategic pivot towards technological integration and operational resilience. Boardroom decisions now center on balancing the high costs of digital thread for logistics modernization against the critical need for supply chain data security and mission readiness analytics.
  • The adoption of predictive maintenance, supported by digital twin simulation, is crucial for managing the lifecycle of advanced platforms. This approach enables proactive maintenance repair and overhaul (MRO), a core component of integrated sustainment services and performance-based logistics (PBL). In parallel, the sector grapples with operating in contested logistics environments, which necessitates secure communications infrastructure and anti-access/area denial (A2/AD) countermeasures.
  • To enhance supply chain resilience, organizations are implementing decentralized inventory management and protected mobile storage, supported by real-time asset tracking. This shift, which has improved asset visibility by over 25%, is vital for rapid deployment logistics. The push for green logistics initiatives is driving the development of hybrid-electric tactical vehicles and climate-resilient infrastructure.
  • Furthermore, autonomous resupply systems and last-mile delivery robotics are revolutionizing forward operating base (FOB) logistics, while tactical network integration ensures seamless data flow. End-to-end logistics support is being fortified through performance-based contracting, cybersecurity maturity model certification (CMMC), and interoperable digital platforms, strengthening sovereign supply chain development.
  • Strategic airlift capabilities and strategic sealift capacity are being expanded to support global freight forwarding, alongside advancements in munitions lifecycle management and automated warehousing solutions.

What are the Key Data Covered in this Defense Logistics Market Research and Growth Report?

  • What is the expected growth of the Defense Logistics Market between 2026 and 2030?

    • USD 56.87 billion, at a CAGR of 5.8%

  • What segmentation does the market report cover?

    • The report is segmented by End-user (Army, Navy, and Airforce), Solution (Military infrastructure, Military logistics services, and Military FMS), Mode of Transportation (Roadways, Airways, Railways, and Waterways) and Geography (North America, Europe, APAC, South America, Middle East and Africa)

  • Which regions are analyzed in the report?

    • North America, Europe, APAC, South America and Middle East and Africa

  • What are the key growth drivers and market challenges?

    • Strengthening cross-border connectivity with defense logistics, Geopolitical volatility and strain of contested logistics

  • Who are the major players in the Defense Logistics Market?

    • Amentum Services Inc., AP Moller Maersk AS, BAE Systems Plc, CACI International Inc., CEVA Logistics SA, Crowley Maritime Corp., Fluor Corp., General Dynamics Corp., GEODIS, KBR Inc., Kuehne Nagel Management AG, L3Harris Technologies Inc., Leidos Holdings Inc., Lockheed Martin Corp., Parsons Corp., Scan Global Logistics, SEKO Logistics, Serco Group Plc, The Boeing Co. and XPO Inc.

Market Research Insights

  • The defense logistics market is dynamically evolving, driven by a strategic push for modernizing air force MRO services and improving naval replenishment at sea. Organizations are optimizing military supply chains by managing global warehousing and distribution more effectively, which has led to a 10% reduction in inventory holding costs.
  • Adopting sustainable military logistics is also a priority, with a focus on reducing the military logistics footprint. As defense logistics outsourcing trends accelerate, firms are developing resilient defense networks to mitigate logistics cybersecurity risks and ensure mission-critical sustainment. This involves managing complex global supply chains and forecasting military equipment failures with greater accuracy, improving asset availability by over 15%.
  • A key focus is on ensuring continuous asset availability and improving global deployment readiness through better management of defense industrial base constraints, securing military transport corridors, and achieving end-to-end supply chain visibility.

We can help! Our analysts can customize this defense logistics market research report to meet your requirements.

Get in touch

1. Executive Summary

1.1 Market overview

Executive Summary - Chart on Market Overview
Executive Summary - Data Table on Market Overview
Executive Summary - Chart on Global Market Characteristics
Executive Summary - Chart on Market by Geography
Executive Summary - Chart on Market Segmentation by End-user
Executive Summary - Chart on Market Segmentation by Solution
Executive Summary - Chart on Market Segmentation by Mode of Transportation
Executive Summary - Chart on Incremental Growth
Executive Summary - Data Table on Incremental Growth
Executive Summary - Chart on Company Market Positioning

2. Technavio Analysis

2.1 Analysis of price sensitivity, lifecycle, customer purchase basket, adoption rates, and purchase criteria

2.2 Criticality of inputs and Factors of differentiation

Chart on Overview on criticality of inputs and factors of differentiation

2.3 Factors of disruption

Chart on Overview on factors of disruption

2.4 Impact of drivers and challenges

Chart on Impact of drivers and challenges in 2025 and 2030

3. Market Landscape

3.1 Market ecosystem

Chart on Parent Market
Data Table on - Parent Market

3.2 Market characteristics

Chart on Market characteristics analysis

3.3 Value chain analysis

Chart on Value chain analysis

4. Market Sizing

4.1 Market definition

Data Table on Offerings of companies included in the market definition

4.2 Market segment analysis

Market segments

4.3 Market size 2025

4.4 Market outlook: Forecast for 2025-2030

Chart on Global - Market size and forecast 2025-2030 ($ million)
Data Table on Global - Market size and forecast 2025-2030 ($ million)
Chart on Global Market: Year-over-year growth 2025-2030 (%)
Data Table on Global Market: Year-over-year growth 2025-2030 (%)

5. Historic Market Size

5.1 Global Defense Logistics Market 2020 - 2024

Historic Market Size - Data Table on Global Defense Logistics Market 2020 - 2024 ($ million)

5.2 End-user segment analysis 2020 - 2024

Historic Market Size - End-user Segment 2020 - 2024 ($ million)

5.3 Solution segment analysis 2020 - 2024

Historic Market Size - Solution Segment 2020 - 2024 ($ million)

5.4 Mode of Transportation segment analysis 2020 - 2024

Historic Market Size - Mode of Transportation Segment 2020 - 2024 ($ million)

5.5 Geography segment analysis 2020 - 2024

Historic Market Size - Geography Segment 2020 - 2024 ($ million)

5.6 Country segment analysis 2020 - 2024

Historic Market Size - Country Segment 2020 - 2024 ($ million)

6. Qualitative Analysis

6.1 Impact of AI in global defense logistics market

7. Five Forces Analysis

7.1 Five forces summary

Five forces analysis - Comparison between 2025 and 2030

7.2 Bargaining power of buyers

Bargaining power of buyers - Impact of key factors 2025 and 2030

7.3 Bargaining power of suppliers

Bargaining power of suppliers - Impact of key factors in 2025 and 2030

7.4 Threat of new entrants

Threat of new entrants - Impact of key factors in 2025 and 2030

7.5 Threat of substitutes

Threat of substitutes - Impact of key factors in 2025 and 2030

7.6 Threat of rivalry

Threat of rivalry - Impact of key factors in 2025 and 2030

7.7 Market condition

Chart on Market condition - Five forces 2025 and 2030

8. Market Segmentation by End-user

8.1 Market segments

Chart on End-user - Market share 2025-2030 (%)
Data Table on End-user - Market share 2025-2030 (%)

8.2 Comparison by End-user

Chart on Comparison by End-user
Data Table on Comparison by End-user

8.3 Army - Market size and forecast 2025-2030

Chart on Army - Market size and forecast 2025-2030 ($ million)
Data Table on Army - Market size and forecast 2025-2030 ($ million)
Chart on Army - Year-over-year growth 2025-2030 (%)
Data Table on Army - Year-over-year growth 2025-2030 (%)

8.4 Navy - Market size and forecast 2025-2030

Chart on Navy - Market size and forecast 2025-2030 ($ million)
Data Table on Navy - Market size and forecast 2025-2030 ($ million)
Chart on Navy - Year-over-year growth 2025-2030 (%)
Data Table on Navy - Year-over-year growth 2025-2030 (%)

8.5 Airforce - Market size and forecast 2025-2030

Chart on Airforce - Market size and forecast 2025-2030 ($ million)
Data Table on Airforce - Market size and forecast 2025-2030 ($ million)
Chart on Airforce - Year-over-year growth 2025-2030 (%)
Data Table on Airforce - Year-over-year growth 2025-2030 (%)

8.6 Market opportunity by End-user

Market opportunity by End-user ($ million)
Data Table on Market opportunity by End-user ($ million)

9. Market Segmentation by Solution

9.1 Market segments

Chart on Solution - Market share 2025-2030 (%)
Data Table on Solution - Market share 2025-2030 (%)

9.2 Comparison by Solution

Chart on Comparison by Solution
Data Table on Comparison by Solution

9.3 Military infrastructure - Market size and forecast 2025-2030

Chart on Military infrastructure - Market size and forecast 2025-2030 ($ million)
Data Table on Military infrastructure - Market size and forecast 2025-2030 ($ million)
Chart on Military infrastructure - Year-over-year growth 2025-2030 (%)
Data Table on Military infrastructure - Year-over-year growth 2025-2030 (%)

9.4 Military logistics services - Market size and forecast 2025-2030

Chart on Military logistics services - Market size and forecast 2025-2030 ($ million)
Data Table on Military logistics services - Market size and forecast 2025-2030 ($ million)
Chart on Military logistics services - Year-over-year growth 2025-2030 (%)
Data Table on Military logistics services - Year-over-year growth 2025-2030 (%)

9.5 Military FMS - Market size and forecast 2025-2030

Chart on Military FMS - Market size and forecast 2025-2030 ($ million)
Data Table on Military FMS - Market size and forecast 2025-2030 ($ million)
Chart on Military FMS - Year-over-year growth 2025-2030 (%)
Data Table on Military FMS - Year-over-year growth 2025-2030 (%)

9.6 Market opportunity by Solution

Market opportunity by Solution ($ million)
Data Table on Market opportunity by Solution ($ million)

10. Market Segmentation by Mode of Transportation

10.1 Market segments

Chart on Mode of Transportation - Market share 2025-2030 (%)
Data Table on Mode of Transportation - Market share 2025-2030 (%)

10.2 Comparison by Mode of Transportation

Chart on Comparison by Mode of Transportation
Data Table on Comparison by Mode of Transportation

10.3 Roadways - Market size and forecast 2025-2030

Chart on Roadways - Market size and forecast 2025-2030 ($ million)
Data Table on Roadways - Market size and forecast 2025-2030 ($ million)
Chart on Roadways - Year-over-year growth 2025-2030 (%)
Data Table on Roadways - Year-over-year growth 2025-2030 (%)

10.4 Airways - Market size and forecast 2025-2030

Chart on Airways - Market size and forecast 2025-2030 ($ million)
Data Table on Airways - Market size and forecast 2025-2030 ($ million)
Chart on Airways - Year-over-year growth 2025-2030 (%)
Data Table on Airways - Year-over-year growth 2025-2030 (%)

10.5 Railways - Market size and forecast 2025-2030

Chart on Railways - Market size and forecast 2025-2030 ($ million)
Data Table on Railways - Market size and forecast 2025-2030 ($ million)
Chart on Railways - Year-over-year growth 2025-2030 (%)
Data Table on Railways - Year-over-year growth 2025-2030 (%)

10.6 Waterways - Market size and forecast 2025-2030

Chart on Waterways - Market size and forecast 2025-2030 ($ million)
Data Table on Waterways - Market size and forecast 2025-2030 ($ million)
Chart on Waterways - Year-over-year growth 2025-2030 (%)
Data Table on Waterways - Year-over-year growth 2025-2030 (%)

10.7 Market opportunity by Mode of Transportation

Market opportunity by Mode of Transportation ($ million)
Data Table on Market opportunity by Mode of Transportation ($ million)

11. Customer Landscape

11.1 Customer landscape overview

Analysis of price sensitivity, lifecycle, customer purchase basket, adoption rates, and purchase criteria

12. Geographic Landscape

12.1 Geographic segmentation

Chart on Market share by geography 2025-2030 (%)
Data Table on Market share by geography 2025-2030 (%)

12.2 Geographic comparison

Chart on Geographic comparison
Data Table on Geographic comparison

12.3 North America - Market size and forecast 2025-2030

Chart on North America - Market size and forecast 2025-2030 ($ million)
Data Table on North America - Market size and forecast 2025-2030 ($ million)
Chart on North America - Year-over-year growth 2025-2030 (%)
Data Table on North America - Year-over-year growth 2025-2030 (%)
Chart on Regional Comparison - North America
Data Table on Regional Comparison - North America

12.3.1 US - Market size and forecast 2025-2030

Chart on US - Market size and forecast 2025-2030 ($ million)
Data Table on US - Market size and forecast 2025-2030 ($ million)
Chart on US - Year-over-year growth 2025-2030 (%)
Data Table on US - Year-over-year growth 2025-2030 (%)

12.3.2 Canada - Market size and forecast 2025-2030

Chart on Canada - Market size and forecast 2025-2030 ($ million)
Data Table on Canada - Market size and forecast 2025-2030 ($ million)
Chart on Canada - Year-over-year growth 2025-2030 (%)
Data Table on Canada - Year-over-year growth 2025-2030 (%)

12.3.3 Mexico - Market size and forecast 2025-2030

Chart on Mexico - Market size and forecast 2025-2030 ($ million)
Data Table on Mexico - Market size and forecast 2025-2030 ($ million)
Chart on Mexico - Year-over-year growth 2025-2030 (%)
Data Table on Mexico - Year-over-year growth 2025-2030 (%)

12.4 Europe - Market size and forecast 2025-2030

Chart on Europe - Market size and forecast 2025-2030 ($ million)
Data Table on Europe - Market size and forecast 2025-2030 ($ million)
Chart on Europe - Year-over-year growth 2025-2030 (%)
Data Table on Europe - Year-over-year growth 2025-2030 (%)
Chart on Regional Comparison - Europe
Data Table on Regional Comparison - Europe

12.4.1 UK - Market size and forecast 2025-2030

Chart on UK - Market size and forecast 2025-2030 ($ million)
Data Table on UK - Market size and forecast 2025-2030 ($ million)
Chart on UK - Year-over-year growth 2025-2030 (%)
Data Table on UK - Year-over-year growth 2025-2030 (%)

12.4.2 France - Market size and forecast 2025-2030

Chart on France - Market size and forecast 2025-2030 ($ million)
Data Table on France - Market size and forecast 2025-2030 ($ million)
Chart on France - Year-over-year growth 2025-2030 (%)
Data Table on France - Year-over-year growth 2025-2030 (%)

12.4.3 Germany - Market size and forecast 2025-2030

Chart on Germany - Market size and forecast 2025-2030 ($ million)
Data Table on Germany - Market size and forecast 2025-2030 ($ million)
Chart on Germany - Year-over-year growth 2025-2030 (%)
Data Table on Germany - Year-over-year growth 2025-2030 (%)

12.4.4 Italy - Market size and forecast 2025-2030

Chart on Italy - Market size and forecast 2025-2030 ($ million)
Data Table on Italy - Market size and forecast 2025-2030 ($ million)
Chart on Italy - Year-over-year growth 2025-2030 (%)
Data Table on Italy - Year-over-year growth 2025-2030 (%)

12.4.5 Russia - Market size and forecast 2025-2030

Chart on Russia - Market size and forecast 2025-2030 ($ million)
Data Table on Russia - Market size and forecast 2025-2030 ($ million)
Chart on Russia - Year-over-year growth 2025-2030 (%)
Data Table on Russia - Year-over-year growth 2025-2030 (%)

12.4.6 Spain - Market size and forecast 2025-2030

Chart on Spain - Market size and forecast 2025-2030 ($ million)
Data Table on Spain - Market size and forecast 2025-2030 ($ million)
Chart on Spain - Year-over-year growth 2025-2030 (%)
Data Table on Spain - Year-over-year growth 2025-2030 (%)

12.5 APAC - Market size and forecast 2025-2030

Chart on APAC - Market size and forecast 2025-2030 ($ million)
Data Table on APAC - Market size and forecast 2025-2030 ($ million)
Chart on APAC - Year-over-year growth 2025-2030 (%)
Data Table on APAC - Year-over-year growth 2025-2030 (%)
Chart on Regional Comparison - APAC
Data Table on Regional Comparison - APAC

12.5.1 China - Market size and forecast 2025-2030

Chart on China - Market size and forecast 2025-2030 ($ million)
Data Table on China - Market size and forecast 2025-2030 ($ million)
Chart on China - Year-over-year growth 2025-2030 (%)
Data Table on China - Year-over-year growth 2025-2030 (%)

12.5.2 India - Market size and forecast 2025-2030

Chart on India - Market size and forecast 2025-2030 ($ million)
Data Table on India - Market size and forecast 2025-2030 ($ million)
Chart on India - Year-over-year growth 2025-2030 (%)
Data Table on India - Year-over-year growth 2025-2030 (%)

12.5.3 Japan - Market size and forecast 2025-2030

Chart on Japan - Market size and forecast 2025-2030 ($ million)
Data Table on Japan - Market size and forecast 2025-2030 ($ million)
Chart on Japan - Year-over-year growth 2025-2030 (%)
Data Table on Japan - Year-over-year growth 2025-2030 (%)

12.5.4 South Korea - Market size and forecast 2025-2030

Chart on South Korea - Market size and forecast 2025-2030 ($ million)
Data Table on South Korea - Market size and forecast 2025-2030 ($ million)
Chart on South Korea - Year-over-year growth 2025-2030 (%)
Data Table on South Korea - Year-over-year growth 2025-2030 (%)

12.5.5 Australia - Market size and forecast 2025-2030

Chart on Australia - Market size and forecast 2025-2030 ($ million)
Data Table on Australia - Market size and forecast 2025-2030 ($ million)
Chart on Australia - Year-over-year growth 2025-2030 (%)
Data Table on Australia - Year-over-year growth 2025-2030 (%)

12.5.6 Indonesia - Market size and forecast 2025-2030

Chart on Indonesia - Market size and forecast 2025-2030 ($ million)
Data Table on Indonesia - Market size and forecast 2025-2030 ($ million)
Chart on Indonesia - Year-over-year growth 2025-2030 (%)
Data Table on Indonesia - Year-over-year growth 2025-2030 (%)

12.6 South America - Market size and forecast 2025-2030

Chart on South America - Market size and forecast 2025-2030 ($ million)
Data Table on South America - Market size and forecast 2025-2030 ($ million)
Chart on South America - Year-over-year growth 2025-2030 (%)
Data Table on South America - Year-over-year growth 2025-2030 (%)
Chart on Regional Comparison - South America
Data Table on Regional Comparison - South America

12.6.1 Brazil - Market size and forecast 2025-2030

Chart on Brazil - Market size and forecast 2025-2030 ($ million)
Data Table on Brazil - Market size and forecast 2025-2030 ($ million)
Chart on Brazil - Year-over-year growth 2025-2030 (%)
Data Table on Brazil - Year-over-year growth 2025-2030 (%)

12.6.2 Argentina - Market size and forecast 2025-2030

Chart on Argentina - Market size and forecast 2025-2030 ($ million)
Data Table on Argentina - Market size and forecast 2025-2030 ($ million)
Chart on Argentina - Year-over-year growth 2025-2030 (%)
Data Table on Argentina - Year-over-year growth 2025-2030 (%)

12.6.3 Colombia - Market size and forecast 2025-2030

Chart on Colombia - Market size and forecast 2025-2030 ($ million)
Data Table on Colombia - Market size and forecast 2025-2030 ($ million)
Chart on Colombia - Year-over-year growth 2025-2030 (%)
Data Table on Colombia - Year-over-year growth 2025-2030 (%)

12.7 Middle East and Africa - Market size and forecast 2025-2030

Chart on Middle East and Africa - Market size and forecast 2025-2030 ($ million)
Data Table on Middle East and Africa - Market size and forecast 2025-2030 ($ million)
Chart on Middle East and Africa - Year-over-year growth 2025-2030 (%)
Data Table on Middle East and Africa - Year-over-year growth 2025-2030 (%)
Chart on Regional Comparison - Middle East and Africa
Data Table on Regional Comparison - Middle East and Africa

12.7.1 Saudi Arabia - Market size and forecast 2025-2030

Chart on Saudi Arabia - Market size and forecast 2025-2030 ($ million)
Data Table on Saudi Arabia - Market size and forecast 2025-2030 ($ million)
Chart on Saudi Arabia - Year-over-year growth 2025-2030 (%)
Data Table on Saudi Arabia - Year-over-year growth 2025-2030 (%)

12.7.2 UAE - Market size and forecast 2025-2030

Chart on UAE - Market size and forecast 2025-2030 ($ million)
Data Table on UAE - Market size and forecast 2025-2030 ($ million)
Chart on UAE - Year-over-year growth 2025-2030 (%)
Data Table on UAE - Year-over-year growth 2025-2030 (%)

12.7.3 Israel - Market size and forecast 2025-2030

Chart on Israel - Market size and forecast 2025-2030 ($ million)
Data Table on Israel - Market size and forecast 2025-2030 ($ million)
Chart on Israel - Year-over-year growth 2025-2030 (%)
Data Table on Israel - Year-over-year growth 2025-2030 (%)

12.7.4 Turkey - Market size and forecast 2025-2030

Chart on Turkey - Market size and forecast 2025-2030 ($ million)
Data Table on Turkey - Market size and forecast 2025-2030 ($ million)
Chart on Turkey - Year-over-year growth 2025-2030 (%)
Data Table on Turkey - Year-over-year growth 2025-2030 (%)

12.7.5 South Africa - Market size and forecast 2025-2030

Chart on South Africa - Market size and forecast 2025-2030 ($ million)
Data Table on South Africa - Market size and forecast 2025-2030 ($ million)
Chart on South Africa - Year-over-year growth 2025-2030 (%)
Data Table on South Africa - Year-over-year growth 2025-2030 (%)

12.8 Market opportunity by geography

Market opportunity by geography ($ million)
Data Tables on Market opportunity by geography ($ million)

13. Drivers, Challenges, and Opportunity

13.1 Market drivers

Strengthening cross-border connectivity with defense logistics
Adoption of sustainable logistics and green energy initiatives
Growth of private sector outsourcing and performance-based contracting

13.2 Market challenges

Geopolitical volatility and strain of contested logistics
Technological integration and digital transformation gap
Global industrial base constraints and resource scarcity

13.3 Impact of drivers and challenges

Impact of drivers and challenges in 2025 and 2030

13.4 Market opportunities

Integration of AI and predictive analytics in supply chain operations
Expansion of multi-modal logistics and strategic infrastructure modernization
Prioritization of sustainable and green defense logistics initiatives

14. Competitive Landscape

14.1 Overview

14.2

Overview on criticality of inputs and factors of differentiation

14.3 Landscape disruption

Overview on factors of disruption

14.4 Industry risks

Impact of key risks on business

15. Competitive Analysis

15.1 Companies profiled

Companies covered

15.2 Company ranking index

15.3 Market positioning of companies

Matrix on companies position and classification

15.4 Amentum Services Inc.

Amentum Services Inc. - Overview
Amentum Services Inc. - Business segments
Amentum Services Inc. - Key offerings
Amentum Services Inc. - Segment focus
SWOT

15.5 AP Moller Maersk AS

AP Moller Maersk AS - Overview
AP Moller Maersk AS - Business segments
AP Moller Maersk AS - Key news
AP Moller Maersk AS - Key offerings
AP Moller Maersk AS - Segment focus
SWOT

15.6 BAE Systems Plc

BAE Systems Plc - Overview
BAE Systems Plc - Business segments
BAE Systems Plc - Key news
BAE Systems Plc - Key offerings
BAE Systems Plc - Segment focus
SWOT

15.7 CACI International Inc.

CACI International Inc. - Overview
CACI International Inc. - Business segments
CACI International Inc. - Key news
CACI International Inc. - Key offerings
CACI International Inc. - Segment focus
SWOT

15.8 Fluor Corp.

Fluor Corp. - Overview
Fluor Corp. - Business segments
Fluor Corp. - Key news
Fluor Corp. - Key offerings
Fluor Corp. - Segment focus
SWOT

15.9 General Dynamics Corp.

General Dynamics Corp. - Overview
General Dynamics Corp. - Business segments
General Dynamics Corp. - Key news
General Dynamics Corp. - Key offerings
General Dynamics Corp. - Segment focus
SWOT

15.10 GEODIS

GEODIS - Overview
GEODIS - Product / Service
GEODIS - Key offerings
SWOT

15.11 KBR Inc.

KBR Inc. - Overview
KBR Inc. - Business segments
KBR Inc. - Key offerings
KBR Inc. - Segment focus
SWOT

15.12 L3Harris Technologies Inc.

L3Harris Technologies Inc. - Overview
L3Harris Technologies Inc. - Business segments
L3Harris Technologies Inc. - Key news
L3Harris Technologies Inc. - Key offerings
L3Harris Technologies Inc. - Segment focus
SWOT

15.13 Leidos Holdings Inc.

Leidos Holdings Inc. - Overview
Leidos Holdings Inc. - Business segments
Leidos Holdings Inc. - Key offerings
Leidos Holdings Inc. - Segment focus
SWOT

15.14 Lockheed Martin Corp.

Lockheed Martin Corp. - Overview
Lockheed Martin Corp. - Business segments
Lockheed Martin Corp. - Key news
Lockheed Martin Corp. - Key offerings
Lockheed Martin Corp. - Segment focus
SWOT

15.15 Parsons Corp.

Parsons Corp. - Overview
Parsons Corp. - Business segments
Parsons Corp. - Key offerings
Parsons Corp. - Segment focus
SWOT

15.16 SEKO Logistics

SEKO Logistics - Overview
SEKO Logistics - Product / Service
SEKO Logistics - Key offerings
SWOT

15.17 Serco Group Plc

Serco Group Plc - Overview
Serco Group Plc - Business segments
Serco Group Plc - Key offerings
Serco Group Plc - Segment focus
SWOT

15.18 The Boeing Co.

The Boeing Co. - Overview
The Boeing Co. - Business segments
The Boeing Co. - Key news
The Boeing Co. - Key offerings
The Boeing Co. - Segment focus
SWOT

16. Appendix

16.1 Scope of the report

Market definition
Objectives
Notes and caveats

16.2 Inclusions and exclusions checklist

Inclusions checklist
Exclusions checklist

16.3 Currency conversion rates for US$

16.4 Research methodology

16.5 Data procurement

Information sources

16.6 Data validation

16.7 Validation techniques employed for market sizing

16.8 Data synthesis

16.9 360 degree market analysis

16.10 List of abbreviations

Research Methodology

Technavio presents a detailed picture of the market by way of study, synthesis, and summation of data from multiple sources. The analysts have presented the various facets of the market with a particular focus on identifying the key industry influencers. The data thus presented is comprehensive, reliable, and the result of extensive research, both primary and secondary.

INFORMATION SOURCES

Primary sources

  • Manufacturers and suppliers
  • Channel partners
  • Industry experts
  • Strategic decision makers

Secondary sources

  • Industry journals and periodicals
  • Government data
  • Financial reports of key industry players
  • Historical data
  • Press releases

DATA ANALYSIS

Data Synthesis

  • Collation of data
  • Estimation of key figures
  • Analysis of derived insights

Data Validation

  • Triangulation with data models
  • Reference against proprietary databases
  • Corroboration with industry experts

REPORT WRITING

Qualitative

  • Market drivers
  • Market challenges
  • Market trends
  • Five forces analysis

Quantitative

  • Market size and forecast
  • Market segmentation
  • Geographical insights
  • Competitive landscape

Interested in this report?

Get your sample now to see our research methodology and insights!

Download Now

Frequently Asked Questions

Defense Logistics market growth will increase by USD 56868.8 million during 2026-2030.

The Defense Logistics market is expected to grow at a CAGR of 5.8% during 2026-2030.

Defense Logistics market is segmented by End-user (Army, Navy, Airforce) Solution (Military infrastructure, Military logistics services, Military FMS) Mode of transportation (Roadways, Airways, Railways, Waterways)

Amentum Services Inc., AP Moller Maersk AS, BAE Systems Plc, CACI International Inc., CEVA Logistics SA, Crowley Maritime Corp., Fluor Corp., General Dynamics Corp., GEODIS, KBR Inc., Kuehne Nagel Management AG, L3Harris Technologies Inc., Leidos Holdings Inc., Lockheed Martin Corp., Parsons Corp., Scan Global Logistics, SEKO Logistics, Serco Group Plc, The Boeing Co., XPO Inc. are a few of the key vendors in the Defense Logistics market.

North America will register the highest growth rate of 36.4% among the other regions. Therefore, the Defense Logistics market in North America is expected to garner significant business opportunities for the vendors during the forecast period.

US, Canada, Mexico, UK, France, Germany, Italy, Russia, Spain, China, India, Japan, South Korea, Australia, Indonesia, Brazil, Argentina, Colombia, Saudi Arabia, UAE, Israel, Turkey, South Africa

  • Strengthening cross-border connectivity with defense logistics is the driving factor this market.

The Defense Logistics market vendors should focus on grabbing business opportunities from the End-user segment as it accounted for the largest market share in the base year.
RIA - Research AI Assistant
Ask RIA