Glass Fiber Market Analysis, Size, and Forecast 2026-2030: APAC (China, India, and Japan), North America (US, Canada, and Mexico), Europe (Germany, France, and UK), Middle East and Africa (Saudi Arabia, UAE, and South Africa), South America (Brazil and Argentina), and Rest of World (ROW)

Glass Fiber Market Analysis, Size, and Forecast 2026-2030:
APAC (China, India, and Japan), North America (US, Canada, and Mexico), Europe (Germany, France, and UK), Middle East and Africa (Saudi Arabia, UAE, and South Africa), South America (Brazil and Argentina), and Rest of World (ROW)

Published: Dec 2025 303 Pages SKU: IRTNTR45430

Market Overview at a Glance

$4.91 B
Market Opportunity
5.4%
CAGR 2025 - 2030
51.7%
APAC Growth
$11.86 B
Composites segment 2024

Glass Fiber Market Size 2026-2030

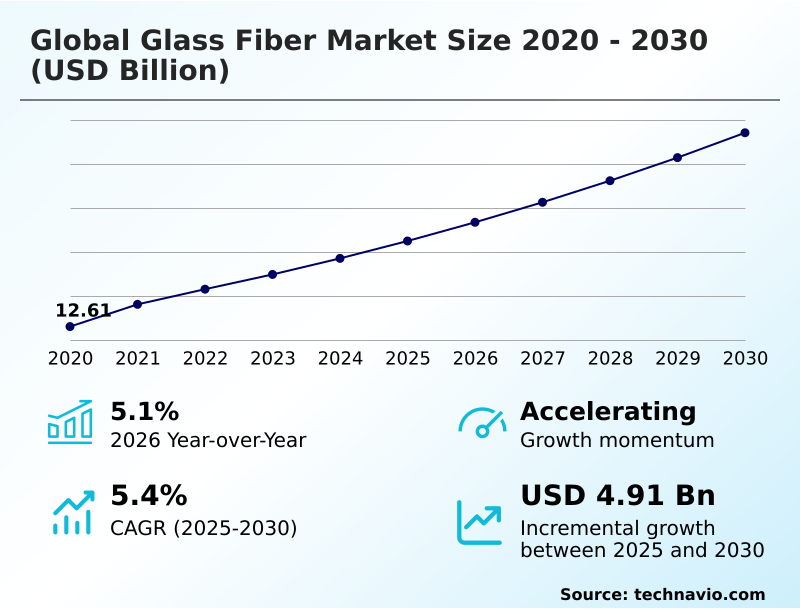
The glass fiber market size is valued to increase by USD 4.91 billion, at a CAGR of 5.4% from 2025 to 2030. Construction and infrastructure development will drive the glass fiber market.

Major Market Trends & Insights

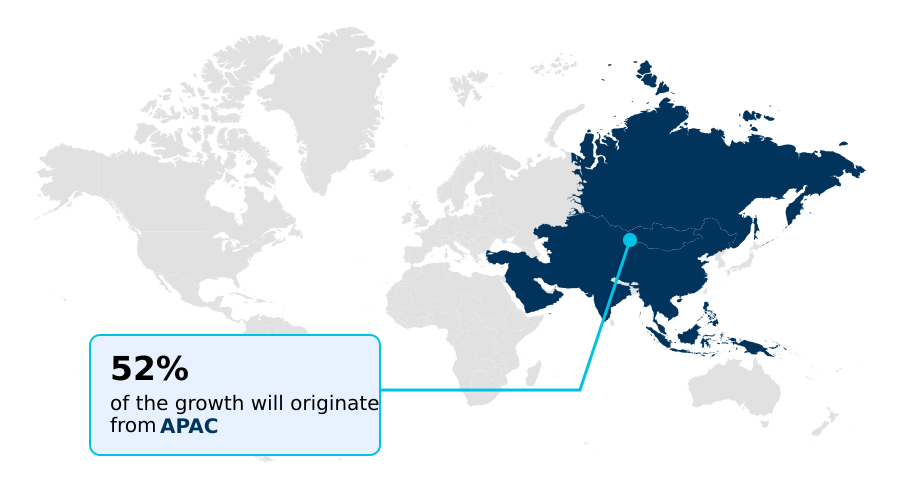
  • APAC dominated the market and accounted for a 51.7% growth during the forecast period.
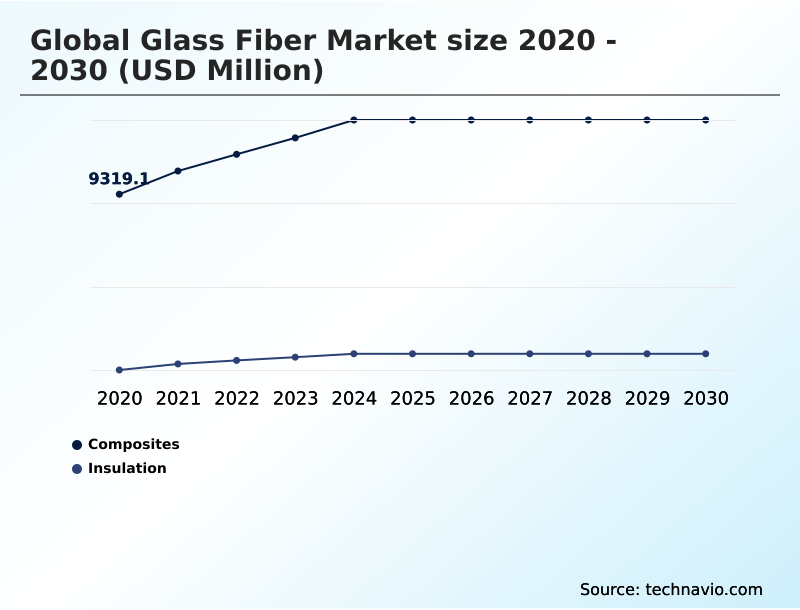
  • By Application - Composites segment was valued at USD 11.86 billion in 2024
  • By End-user - Construction segment accounted for the largest market revenue share in 2024

Market Size & Forecast

  • Market Opportunities: USD 8.80 billion
  • Market Future Opportunities: USD 4.91 billion
  • CAGR from 2025 to 2030 : 5.4%

Market Summary

  • The Glass Fiber Market is undergoing a significant transformation driven by the escalating demand for lightweight, high-strength, and corrosion-resistant materials across multiple sectors.
  • Key drivers include the automotive industry's push for vehicle lightweighting to meet stringent emission standards and the rapid expansion of the renewable energy sector, particularly wind power, which relies on glass fiber for the manufacturing of large turbine blades.
  • For instance, an automotive OEM might leverage glass fiber reinforced plastics to replace steel in vehicle body panels, achieving a significant weight reduction that enhances the range of its electric vehicle lineup without compromising safety.
  • Concurrently, the market is shaped by trends such as the adoption of intelligent manufacturing to improve production efficiency and the development of high-performance fibers for specialized applications.
  • However, challenges such as high energy consumption during production and the complexities of recycling end-of-life thermoset composites persist, prompting a strategic industry-wide focus on sustainable manufacturing practices and the development of more recyclable thermoplastic composite solutions.

What will be the Size of the Glass Fiber Market during the forecast period?

Get Key Insights on Market Forecast (PDF) Request Free Sample

How is the Glass Fiber Market Segmented?

The glass fiber industry research report provides comprehensive data (region-wise segment analysis), with forecasts and estimates in "USD million" for the period 2026-2030, as well as historical data from 2020-2024 for the following segments.

  • Application
    • Composites
    • Insulation
  • End-user
    • Construction
    • Transportation
    • Consumer products
    • Wind turbines
    • Others
  • Type
    • E-glass
    • E-CR glass
    • S-glass
    • Others
  • Geography
    • APAC
      • China
      • India
      • Japan
    • North America
      • US
      • Canada
      • Mexico
    • Europe
      • Germany
      • France
      • UK
    • Middle East and Africa
      • Saudi Arabia
      • UAE
      • South Africa
    • South America
      • Brazil
      • Argentina
    • Rest of World (ROW)

By Application Insights

The composites segment is estimated to witness significant growth during the forecast period.

The composites segment is expanding due to a rising need for high-performance materials with superior strength-to-weight ratios. glass fiber reinforced plastics are fundamental for structural applications across automotive and construction sectors.

In the automotive industry, manufacturers use these lightweighting materials in components like bumper beams and instrument panels to improve fuel efficiency and extend electric vehicle range. The energy sector utilizes them for high-pressure vessel reinforcement.

Advancements in resin matrices and fiber sizing continue to enhance mechanical properties, with some thermoplastic composites enabling a 50% reduction in molding cycle times compared to traditional thermosets.

This shift in advanced engineering applications facilitates mass production and material efficiency in demanding sectors, including aerospace structural components and automotive lightweighting composites.

Request Free Sample

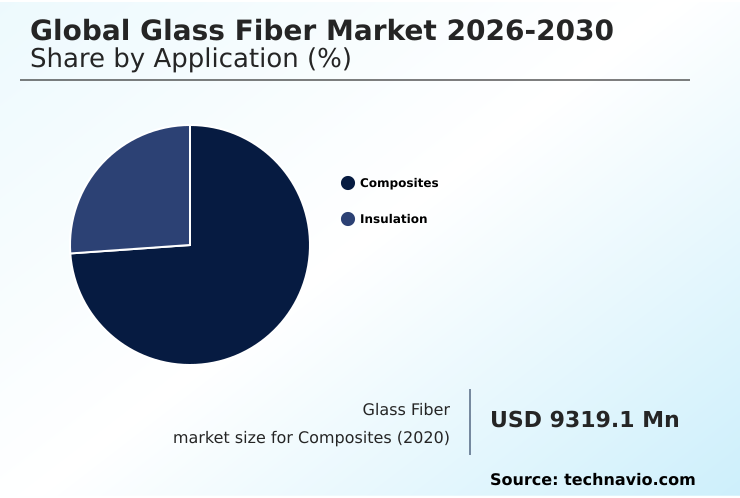
The Composites segment was valued at USD 11.86 billion in 2024 and showed a gradual increase during the forecast period.

Request Free Sample

Regional Analysis

APAC is estimated to contribute 51.7% to the growth of the global market during the forecast period.Technavio’s analysts have elaborately explained the regional trends and drivers that shape the market during the forecast period.

See How Glass Fiber Market Demand is Rising in APAC Request Free Sample

The market's geographic landscape is dominated by the APAC region, which accounts for over 51% of the incremental growth, largely due to its robust industrial base in China.

This region is the epicenter for manufacturing, with massive end-user demand in construction, electronics, and wind energy. Demand for electronic-grade yarns for printed circuit board substrates and concrete reinforcement fibers is particularly strong.

North America follows, contributing approximately 22% to growth, driven by residential construction using glass mineral wool and aerospace applications.

Europe's market is heavily influenced by stringent environmental policies promoting energy efficiency, creating demand for industrial insulation solutions and high-strength rovings for wind turbines.

The Middle East focuses on infrastructure, utilizing corrosion-resistant piping for large-scale water and oil and gas projects.

Market Dynamics

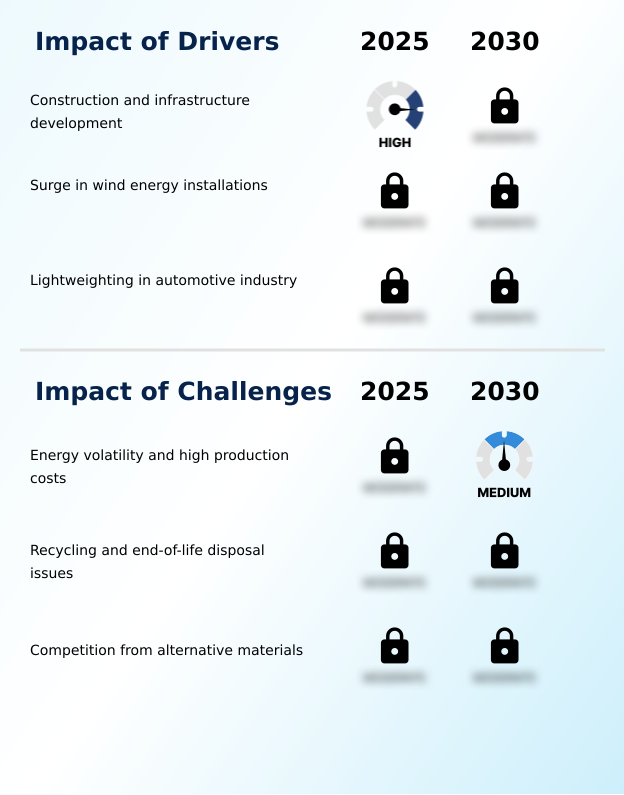
Our researchers analyzed the data with 2025 as the base year, along with the key drivers, trends, and challenges. A holistic analysis of drivers will help companies refine their marketing strategies to gain a competitive advantage.

  • The global glass fiber market is undergoing a strategic evolution, driven by technological progress and shifting industrial demands. Key discussions center on the advances in high-modulus glass fiber technology, which are critical for applications requiring superior stiffness. The ongoing debate of glass fiber versus carbon fiber cost performance continues to influence material selection, especially in aerospace and high-end automotive sectors.
  • The adoption of thermoplastic composites for automotive parts production is accelerating due to their recyclability and fast processing times. However, the industry grapples with glass fiber recycling process and challenges, a key sustainability concern.
  • For specific applications, the focus is precise: e-glass fiber applications for electronic substrates remain a high-volume segment, while s-glass fiber utilization in aerospace applications is driven by its exceptional strength. The corrosion resistance benefits of e-cr glass make it ideal for harsh chemical environments. In construction, the use of alkali-resistant glass for concrete reinforcement systems is growing.
  • The fundamental role of glass fiber in wind turbine blades is undisputed, as is its importance in automotive lightweighting with glass fiber composites. To address production costs, companies are focused on intelligent manufacturing in glass fiber production and reducing energy consumption in glass fiber manufacturing. The rising natural fiber competition for glass fiber materials is also a factor.
  • Overall, key glass fiber applications in construction industry and the thermal insulation properties of glass mineral wool continue to be major demand drivers. Meanwhile, high-performance glass fiber for defense applications and glass fiber reinforced polymer pipes for infrastructure highlight the material's versatility.
  • The impact of digitalization on glass fiber market and sustainability challenges in glass fiber composites are shaping future strategies, alongside the role of glass fiber in electric vehicle design. Implementing intelligent manufacturing has been shown to improve yield by over 10% compared to traditional methods, directly impacting supply chain reliability.

What are the key market drivers leading to the rise in the adoption of Glass Fiber Industry?

  • The expansion of construction and infrastructure development serves as a primary driver for the market.

  • Market growth is propelled by demand for lightweighting materials in the transportation sector, where glass fiber reinforced plastics replace heavier metals, improving fuel economy by up to 5% in certain applications.
  • The proliferation of electric vehicles intensifies this need, with composites used for next-generation battery enclosures and structural reinforcement. The global transition toward renewable energy also acts as a powerful driver, especially for wind turbine blade reinforcement.
  • Longer blades, essential for increasing energy capture, rely on glass fiber composites for their exceptional stiffness-to-weight ratio.
  • Furthermore, the expansion of construction and infrastructure, driven by mandates for energy-efficient buildings, creates sustained demand for glass fiber as insulation and structural reinforcement, positioning it as a key component in sustainable building materials.

What are the market trends shaping the Glass Fiber Industry?

  • The market is witnessing a significant shift toward high-modulus and high-performance glass fibers. This evolution is driven by the increasing technical demands of advanced applications.

  • A significant trend is the technological shift from standard e-glass to high-modulus glass fiber variants, essential for advanced engineering applications like next-generation turbine blades. These materials bridge the performance gap between e-glass and carbon fiber, allowing designers to reduce laminate thickness. Concurrently, the industry is adopting intelligent manufacturing systems, integrating AI and IoT to monitor the pultrusion process in real-time.
  • This digitalization has led to a 15% reduction in defect rates for some producers. Another key movement is the transition to thermoplastic composites, which offer superior recyclability and processing speeds, reducing manufacturing cycles from hours to seconds. These advancements in advanced material science are reshaping production and enabling circular economy solutions.

What challenges does the Glass Fiber Industry face during its growth?

  • Energy price volatility and high production costs present a key challenge affecting industry growth.

  • The industry faces a significant challenge from energy-intensive production processes, where furnace melting technology operates at extremely high temperatures. This makes manufacturers susceptible to energy price volatility, which can increase production costs by over 20% in certain regions. Another persistent issue is the difficulty of composite recycling, particularly for thermoset composites.
  • The lack of scalable circular economy solutions for end-of-life products like wind turbine blades threatens the long-term sustainability of glass fiber compared to fully recyclable alternatives. Additionally, intensifying competition from other advanced composite materials, such as carbon fiber and natural fibers, forces producers to innovate continuously to maintain their cost-performance advantage.

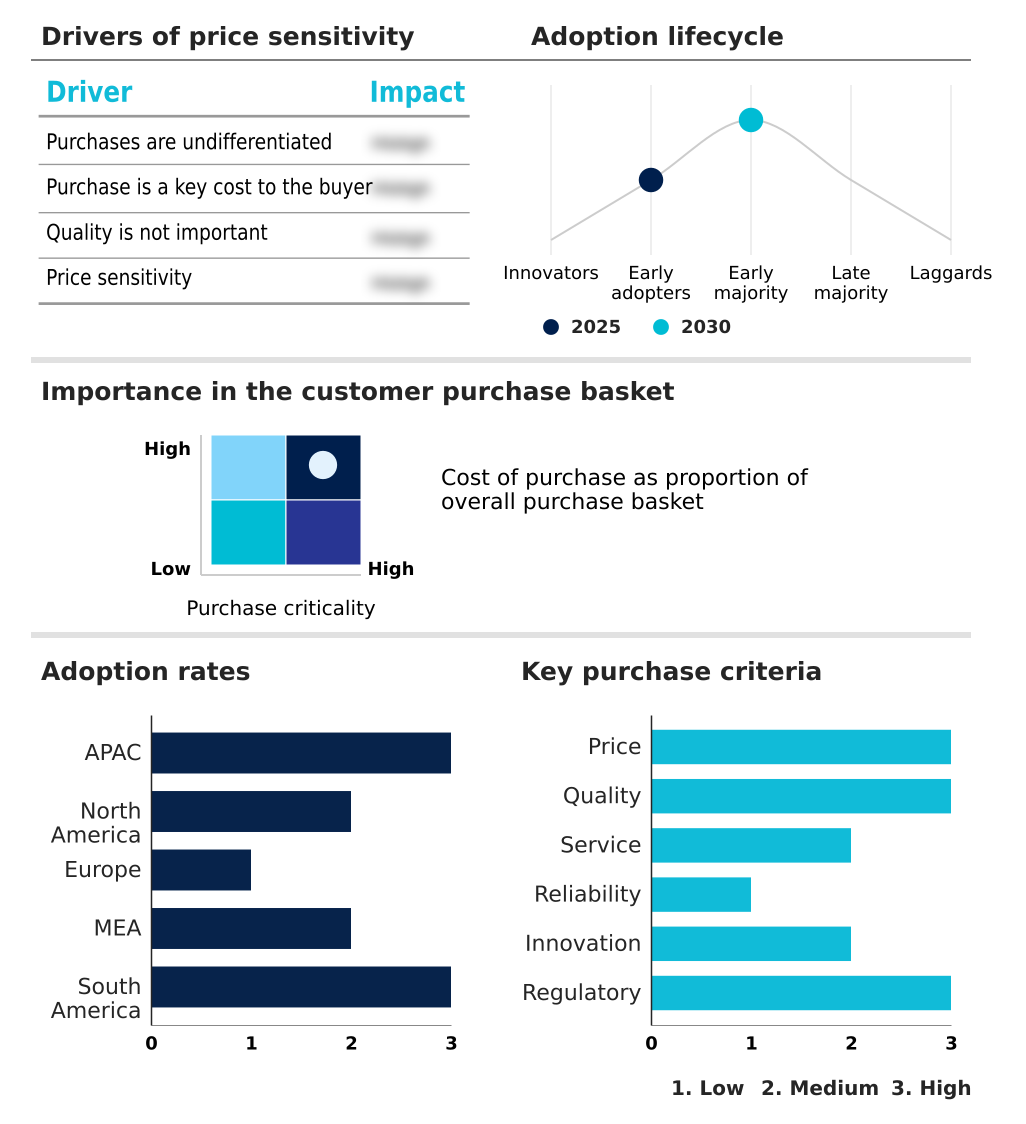
Exclusive Technavio Analysis on Customer Landscape

The glass fiber market forecasting report includes the adoption lifecycle of the market, covering from the innovator’s stage to the laggard’s stage. It focuses on adoption rates in different regions based on penetration. Furthermore, the glass fiber market report also includes key purchase criteria and drivers of price sensitivity to help companies evaluate and develop their market growth analysis strategies.

Customer Landscape of Glass Fiber Industry

Competitive Landscape

Companies are implementing various strategies, such as strategic alliances, glass fiber market forecast, partnerships, mergers and acquisitions, geographical expansion, and product/service launches, to enhance their presence in the industry.

3B the fiberglass Co. - Provides Advantex ECR-glass rovings and HiPer-Tex high-modulus fibers, along with chopped strands engineered for advanced marine and transportation composite applications.

The industry research and growth report includes detailed analyses of the competitive landscape of the market and information about key companies, including:

  • 3B the fiberglass Co.
  • AGY Holding Corp.
  • Ahlstrom Oyj
  • China Jushi Co. Ltd.
  • Chongqing Polycomp International Corp.
  • Compagnie Chomarat
  • Compagnie de Saint Gobain SA
  • Johns Manville Corp.
  • Knauf Insulation
  • Lanxess AG
  • Nippon Electric Glass Co. Ltd.
  • Nitto Boseki Co. Ltd.
  • Owens Corning
  • SAERTEX GmbH and Co. KG
  • Shandong Fiberglass Co. Ltd.
  • Sichuan Weibo Co. Ltd.
  • Taishan Fiberglass Inc.
  • Taiwan Glass Ind. Corp.
  • Xingtai Jinniu Fiberglass Co. Ltd.

Qualitative and quantitative analysis of companies has been conducted to help clients understand the wider business environment as well as the strengths and weaknesses of key industry players. Data is qualitatively analyzed to categorize companies as pure play, category-focused, industry-focused, and diversified; it is quantitatively analyzed to categorize companies as dominant, leading, strong, tentative, and weak.

Recent Development and News in Glass fiber market

  • In May, 2024, Owens Corning completed its acquisition of Masonite International Corp., a move designed to integrate glass fiber technologies into comprehensive residential building solutions.
  • In January, 2025, China Jushi Co. Ltd. commissioned a new intelligent manufacturing production line to produce high-modulus glass fiber rovings for the wind energy and electronics industries.
  • In February, 2025, Lanxess AG introduced a new grade of high-strength glass fiber reinforced polyamide engineered for electric vehicle structural components, offering superior crash resistance.
  • In March, 2025, a partnership between Sinoma Science and Technology and a major automotive manufacturer was announced to develop next-generation lightweight battery packs using advanced glass fiber composite materials.

Dive into Technavio’s robust research methodology, blending expert interviews, extensive data synthesis, and validated models for unparalleled Glass Fiber Market insights. See full methodology.

Market Scope
Page number 303
Base year 2025
Historic period 2020-2024
Forecast period 2026-2030
Growth momentum & CAGR Accelerate at a CAGR of 5.4%
Market growth 2026-2030 USD 4914.9 million
Market structure Fragmented
YoY growth 2025-2026(%) 5.1%
Key countries China, India, Japan, South Korea, Australia, Indonesia, US, Canada, Mexico, Germany, France, UK, Italy, Spain, The Netherlands, Saudi Arabia, UAE, South Africa, Israel, Turkey, Brazil, Argentina and Chile
Competitive landscape Leading Companies, Market Positioning of Companies, Competitive Strategies, and Industry Risks

Request Free Sample

Research Analyst Overview

  • The glass fiber market is defined by a continuous push toward higher performance and sustainability. The use of e-glass fiber and e-cr glass remains foundational, but the industry is seeing a decisive shift toward high-modulus glass fiber and s-glass fiber, especially for demanding applications.
  • Innovations in fiber sizing chemistry and interfacial bonding are improving the performance of glass fiber reinforced plastics and glass fiber reinforced thermoplastics. Boardroom decisions are increasingly focused on the transition from thermoset composites to recyclable thermoplastic composites, which can reduce manufacturing cycle times by over 90% in some cases. This shift addresses both operational efficiency and circular economy mandates.
  • Production methods like filament winding and the pultrusion process are being optimized, while materials such as chopped strands, direct rovings, and woven fabrics see continuous refinement. From alkali-resistant glass in construction to electronic-grade yarns in tech, the market's trajectory is toward specialized, high-value solutions.

What are the Key Data Covered in this Glass Fiber Market Research and Growth Report?

  • What is the expected growth of the Glass Fiber Market between 2026 and 2030?

    • USD 4.91 billion, at a CAGR of 5.4%

  • What segmentation does the market report cover?

    • The report is segmented by Application (Composites, and Insulation), End-user (Construction, Transportation, Consumer products, Wind turbines, and Others), Type (E-glass, E-CR glass, S-glass, and Others) and Geography (APAC, North America, Europe, Middle East and Africa, South America)

  • Which regions are analyzed in the report?

    • APAC, North America, Europe, Middle East and Africa and South America

  • What are the key growth drivers and market challenges?

    • Construction and infrastructure development, Energy volatility and high production costs

  • Who are the major players in the Glass Fiber Market?

    • 3B the fiberglass Co., AGY Holding Corp., Ahlstrom Oyj, China Jushi Co. Ltd., Chongqing Polycomp International Corp., Compagnie Chomarat, Compagnie de Saint Gobain SA, Johns Manville Corp., Knauf Insulation, Lanxess AG, Nippon Electric Glass Co. Ltd., Nitto Boseki Co. Ltd., Owens Corning, SAERTEX GmbH and Co. KG, Shandong Fiberglass Co. Ltd., Sichuan Weibo Co. Ltd., Taishan Fiberglass Inc., Taiwan Glass Ind. Corp. and Xingtai Jinniu Fiberglass Co. Ltd.

Market Research Insights

  • The market is evolving through innovations in material science and manufacturing. The use of automotive lightweighting composites is crucial for automakers, contributing to vehicle weight reductions of up to 30% and improved fuel efficiency. In electronics, demand for advanced printed circuit board substrates has grown with the expansion of 5G infrastructure.
  • Aerospace structural components and marine composite hulls benefit from the high strength-to-weight ratio of these materials. In infrastructure, applications range from concrete reinforcement fibers enhancing durability to high-voltage electrical insulators ensuring grid stability. Intelligent manufacturing adoption is improving output consistency, with some facilities reporting a 15% increase in production efficiency.
  • This highlights a strategic shift toward specialized, high-value applications across key industrial sectors.

We can help! Our analysts can customize this glass fiber market research report to meet your requirements.

Get in touch

1. Executive Summary

1.1 Market overview

Executive Summary - Chart on Market Overview
Executive Summary - Data Table on Market Overview
Executive Summary - Chart on Global Market Characteristics
Executive Summary - Chart on Market by Geography
Executive Summary - Chart on Market Segmentation by Application
Executive Summary - Chart on Market Segmentation by End-user
Executive Summary - Chart on Market Segmentation by Type
Executive Summary - Chart on Incremental Growth
Executive Summary - Data Table on Incremental Growth
Executive Summary - Chart on Company Market Positioning

2. Technavio Analysis

2.1 Analysis of price sensitivity, lifecycle, customer purchase basket, adoption rates, and purchase criteria

2.2 Criticality of inputs and Factors of differentiation

Chart on Overview on criticality of inputs and factors of differentiation

2.3 Factors of disruption

Chart on Overview on factors of disruption

2.4 Impact of drivers and challenges

Chart on Impact of drivers and challenges in 2025 and 2030

3. Market Landscape

3.1 Market ecosystem

Chart on Parent Market
Data Table on - Parent Market

3.2 Market characteristics

Chart on Market characteristics analysis

3.3 Value chain analysis

Chart on Value chain analysis

4. Market Sizing

4.1 Market definition

Data Table on Offerings of companies included in the market definition

4.2 Market segment analysis

Market segments

4.3 Market size 2025

4.4 Market outlook: Forecast for 2025-2030

Chart on Global - Market size and forecast 2025-2030 ($ million)
Data Table on Global - Market size and forecast 2025-2030 ($ million)
Chart on Global Market: Year-over-year growth 2025-2030 (%)
Data Table on Global Market: Year-over-year growth 2025-2030 (%)

5. Historic Market Size

5.1 Global Glass Fiber Market 2020 - 2024

Historic Market Size - Data Table on Global Glass Fiber Market 2020 - 2024 ($ million)

5.2 Application segment analysis 2020 - 2024

Historic Market Size - Application Segment 2020 - 2024 ($ million)

5.3 End-user segment analysis 2020 - 2024

Historic Market Size - End-user Segment 2020 - 2024 ($ million)

5.4 Type segment analysis 2020 - 2024

Historic Market Size - Type Segment 2020 - 2024 ($ million)

5.5 Geography segment analysis 2020 - 2024

Historic Market Size - Geography Segment 2020 - 2024 ($ million)

5.6 Country segment analysis 2020 - 2024

Historic Market Size - Country Segment 2020 - 2024 ($ million)

6. Qualitative Analysis

6.1 Impact of AI in global glass fiber market

7. Five Forces Analysis

7.1 Five forces summary

Five forces analysis - Comparison between 2025 and 2030

7.2 Bargaining power of buyers

Bargaining power of buyers - Impact of key factors 2025 and 2030

7.3 Bargaining power of suppliers

Bargaining power of suppliers - Impact of key factors in 2025 and 2030

7.4 Threat of new entrants

Threat of new entrants - Impact of key factors in 2025 and 2030

7.5 Threat of substitutes

Threat of substitutes - Impact of key factors in 2025 and 2030

7.6 Threat of rivalry

Threat of rivalry - Impact of key factors in 2025 and 2030

7.7 Market condition

Chart on Market condition - Five forces 2025 and 2030

8. Market Segmentation by Application

8.1 Market segments

Chart on Application - Market share 2025-2030 (%)
Data Table on Application - Market share 2025-2030 (%)

8.2 Comparison by Application

Chart on Comparison by Application
Data Table on Comparison by Application

8.3 Composites - Market size and forecast 2025-2030

Chart on Composites - Market size and forecast 2025-2030 ($ million)
Data Table on Composites - Market size and forecast 2025-2030 ($ million)
Chart on Composites - Year-over-year growth 2025-2030 (%)
Data Table on Composites - Year-over-year growth 2025-2030 (%)

8.4 Insulation - Market size and forecast 2025-2030

Chart on Insulation - Market size and forecast 2025-2030 ($ million)
Data Table on Insulation - Market size and forecast 2025-2030 ($ million)
Chart on Insulation - Year-over-year growth 2025-2030 (%)
Data Table on Insulation - Year-over-year growth 2025-2030 (%)

8.5 Market opportunity by Application

Market opportunity by Application ($ million)
Data Table on Market opportunity by Application ($ million)

9. Market Segmentation by End-user

9.1 Market segments

Chart on End-user - Market share 2025-2030 (%)
Data Table on End-user - Market share 2025-2030 (%)

9.2 Comparison by End-user

Chart on Comparison by End-user
Data Table on Comparison by End-user

9.3 Construction - Market size and forecast 2025-2030

Chart on Construction - Market size and forecast 2025-2030 ($ million)
Data Table on Construction - Market size and forecast 2025-2030 ($ million)
Chart on Construction - Year-over-year growth 2025-2030 (%)
Data Table on Construction - Year-over-year growth 2025-2030 (%)

9.4 Transportation - Market size and forecast 2025-2030

Chart on Transportation - Market size and forecast 2025-2030 ($ million)
Data Table on Transportation - Market size and forecast 2025-2030 ($ million)
Chart on Transportation - Year-over-year growth 2025-2030 (%)
Data Table on Transportation - Year-over-year growth 2025-2030 (%)

9.5 Consumer products - Market size and forecast 2025-2030

Chart on Consumer products - Market size and forecast 2025-2030 ($ million)
Data Table on Consumer products - Market size and forecast 2025-2030 ($ million)
Chart on Consumer products - Year-over-year growth 2025-2030 (%)
Data Table on Consumer products - Year-over-year growth 2025-2030 (%)

9.6 Wind turbines - Market size and forecast 2025-2030

Chart on Wind turbines - Market size and forecast 2025-2030 ($ million)
Data Table on Wind turbines - Market size and forecast 2025-2030 ($ million)
Chart on Wind turbines - Year-over-year growth 2025-2030 (%)
Data Table on Wind turbines - Year-over-year growth 2025-2030 (%)

9.7 Others - Market size and forecast 2025-2030

Chart on Others - Market size and forecast 2025-2030 ($ million)
Data Table on Others - Market size and forecast 2025-2030 ($ million)
Chart on Others - Year-over-year growth 2025-2030 (%)
Data Table on Others - Year-over-year growth 2025-2030 (%)

9.8 Market opportunity by End-user

Market opportunity by End-user ($ million)
Data Table on Market opportunity by End-user ($ million)

10. Market Segmentation by Type

10.1 Market segments

Chart on Type - Market share 2025-2030 (%)
Data Table on Type - Market share 2025-2030 (%)

10.2 Comparison by Type

Chart on Comparison by Type
Data Table on Comparison by Type

10.3 E-glass - Market size and forecast 2025-2030

Chart on E-glass - Market size and forecast 2025-2030 ($ million)
Data Table on E-glass - Market size and forecast 2025-2030 ($ million)
Chart on E-glass - Year-over-year growth 2025-2030 (%)
Data Table on E-glass - Year-over-year growth 2025-2030 (%)

10.4 E-CR glass - Market size and forecast 2025-2030

Chart on E-CR glass - Market size and forecast 2025-2030 ($ million)
Data Table on E-CR glass - Market size and forecast 2025-2030 ($ million)
Chart on E-CR glass - Year-over-year growth 2025-2030 (%)
Data Table on E-CR glass - Year-over-year growth 2025-2030 (%)

10.5 S-glass - Market size and forecast 2025-2030

Chart on S-glass - Market size and forecast 2025-2030 ($ million)
Data Table on S-glass - Market size and forecast 2025-2030 ($ million)
Chart on S-glass - Year-over-year growth 2025-2030 (%)
Data Table on S-glass - Year-over-year growth 2025-2030 (%)

10.6 Others - Market size and forecast 2025-2030

Chart on Others - Market size and forecast 2025-2030 ($ million)
Data Table on Others - Market size and forecast 2025-2030 ($ million)
Chart on Others - Year-over-year growth 2025-2030 (%)
Data Table on Others - Year-over-year growth 2025-2030 (%)

10.7 Market opportunity by Type

Market opportunity by Type ($ million)
Data Table on Market opportunity by Type ($ million)

11. Customer Landscape

11.1 Customer landscape overview

Analysis of price sensitivity, lifecycle, customer purchase basket, adoption rates, and purchase criteria

12. Geographic Landscape

12.1 Geographic segmentation

Chart on Market share by geography 2025-2030 (%)
Data Table on Market share by geography 2025-2030 (%)

12.2 Geographic comparison

Chart on Geographic comparison
Data Table on Geographic comparison

12.3 APAC - Market size and forecast 2025-2030

Chart on APAC - Market size and forecast 2025-2030 ($ million)
Data Table on APAC - Market size and forecast 2025-2030 ($ million)
Chart on APAC - Year-over-year growth 2025-2030 (%)
Data Table on APAC - Year-over-year growth 2025-2030 (%)
Chart on Regional Comparison - APAC
Data Table on Regional Comparison - APAC

12.3.1 China - Market size and forecast 2025-2030

Chart on China - Market size and forecast 2025-2030 ($ million)
Data Table on China - Market size and forecast 2025-2030 ($ million)
Chart on China - Year-over-year growth 2025-2030 (%)
Data Table on China - Year-over-year growth 2025-2030 (%)

12.3.2 India - Market size and forecast 2025-2030

Chart on India - Market size and forecast 2025-2030 ($ million)
Data Table on India - Market size and forecast 2025-2030 ($ million)
Chart on India - Year-over-year growth 2025-2030 (%)
Data Table on India - Year-over-year growth 2025-2030 (%)

12.3.3 Japan - Market size and forecast 2025-2030

Chart on Japan - Market size and forecast 2025-2030 ($ million)
Data Table on Japan - Market size and forecast 2025-2030 ($ million)
Chart on Japan - Year-over-year growth 2025-2030 (%)
Data Table on Japan - Year-over-year growth 2025-2030 (%)

12.3.4 South Korea - Market size and forecast 2025-2030

Chart on South Korea - Market size and forecast 2025-2030 ($ million)
Data Table on South Korea - Market size and forecast 2025-2030 ($ million)
Chart on South Korea - Year-over-year growth 2025-2030 (%)
Data Table on South Korea - Year-over-year growth 2025-2030 (%)

12.3.5 Australia - Market size and forecast 2025-2030

Chart on Australia - Market size and forecast 2025-2030 ($ million)
Data Table on Australia - Market size and forecast 2025-2030 ($ million)
Chart on Australia - Year-over-year growth 2025-2030 (%)
Data Table on Australia - Year-over-year growth 2025-2030 (%)

12.3.6 Indonesia - Market size and forecast 2025-2030

Chart on Indonesia - Market size and forecast 2025-2030 ($ million)
Data Table on Indonesia - Market size and forecast 2025-2030 ($ million)
Chart on Indonesia - Year-over-year growth 2025-2030 (%)
Data Table on Indonesia - Year-over-year growth 2025-2030 (%)

12.4 North America - Market size and forecast 2025-2030

Chart on North America - Market size and forecast 2025-2030 ($ million)
Data Table on North America - Market size and forecast 2025-2030 ($ million)
Chart on North America - Year-over-year growth 2025-2030 (%)
Data Table on North America - Year-over-year growth 2025-2030 (%)
Chart on Regional Comparison - North America
Data Table on Regional Comparison - North America

12.4.1 US - Market size and forecast 2025-2030

Chart on US - Market size and forecast 2025-2030 ($ million)
Data Table on US - Market size and forecast 2025-2030 ($ million)
Chart on US - Year-over-year growth 2025-2030 (%)
Data Table on US - Year-over-year growth 2025-2030 (%)

12.4.2 Canada - Market size and forecast 2025-2030

Chart on Canada - Market size and forecast 2025-2030 ($ million)
Data Table on Canada - Market size and forecast 2025-2030 ($ million)
Chart on Canada - Year-over-year growth 2025-2030 (%)
Data Table on Canada - Year-over-year growth 2025-2030 (%)

12.4.3 Mexico - Market size and forecast 2025-2030

Chart on Mexico - Market size and forecast 2025-2030 ($ million)
Data Table on Mexico - Market size and forecast 2025-2030 ($ million)
Chart on Mexico - Year-over-year growth 2025-2030 (%)
Data Table on Mexico - Year-over-year growth 2025-2030 (%)

12.5 Europe - Market size and forecast 2025-2030

Chart on Europe - Market size and forecast 2025-2030 ($ million)
Data Table on Europe - Market size and forecast 2025-2030 ($ million)
Chart on Europe - Year-over-year growth 2025-2030 (%)
Data Table on Europe - Year-over-year growth 2025-2030 (%)
Chart on Regional Comparison - Europe
Data Table on Regional Comparison - Europe

12.5.1 Germany - Market size and forecast 2025-2030

Chart on Germany - Market size and forecast 2025-2030 ($ million)
Data Table on Germany - Market size and forecast 2025-2030 ($ million)
Chart on Germany - Year-over-year growth 2025-2030 (%)
Data Table on Germany - Year-over-year growth 2025-2030 (%)

12.5.2 France - Market size and forecast 2025-2030

Chart on France - Market size and forecast 2025-2030 ($ million)
Data Table on France - Market size and forecast 2025-2030 ($ million)
Chart on France - Year-over-year growth 2025-2030 (%)
Data Table on France - Year-over-year growth 2025-2030 (%)

12.5.3 UK - Market size and forecast 2025-2030

Chart on UK - Market size and forecast 2025-2030 ($ million)
Data Table on UK - Market size and forecast 2025-2030 ($ million)
Chart on UK - Year-over-year growth 2025-2030 (%)
Data Table on UK - Year-over-year growth 2025-2030 (%)

12.5.4 Italy - Market size and forecast 2025-2030

Chart on Italy - Market size and forecast 2025-2030 ($ million)
Data Table on Italy - Market size and forecast 2025-2030 ($ million)
Chart on Italy - Year-over-year growth 2025-2030 (%)
Data Table on Italy - Year-over-year growth 2025-2030 (%)

12.5.5 Spain - Market size and forecast 2025-2030

Chart on Spain - Market size and forecast 2025-2030 ($ million)
Data Table on Spain - Market size and forecast 2025-2030 ($ million)
Chart on Spain - Year-over-year growth 2025-2030 (%)
Data Table on Spain - Year-over-year growth 2025-2030 (%)

12.5.6 The Netherlands - Market size and forecast 2025-2030

Chart on The Netherlands - Market size and forecast 2025-2030 ($ million)
Data Table on The Netherlands - Market size and forecast 2025-2030 ($ million)
Chart on The Netherlands - Year-over-year growth 2025-2030 (%)
Data Table on The Netherlands - Year-over-year growth 2025-2030 (%)

12.6 Middle East and Africa - Market size and forecast 2025-2030

Chart on Middle East and Africa - Market size and forecast 2025-2030 ($ million)
Data Table on Middle East and Africa - Market size and forecast 2025-2030 ($ million)
Chart on Middle East and Africa - Year-over-year growth 2025-2030 (%)
Data Table on Middle East and Africa - Year-over-year growth 2025-2030 (%)
Chart on Regional Comparison - Middle East and Africa
Data Table on Regional Comparison - Middle East and Africa

12.6.1 Saudi Arabia - Market size and forecast 2025-2030

Chart on Saudi Arabia - Market size and forecast 2025-2030 ($ million)
Data Table on Saudi Arabia - Market size and forecast 2025-2030 ($ million)
Chart on Saudi Arabia - Year-over-year growth 2025-2030 (%)
Data Table on Saudi Arabia - Year-over-year growth 2025-2030 (%)

12.6.2 UAE - Market size and forecast 2025-2030

Chart on UAE - Market size and forecast 2025-2030 ($ million)
Data Table on UAE - Market size and forecast 2025-2030 ($ million)
Chart on UAE - Year-over-year growth 2025-2030 (%)
Data Table on UAE - Year-over-year growth 2025-2030 (%)

12.6.3 South Africa - Market size and forecast 2025-2030

Chart on South Africa - Market size and forecast 2025-2030 ($ million)
Data Table on South Africa - Market size and forecast 2025-2030 ($ million)
Chart on South Africa - Year-over-year growth 2025-2030 (%)
Data Table on South Africa - Year-over-year growth 2025-2030 (%)

12.6.4 Israel - Market size and forecast 2025-2030

Chart on Israel - Market size and forecast 2025-2030 ($ million)
Data Table on Israel - Market size and forecast 2025-2030 ($ million)
Chart on Israel - Year-over-year growth 2025-2030 (%)
Data Table on Israel - Year-over-year growth 2025-2030 (%)

12.6.5 Turkey - Market size and forecast 2025-2030

Chart on Turkey - Market size and forecast 2025-2030 ($ million)
Data Table on Turkey - Market size and forecast 2025-2030 ($ million)
Chart on Turkey - Year-over-year growth 2025-2030 (%)
Data Table on Turkey - Year-over-year growth 2025-2030 (%)

12.7 South America - Market size and forecast 2025-2030

Chart on South America - Market size and forecast 2025-2030 ($ million)
Data Table on South America - Market size and forecast 2025-2030 ($ million)
Chart on South America - Year-over-year growth 2025-2030 (%)
Data Table on South America - Year-over-year growth 2025-2030 (%)
Chart on Regional Comparison - South America
Data Table on Regional Comparison - South America

12.7.1 Brazil - Market size and forecast 2025-2030

Chart on Brazil - Market size and forecast 2025-2030 ($ million)
Data Table on Brazil - Market size and forecast 2025-2030 ($ million)
Chart on Brazil - Year-over-year growth 2025-2030 (%)
Data Table on Brazil - Year-over-year growth 2025-2030 (%)

12.7.2 Argentina - Market size and forecast 2025-2030

Chart on Argentina - Market size and forecast 2025-2030 ($ million)
Data Table on Argentina - Market size and forecast 2025-2030 ($ million)
Chart on Argentina - Year-over-year growth 2025-2030 (%)
Data Table on Argentina - Year-over-year growth 2025-2030 (%)

12.7.3 Chile - Market size and forecast 2025-2030

Chart on Chile - Market size and forecast 2025-2030 ($ million)
Data Table on Chile - Market size and forecast 2025-2030 ($ million)
Chart on Chile - Year-over-year growth 2025-2030 (%)
Data Table on Chile - Year-over-year growth 2025-2030 (%)

12.8 Market opportunity by geography

Market opportunity by geography ($ million)
Data Tables on Market opportunity by geography ($ million)

13. Drivers, Challenges, and Opportunity

13.1 Market drivers

Construction and infrastructure development
Surge in wind energy installations
Lightweighting in automotive industry

13.2 Market challenges

Energy volatility and high production costs
Recycling and end-of-life disposal issues
Competition from alternative materials

13.3 Impact of drivers and challenges

Impact of drivers and challenges in 2025 and 2030

13.4 Market opportunities

Shift toward high-modulus and high-performance glass fibers
Adoption of intelligent manufacturing and digitalization
Transition from thermoset to thermoplastic composites

14. Competitive Landscape

14.1 Overview

14.2

Overview on criticality of inputs and factors of differentiation

14.3 Landscape disruption

Overview on factors of disruption

14.4 Industry risks

Impact of key risks on business

15. Competitive Analysis

15.1 Companies profiled

Companies covered

15.2 Company ranking index

15.3 Market positioning of companies

Matrix on companies position and classification

15.4 3B the fiberglass Co.

3B the fiberglass Co. - Overview
3B the fiberglass Co. - Product / Service
3B the fiberglass Co. - Key offerings
SWOT

15.5 AGY Holding Corp.

AGY Holding Corp. - Overview
AGY Holding Corp. - Product / Service
AGY Holding Corp. - Key offerings
SWOT

15.6 Ahlstrom Oyj

Ahlstrom Oyj - Overview
Ahlstrom Oyj - Product / Service
Ahlstrom Oyj - Key news
Ahlstrom Oyj - Key offerings
SWOT

15.7 China Jushi Co. Ltd.

China Jushi Co. Ltd. - Overview
China Jushi Co. Ltd. - Product / Service
China Jushi Co. Ltd. - Key offerings
SWOT

15.8 Chongqing Polycomp International Corp.

Chongqing Polycomp International Corp. - Overview
Chongqing Polycomp International Corp. - Product / Service
Chongqing Polycomp International Corp. - Key offerings
SWOT

15.9 Compagnie Chomarat

Compagnie Chomarat - Overview
Compagnie Chomarat - Product / Service
Compagnie Chomarat - Key offerings
SWOT

15.10 Compagnie de Saint Gobain SA

Compagnie de Saint Gobain SA - Overview
Compagnie de Saint Gobain SA - Business segments
Compagnie de Saint Gobain SA - Key news
Compagnie de Saint Gobain SA - Key offerings
Compagnie de Saint Gobain SA - Segment focus
SWOT

15.11 Johns Manville Corp.

Johns Manville Corp. - Overview
Johns Manville Corp. - Product / Service
Johns Manville Corp. - Key offerings
SWOT

15.12 Nippon Electric Glass Co. Ltd.

Nippon Electric Glass Co. Ltd. - Overview
Nippon Electric Glass Co. Ltd. - Product / Service
Nippon Electric Glass Co. Ltd. - Key offerings
SWOT

15.13 Nitto Boseki Co. Ltd.

Nitto Boseki Co. Ltd. - Overview
Nitto Boseki Co. Ltd. - Business segments
Nitto Boseki Co. Ltd. - Key offerings
Nitto Boseki Co. Ltd. - Segment focus
SWOT

15.14 Owens Corning

Owens Corning - Overview
Owens Corning - Business segments
Owens Corning - Key news
Owens Corning - Key offerings
Owens Corning - Segment focus
SWOT

15.15 SAERTEX GmbH and Co. KG

SAERTEX GmbH and Co. KG - Overview
SAERTEX GmbH and Co. KG - Product / Service
SAERTEX GmbH and Co. KG - Key offerings
SWOT

15.16 Shandong Fiberglass Co. Ltd.

Shandong Fiberglass Co. Ltd. - Overview
Shandong Fiberglass Co. Ltd. - Product / Service
Shandong Fiberglass Co. Ltd. - Key offerings
SWOT

15.17 Taishan Fiberglass Inc.

Taishan Fiberglass Inc. - Overview
Taishan Fiberglass Inc. - Product / Service
Taishan Fiberglass Inc. - Key offerings
SWOT

15.18 Taiwan Glass Ind. Corp.

Taiwan Glass Ind. Corp. - Overview
Taiwan Glass Ind. Corp. - Business segments
Taiwan Glass Ind. Corp. - Key offerings
Taiwan Glass Ind. Corp. - Segment focus
SWOT

16. Appendix

16.1 Scope of the report

Market definition
Objectives
Notes and caveats

16.2 Inclusions and exclusions checklist

Inclusions checklist
Exclusions checklist

16.3 Currency conversion rates for US$

16.4 Research methodology

16.5 Data procurement

Information sources

16.6 Data validation

16.7 Validation techniques employed for market sizing

16.8 Data synthesis

16.9 360 degree market analysis

16.10 List of abbreviations

Research Methodology

Technavio presents a detailed picture of the market by way of study, synthesis, and summation of data from multiple sources. The analysts have presented the various facets of the market with a particular focus on identifying the key industry influencers. The data thus presented is comprehensive, reliable, and the result of extensive research, both primary and secondary.

INFORMATION SOURCES

Primary sources

  • Manufacturers and suppliers
  • Channel partners
  • Industry experts
  • Strategic decision makers

Secondary sources

  • Industry journals and periodicals
  • Government data
  • Financial reports of key industry players
  • Historical data
  • Press releases

DATA ANALYSIS

Data Synthesis

  • Collation of data
  • Estimation of key figures
  • Analysis of derived insights

Data Validation

  • Triangulation with data models
  • Reference against proprietary databases
  • Corroboration with industry experts

REPORT WRITING

Qualitative

  • Market drivers
  • Market challenges
  • Market trends
  • Five forces analysis

Quantitative

  • Market size and forecast
  • Market segmentation
  • Geographical insights
  • Competitive landscape

Interested in this report?

Get your sample now to see our research methodology and insights!

Download Now

Frequently Asked Questions

Glass Fiber market growth will increase by USD 4914.9 million during 2026-2030 .

The Glass Fiber market is expected to grow at a CAGR of 5.4% during 2026-2030 .

Glass Fiber market is segmented by Application (Composites, Insulation) End-user (Construction, Transportation, Consumer products, Wind turbines, Others) Type (E-glass, E-CR glass, S-glass, Others)

3B the fiberglass Co., AGY Holding Corp., Ahlstrom Oyj, China Jushi Co. Ltd., Chongqing Polycomp International Corp., Compagnie Chomarat, Compagnie de Saint Gobain SA, Johns Manville Corp., Knauf Insulation, Lanxess AG, Nippon Electric Glass Co. Ltd., Nitto Boseki Co. Ltd., Owens Corning, SAERTEX GmbH and Co. KG, Shandong Fiberglass Co. Ltd., Sichuan Weibo Co. Ltd., Taishan Fiberglass Inc., Taiwan Glass Ind. Corp., Xingtai Jinniu Fiberglass Co. Ltd. are a few of the key vendors in the Glass Fiber market.

APAC will register the highest growth rate of 51.7% among the other regions. Therefore, the Glass Fiber market in APAC is expected to garner significant business opportunities for the vendors during the forecast period.

China, India, Japan, South Korea, Australia, Indonesia, US, Canada, Mexico, Germany, France, UK, Italy, Spain, The Netherlands, Saudi Arabia, UAE, South Africa, Israel, Turkey, Brazil, Argentina, Chile

  • Construction and infrastructure development is the driving factor this market.

The Glass Fiber market vendors should focus on grabbing business opportunities from the Application segment as it accounted for the largest market share in the base year.