Ballistic Protection Market Analysis North America, Europe, APAC, Middle East and Africa, South America - US, China, Russia, India, UK - Size and Forecast 2024-2028

Ballistic Protection Market Analysis North America, Europe, APAC, Middle East and Africa, South America - US, China, Russia, India, UK - Size and Forecast 2024-2028

Published: Jul 2024 165 Pages SKU: IRTNTR44809

Market Overview at a Glance

$3.16 B
Market Opportunity
4.33%
CAGR
3.43
YoY growth 2023-2024(%)

Ballistic Protection Market Size 2024-2028

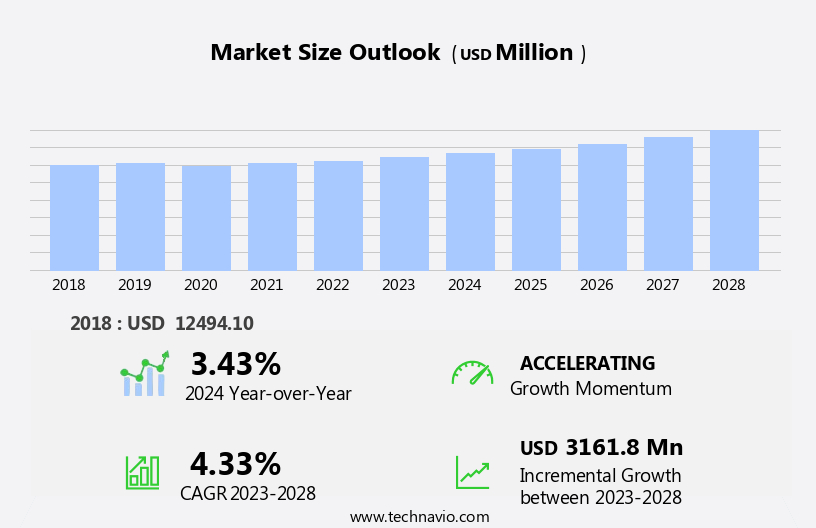
The ballistic protection market size is forecast to increase by USD 3.16 billion at a CAGR of 4.33% between 2023 and 2028.

  • The market is driven by several factors, including the increasing threat of terror attacks and the need for soldier modernization technologies. The demand for personnel protection equipment (PPE) and vehicle protection equipment (VPE) is on the rise, particularly In the land, airborne, and marine sectors. Defense naval vessels require advanced ballistic protection against weapons and ammunition, as well as improvised explosive devices (IEDs). Defense expenditure continues to increase as countries prioritize security and safety. Innovations in materials used for bulletproof vests, such as advanced ceramics and nanotechnology, are leading to lighter and more effective solutions. The automation of warfare and defense systems is also reducing troop size, leading to a greater focus on providing effective ballistic protection for those on the front lines. This trend is expected to continue, with the market showing steady growth In the coming years.

What will be the Size of the Ballistic Protection Market During the Forecast Period?

Ballistic Protection Market Size

 Request Free Sample

  • The market plays a crucial role in safeguarding various sectors, including military, law enforcement, and civilian applications, from the threats posed by bullets, explosive materials, mortar, mines, electrical shocks, heat, and other hazardous agents. This market encompasses a wide range of products designed to protect personnel and armored vehicles from potential harm. The military sector is a significant consumer of ballistic protection equipment, with the primary focus on safeguarding soldiers and army vehicles. Homeland security forces and police departments also rely heavily on these solutions to ensure the safety of their personnel during inter border conflicts, terrorism threats, and geopolitical tensions.
  • First responders and VIP security personnel are other key end-users of ballistic protection equipment. The material science community is at the forefront of developing advanced materials, such as Kevlar glass and aramid fibers, for manufacturing ballistic protection products. These materials offer superior protection against weapons, ammunition, improvised explosive devices (IEDs), and other munitions. Defense expenditure, a critical factor influencing the market, continues to increase due to the growing need for military modernization and the rising number of defense partnerships and strategic collaborations. The defense budgets of various countries allocate significant resources to procure body armor and vehicle protection equipment to counteract the evolving threats.  Ceramics, a key material used in manufacturing ballistic protection components, offer excellent ballistic protection against various threats.

How is this Ballistic Protection Industry segmented and which is the largest segment?

The industry research report provides comprehensive data (region-wise segment analysis), with forecasts and estimates in "USD million" for the period 2024-2028, as well as historical data from 2018-2022 for the following segments.
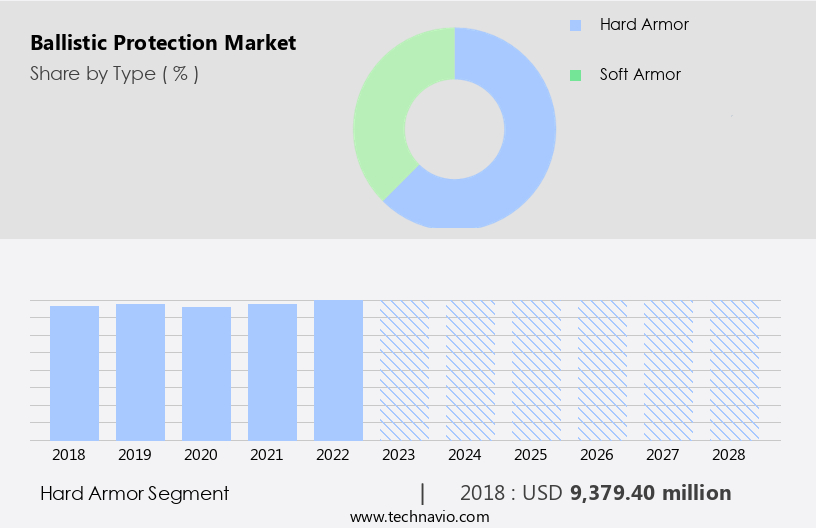
  • Type
    • Hard armor
    • Soft armor
  • Application
    • Defense
    • Homeland security
    • Commercial
  • Geography
    • North America
      • US
    • Europe
      • UK
    • APAC
      • China
      • India
    • Middle East and Africa
    • South America

By Type Insights

  • The hard armor segment is estimated to witness significant growth during the forecast period.

In the market, the hard armor segment is projected to expand significantly due to the increasing demand for advanced protection against high-threat projectiles. Defense personnel require enhanced body armor solutions when confronted with dangerous scenarios, such as terrorist attacks. Hard armor plates, also known as HAP, serve as essential components in such situations. These plates are inserted into vest pockets to complement soft armor or function as standalone components in plate carrier vests. They are engineered to resist penetration from high-velocity bullets, including rifle and armor-piercing rounds. The use of materials like aluminum, steel, composite, and even uranium in hard armor plates adds to their protective capabilities.

Mission requirements on the battlefield dictate the need for these high-tech systems, which can also be employed by law enforcement officers for riot control and counter-terrorism operations.

Ballistic Protection Market Size

Get a glance at the market report of share of various segments Request Free Sample

The Hard armor segment was valued at USD 9.38 billion in 2018 and showed a gradual increase during the forecast period.

Regional Analysis

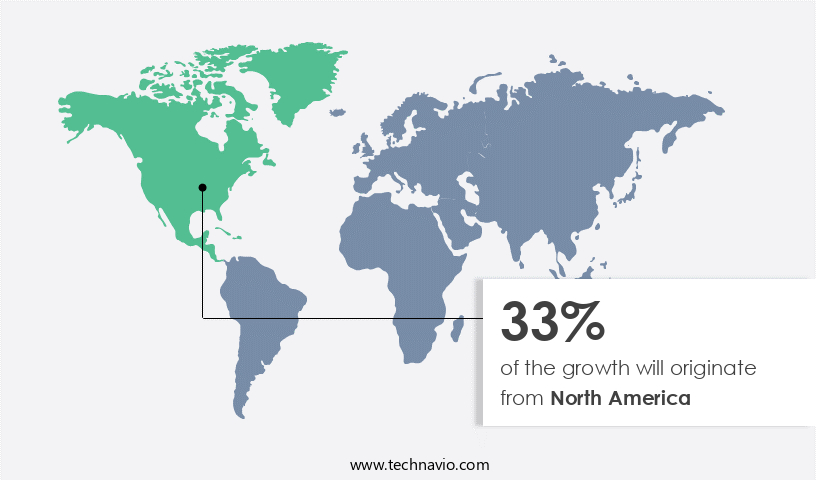
  • North America is estimated to contribute 33% to the growth of the global market during the forecast period.

Technavio's analysts have elaborately explained the regional trends and drivers that shape the market during the forecast period.

Ballistic Protection Market Share by Geography

For more insights on the market size of various regions, Request Free Sample

In response to escalating security threats both domestically and internationally, the North American market for ballistic protection products is experiencing significant growth. This trend is driven by several factors, including the increasing prevalence of terrorist activities, the demand for enhanced protection for military personnel, and the rising popularity of armored commercial vehicles. In the military sector, there is a growing focus on equipping soldiers with advanced ballistic protection gear, such as helmets and body armor, to safeguard against bullets, explosive materials, mortar attacks, electrical shocks, heat, chemicals, and biohazards. Additionally, the homeland security sector and commercial industries are increasingly investing in ballistic protection solutions to shield against potential threats. The US, in particular, is prioritizing modernization programs for personal protective equipment to ensure the safety of its armed forces, especially ground troops.

Market Dynamics

Our researchers analyzed the data with 2023 as the base year, along with the key drivers, trends, and challenges. A holistic analysis of drivers will help companies refine their marketing strategies to gain a competitive advantage.

What are the key market drivers leading to the rise In the adoption of Ballistic Protection Industry?

Rising focus on lightweighting of ballistic protection equipment is the key driver of the market.

  • The market caters to the demand for protective equipment for soldiers, army vehicles, and homeland security forces against various threats such as bullets, explosive materials, mortar, mines, electrical shocks, heat, chemicals, and biohazards.
  • Moreover, fiberglass manufacturers and fabric manufacturers play a crucial role in producing Personal Protective Equipment (PPE) like fiber vests and composite helmets using advanced ballistic composites such as Aramid fiber (Kevlar) and hard-facing inserts. The production process of these armor materials is a critical focus for the material science community to enhance the protective capabilities while reducing weight and cost. Thus, such factors are driving the growth of the market during the forecast period.

What are the market trends shaping the Ballistic Protection Industry?

Innovations in materials used for bulletproof vests is the upcoming market trend.

  • The market caters to the demand for protective equipment for soldiers, army vehicles, and homeland security forces against various threats, including bullets, explosive materials, mortar, mines, electrical shocks, heat, chemicals, and biohazards.
  • Moreover, fiberglass manufacturers and fabric manufacturers play a crucial role in producing Personal Protective Equipment (PPE) such as fiber vests and composite helmets using advanced ballistic composites like Aramid fiber and Kevlar. The production process involves the use of hard-facing inserts and armor materials to enhance the protective capabilities of these products. Thus, such trends will shape the growth of the market during the forecast period.

What challenges does the Ballistic Protection Industry face during its growth?

Automation of warfare and defense systems leading to reduction in troop size is a key challenge affecting the industry growth.

  • The market caters to the demand for protective solutions for soldiers, army vehicles, and homeland security personnel against various threats, including bullets, explosive materials, mortar, mines, electrical shocks, heat, chemicals, and biohazards.
  • Moreover, fiberglass manufacturers and fabric manufacturers play a crucial role in producing Personal Protective Equipment (PPE) such as fiber vests and composite helmets using advanced materials like Aramid fiber (e.g., Kevlar) and ballistic composites. Hence, the above factors will impede the growth of the market during the forecast period

Exclusive Customer Landscape

The market forecasting report includes the adoption lifecycle of the market, covering from the innovator's stage to the laggard's stage. It focuses on adoption rates in different regions based on penetration. Furthermore, the market report also includes key purchase criteria and drivers of price sensitivity to help companies evaluate and develop their market growth analysis strategies.
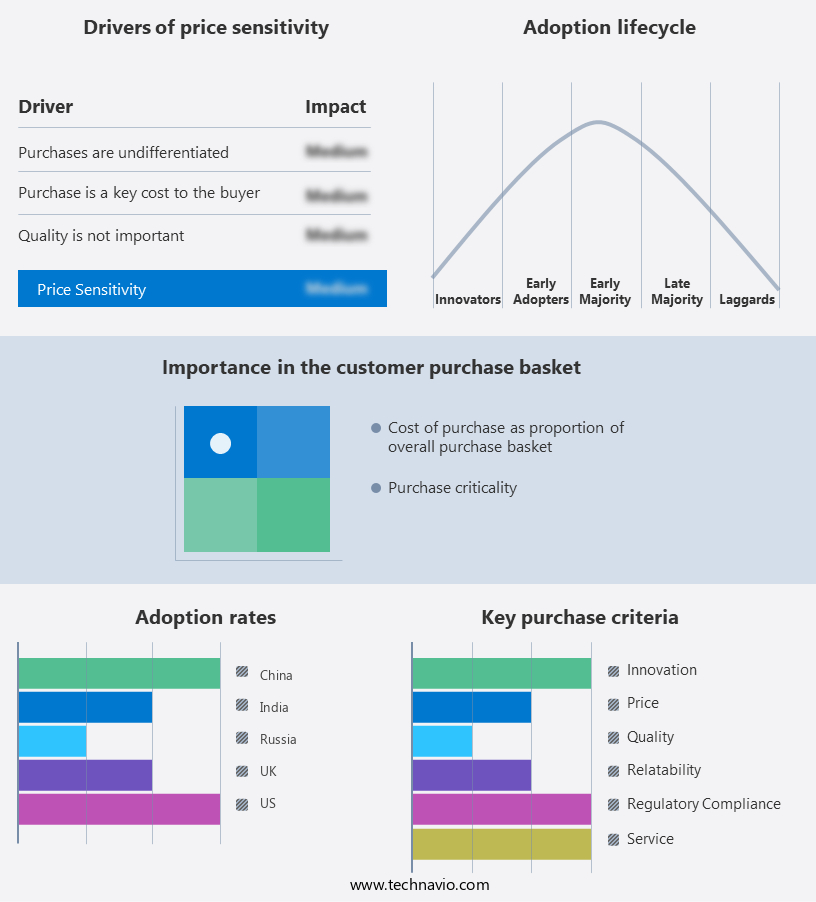
Ballistic Protection Market Share by Geography

 Customer Landscape

Key Companies & Market Insights

Companies are implementing various strategies, such as strategic alliances, market forecast, partnerships, mergers and acquisitions, geographical expansion, and product/service launches, to enhance their presence In the industry.

The industry research and growth report includes detailed analyses of the competitive landscape of the market and information about key companies, including:

  • 3M Co.
  • Avon Polymer Products Ltd.
  • BAE Systems Plc
  • Barrday Inc.
  • Cooneen Group
  • CQC House
  • Craig International Ballistics Pty. Ltd.
  • DuPont de Nemours Inc.
  • FMS Enterprises Migun Ltd
  • Hellweg International Pty Ltd.
  • Honeywell International Inc.
  • TenCate Fabrics
  • MKU Ltd.
  • Point Blank Enterprises Inc.
  • Revision Inc.
  • Rheinmetall AG
  • Saab AB
  • Safariland LLC
  • Seyntex NV
  • Teijin Ltd.

Qualitative and quantitative analysis of companies has been conducted to help clients understand the wider business environment as well as the strengths and weaknesses of key industry players. Data is qualitatively analyzed to categorize companies as pure play, category-focused, industry-focused, and diversified; it is quantitatively analyzed to categorize companies as dominant, leading, strong, tentative, and weak.

Research Analyst Overview

The market encompasses various applications for soldiers, army vehicles, and homeland security forces to safeguard against threats such as bullets, explosive materials, mortar, mines, electrical shocks, heat, chemicals, and biohazards. The market caters to the production of personal protective equipment (PPE) like fiberglass and fabric manufacturers, offering soft armor and hard armor solutions. These materials include aramid fiber, Kevlar, and ceramics. The military, police, first responders, and VIP security personnel rely on these advanced ballistic composites to counteract terror attacks, inter-border conflicts, and mission requirements in battlefield scenarios. The production process involves the use of high-tech systems and intellectual property theft protection.

Moreover, the market extends to various segments, including marine, land, and airborne applications, such as defense naval vessels and armored vehicles. The increasing terror threats, soldier modernization technologies, and defense expenditure necessitate the development of advanced ballistic protection materials like composite helmets, fiber vests, and hard facing inserts. Material science community collaborations and defense partnerships play a crucial role in addressing the evolving security challenges, including weapons, ammunition, improvised explosive devices, guided missiles, frag grenades, and munitions. The market also caters to the production of protective headgear, armor materials, and personal safety equipment for law enforcement officers and policemen.

Furthermore, the use of lightweight materials like aluminum, steel, glass, plastic, uranium, composite, and aramid fibers ensures high performance and adaptability to various mission requirements and impact velocities. The market continues to grow due to the increasing geopolitical tensions and crime rates, necessitating strong security solutions for personnel and vehicle protection.

Market Scope

Report Coverage

Details

Page number

165

Base year

2023

Historic period

2018-2022

Forecast period

2024-2028

Growth momentum & CAGR

Accelerate at a CAGR of 4.33%

Market Growth 2024-2028

USD 3.16 billion

Market structure

Fragmented

YoY growth 2023-2024(%)

3.43

Key countries

US, China, Russia, India, and UK

Competitive landscape

Leading Companies, Market Positioning of Companies, Competitive Strategies, and Industry Risks

Request Free Sample

What are the Key Data Covered in this Ballistic Protection Market Research and Growth Report?

  • CAGR of the Ballistic Protection industry during the forecast period
  • Detailed information on factors that will drive the market growth and forecasting between 2024 and 2028
  • Precise estimation of the size of the market and its contribution of the industry in focus to the parent market
  • Accurate predictions about upcoming growth and trends and changes in consumer behaviour
  • Growth of the market across North America, Europe, APAC, Middle East and Africa, and South America
  • Thorough analysis of the market's competitive landscape and detailed information about companies
  • Comprehensive analysis of factors that will challenge the ballistic protection market growth of industry companies

We can help! Our analysts can customize this ballistic protection market research report to meet your requirements.

Get in touch

1 Executive Summary

  • 1.1 Market overview
    • Executive Summary - Chart on Market Overview
    • Executive Summary - Data Table on Market Overview
    • Executive Summary - Chart on Global Market Characteristics
    • Executive Summary - Chart on Market by Geography
    • Executive Summary - Chart on Market Segmentation by Type
    • Executive Summary - Chart on Market Segmentation by Application
    • Executive Summary - Chart on Incremental Growth
    • Executive Summary - Data Table on Incremental Growth
    • Executive Summary - Chart on Company Market Positioning

2 Market Landscape

  • 2.1 Market ecosystem
    • Parent Market
    • Data Table on - Parent Market
  • 2.2 Market characteristics
    • Market characteristics analysis
  • 2.3 Value chain analysis
    • Value Chain Analysis

3 Market Sizing

  • 3.1 Market definition
    • Offerings of companies included in the market definition
  • 3.2 Market segment analysis
    • Market segments
  • 3.3 Market size 2023
    • 3.4 Market outlook: Forecast for 2023-2028
      • Chart on Global - Market size and forecast 2023-2028 ($ million)
      • Data Table on Global - Market size and forecast 2023-2028 ($ million)
      • Chart on Global Market: Year-over-year growth 2023-2028 (%)
      • Data Table on Global Market: Year-over-year growth 2023-2028 (%)

    4 Historic Market Size

    • 4.1 Global Ballistic Protection Market 2018 - 2022
      • Historic Market Size - Data Table on Global Ballistic Protection Market 2018 - 2022 ($ million)
    • 4.2 Type segment analysis 2018 - 2022
      • Historic Market Size - Type Segment 2018 - 2022 ($ million)
    • 4.3 Application segment analysis 2018 - 2022
      • Historic Market Size - Application Segment 2018 - 2022 ($ million)
    • 4.4 Geography segment analysis 2018 - 2022
      • Historic Market Size - Geography Segment 2018 - 2022 ($ million)
    • 4.5 Country segment analysis 2018 - 2022
      • Historic Market Size - Country Segment 2018 - 2022 ($ million)

    5 Five Forces Analysis

    • 5.1 Five forces summary
      • Five forces analysis - Comparison between 2023 and 2028
    • 5.2 Bargaining power of buyers
      • Bargaining power of buyers - Impact of key factors 2023 and 2028
    • 5.3 Bargaining power of suppliers
      • Bargaining power of suppliers - Impact of key factors in 2023 and 2028
    • 5.4 Threat of new entrants
      • Threat of new entrants - Impact of key factors in 2023 and 2028
    • 5.5 Threat of substitutes
      • Threat of substitutes - Impact of key factors in 2023 and 2028
    • 5.6 Threat of rivalry
      • Threat of rivalry - Impact of key factors in 2023 and 2028
    • 5.7 Market condition
      • Chart on Market condition - Five forces 2023 and 2028

    6 Market Segmentation by Type

    • 6.1 Market segments
      • Chart on Type - Market share 2023-2028 (%)
      • Data Table on Type - Market share 2023-2028 (%)
    • 6.2 Comparison by Type
      • Chart on Comparison by Type
      • Data Table on Comparison by Type
    • 6.3 Hard armor - Market size and forecast 2023-2028
      • Chart on Hard armor - Market size and forecast 2023-2028 ($ million)
      • Data Table on Hard armor - Market size and forecast 2023-2028 ($ million)
      • Chart on Hard armor - Year-over-year growth 2023-2028 (%)
      • Data Table on Hard armor - Year-over-year growth 2023-2028 (%)
    • 6.4 Soft armor - Market size and forecast 2023-2028
      • Chart on Soft armor - Market size and forecast 2023-2028 ($ million)
      • Data Table on Soft armor - Market size and forecast 2023-2028 ($ million)
      • Chart on Soft armor - Year-over-year growth 2023-2028 (%)
      • Data Table on Soft armor - Year-over-year growth 2023-2028 (%)
    • 6.5 Market opportunity by Type
      • Market opportunity by Type ($ million)
      • Data Table on Market opportunity by Type ($ million)

    7 Market Segmentation by Application

    • 7.1 Market segments
      • Chart on Application - Market share 2023-2028 (%)
      • Data Table on Application - Market share 2023-2028 (%)
    • 7.2 Comparison by Application
      • Chart on Comparison by Application
      • Data Table on Comparison by Application
    • 7.3 Defense - Market size and forecast 2023-2028
      • Chart on Defense - Market size and forecast 2023-2028 ($ million)
      • Data Table on Defense - Market size and forecast 2023-2028 ($ million)
      • Chart on Defense - Year-over-year growth 2023-2028 (%)
      • Data Table on Defense - Year-over-year growth 2023-2028 (%)
    • 7.4 Homeland security - Market size and forecast 2023-2028
      • Chart on Homeland security - Market size and forecast 2023-2028 ($ million)
      • Data Table on Homeland security - Market size and forecast 2023-2028 ($ million)
      • Chart on Homeland security - Year-over-year growth 2023-2028 (%)
      • Data Table on Homeland security - Year-over-year growth 2023-2028 (%)
    • 7.5 Commercial - Market size and forecast 2023-2028
      • Chart on Commercial - Market size and forecast 2023-2028 ($ million)
      • Data Table on Commercial - Market size and forecast 2023-2028 ($ million)
      • Chart on Commercial - Year-over-year growth 2023-2028 (%)
      • Data Table on Commercial - Year-over-year growth 2023-2028 (%)
    • 7.6 Market opportunity by Application
      • Market opportunity by Application ($ million)
      • Data Table on Market opportunity by Application ($ million)

    8 Customer Landscape

    • 8.1 Customer landscape overview
      • Analysis of price sensitivity, lifecycle, customer purchase basket, adoption rates, and purchase criteria

    9 Geographic Landscape

    • 9.1 Geographic segmentation
      • Chart on Market share by geography 2023-2028 (%)
      • Data Table on Market share by geography 2023-2028 (%)
    • 9.2 Geographic comparison
      • Chart on Geographic comparison
      • Data Table on Geographic comparison
    • 9.3 North America - Market size and forecast 2023-2028
      • Chart on North America - Market size and forecast 2023-2028 ($ million)
      • Data Table on North America - Market size and forecast 2023-2028 ($ million)
      • Chart on North America - Year-over-year growth 2023-2028 (%)
      • Data Table on North America - Year-over-year growth 2023-2028 (%)
    • 9.4 Europe - Market size and forecast 2023-2028
      • Chart on Europe - Market size and forecast 2023-2028 ($ million)
      • Data Table on Europe - Market size and forecast 2023-2028 ($ million)
      • Chart on Europe - Year-over-year growth 2023-2028 (%)
      • Data Table on Europe - Year-over-year growth 2023-2028 (%)
    • 9.5 APAC - Market size and forecast 2023-2028
      • Chart on APAC - Market size and forecast 2023-2028 ($ million)
      • Data Table on APAC - Market size and forecast 2023-2028 ($ million)
      • Chart on APAC - Year-over-year growth 2023-2028 (%)
      • Data Table on APAC - Year-over-year growth 2023-2028 (%)
    • 9.6 Middle East and Africa - Market size and forecast 2023-2028
      • Chart on Middle East and Africa - Market size and forecast 2023-2028 ($ million)
      • Data Table on Middle East and Africa - Market size and forecast 2023-2028 ($ million)
      • Chart on Middle East and Africa - Year-over-year growth 2023-2028 (%)
      • Data Table on Middle East and Africa - Year-over-year growth 2023-2028 (%)
    • 9.7 South America - Market size and forecast 2023-2028
      • Chart on South America - Market size and forecast 2023-2028 ($ million)
      • Data Table on South America - Market size and forecast 2023-2028 ($ million)
      • Chart on South America - Year-over-year growth 2023-2028 (%)
      • Data Table on South America - Year-over-year growth 2023-2028 (%)
    • 9.8 US - Market size and forecast 2023-2028
      • Chart on US - Market size and forecast 2023-2028 ($ million)
      • Data Table on US - Market size and forecast 2023-2028 ($ million)
      • Chart on US - Year-over-year growth 2023-2028 (%)
      • Data Table on US - Year-over-year growth 2023-2028 (%)
    • 9.9 China - Market size and forecast 2023-2028
      • Chart on China - Market size and forecast 2023-2028 ($ million)
      • Data Table on China - Market size and forecast 2023-2028 ($ million)
      • Chart on China - Year-over-year growth 2023-2028 (%)
      • Data Table on China - Year-over-year growth 2023-2028 (%)
    • 9.10 Russia - Market size and forecast 2023-2028
      • Chart on Russia - Market size and forecast 2023-2028 ($ million)
      • Data Table on Russia - Market size and forecast 2023-2028 ($ million)
      • Chart on Russia - Year-over-year growth 2023-2028 (%)
      • Data Table on Russia - Year-over-year growth 2023-2028 (%)
    • 9.11 India - Market size and forecast 2023-2028
      • Chart on India - Market size and forecast 2023-2028 ($ million)
      • Data Table on India - Market size and forecast 2023-2028 ($ million)
      • Chart on India - Year-over-year growth 2023-2028 (%)
      • Data Table on India - Year-over-year growth 2023-2028 (%)
    • 9.12 UK - Market size and forecast 2023-2028
      • Chart on UK - Market size and forecast 2023-2028 ($ million)
      • Data Table on UK - Market size and forecast 2023-2028 ($ million)
      • Chart on UK - Year-over-year growth 2023-2028 (%)
      • Data Table on UK - Year-over-year growth 2023-2028 (%)
    • 9.13 Market opportunity by geography
      • Market opportunity by geography ($ million)
      • Data Tables on Market opportunity by geography ($ million)

    10 Drivers, Challenges, and Opportunity/Restraints

    • 10.1 Market drivers
      • 10.2 Market challenges
        • 10.3 Impact of drivers and challenges
          • Impact of drivers and challenges in 2023 and 2028
        • 10.4 Market opportunities/restraints

          11 Competitive Landscape

          • 11.1 Overview
            • 11.2 Competitive Landscape
              • Overview on criticality of inputs and factors of differentiation
            • 11.3 Landscape disruption
              • Overview on factors of disruption
            • 11.4 Industry risks
              • Impact of key risks on business

            12 Competitive Analysis

            • 12.1 Companies profiled
              • Companies covered
            • 12.2 Market positioning of companies
              • Matrix on companies position and classification
            • 3M Co.
              • 3M Co. - Overview
              • 3M Co. - Business segments
              • 3M Co. - Key news
              • 3M Co. - Key offerings
              • 3M Co. - Segment focus
            • 12.4 Avon Polymer Products Ltd.
              • Avon Polymer Products Ltd. - Overview
              • Avon Polymer Products Ltd. - Product / Service
              • Avon Polymer Products Ltd. - Key offerings
            • 12.5 BAE Systems Plc
              • BAE Systems Plc - Overview
              • BAE Systems Plc - Business segments
              • BAE Systems Plc - Key news
              • BAE Systems Plc - Key offerings
              • BAE Systems Plc - Segment focus
            • 12.6 Craig International Ballistics Pty. Ltd.
              • Craig International Ballistics Pty. Ltd. - Overview
              • Craig International Ballistics Pty. Ltd. - Product / Service
              • Craig International Ballistics Pty. Ltd. - Key offerings
            • 12.7 DuPont de Nemours Inc.
              • DuPont de Nemours Inc. - Overview
              • DuPont de Nemours Inc. - Business segments
              • DuPont de Nemours Inc. - Key news
              • DuPont de Nemours Inc. - Key offerings
              • DuPont de Nemours Inc. - Segment focus
            • 12.8 Hellweg International Pty Ltd.
              • Hellweg International Pty Ltd. - Overview
              • Hellweg International Pty Ltd. - Product / Service
              • Hellweg International Pty Ltd. - Key offerings
            • 12.9 Honeywell International Inc.
              • Honeywell International Inc. - Overview
              • Honeywell International Inc. - Business segments
              • Honeywell International Inc. - Key news
              • Honeywell International Inc. - Key offerings
              • Honeywell International Inc. - Segment focus
            • 12.10 TenCate Fabrics
              • TenCate Fabrics - Overview
              • TenCate Fabrics - Product / Service
              • TenCate Fabrics - Key offerings
            • 12.11 Point Blank Enterprises Inc.
              • Point Blank Enterprises Inc. - Overview
              • Point Blank Enterprises Inc. - Product / Service
              • Point Blank Enterprises Inc. - Key offerings
            • 12.12 Saab AB
              • Saab AB - Overview
              • Saab AB - Business segments
              • Saab AB - Key news
              • Saab AB - Key offerings
              • Saab AB - Segment focus

            13 Appendix

            • 13.1 Scope of the report
              • 13.2 Inclusions and exclusions checklist
                • Inclusions checklist
                • Exclusions checklist
              • 13.3 Currency conversion rates for US$
                • Currency conversion rates for US$
              • 13.4 Research methodology
                • Research methodology
              • 13.5 Data procurement
                • Information sources
              • 13.6 Data validation
                • Data validation
              • 13.7 Validation techniques employed for market sizing
                • Validation techniques employed for market sizing
              • 13.8 Data synthesis
                • Data synthesis
              • 13.9 360 degree market analysis
                • 360 degree market analysis
              • 13.10 List of abbreviations
                • List of abbreviations

              Research Methodology

              Technavio presents a detailed picture of the market by way of study, synthesis, and summation of data from multiple sources. The analysts have presented the various facets of the market with a particular focus on identifying the key industry influencers. The data thus presented is comprehensive, reliable, and the result of extensive research, both primary and secondary.

              INFORMATION SOURCES

              Primary sources

              • Manufacturers and suppliers
              • Channel partners
              • Industry experts
              • Strategic decision makers

              Secondary sources

              • Industry journals and periodicals
              • Government data
              • Financial reports of key industry players
              • Historical data
              • Press releases

              DATA ANALYSIS

              Data Synthesis

              • Collation of data
              • Estimation of key figures
              • Analysis of derived insights

              Data Validation

              • Triangulation with data models
              • Reference against proprietary databases
              • Corroboration with industry experts

              REPORT WRITING

              Qualitative

              • Market drivers
              • Market challenges
              • Market trends
              • Five forces analysis

              Quantitative

              • Market size and forecast
              • Market segmentation
              • Geographical insights
              • Competitive landscape

              Interested in this report?

              Get your sample now to see our research methodology and insights!

              Download Now

              Frequently Asked Questions

              Ballistic Protection market growth will increase by $ 3161.8 mn during 2024-2028.

              The Ballistic Protection market is expected to grow at a CAGR of 4.33% during 2024-2028.

              Ballistic Protection market is segmented by Type( Hard armor, Soft armor, Commercial) Application( Defense, Homeland security, Commercial, MEA, South America)

              3M Co., Avon Polymer Products Ltd., BAE Systems Plc, Barrday Inc., Cooneen Group, CQC House, Craig International Ballistics Pty. Ltd., DuPont de Nemours Inc., FMS Enterprises Migun Ltd, Hellweg International Pty Ltd., Honeywell International Inc., TenCate Fabrics, MKU Ltd., Point Blank Enterprises Inc., Revision Inc., Rheinmetall AG, Saab AB, Safariland LLC, Seyntex NV, Teijin Ltd. are a few of the key vendors in the Ballistic Protection market.

              North America will register the highest growth rate of 33% among the other regions. Therefore, the Ballistic Protection market in North America is expected to garner significant business opportunities for the vendors during the forecast period.

              US, China, Russia, India, UK

              • Rising focus on light-weighting of ballistic protection equipment is the driving factor this market.

              The Ballistic Protection market vendors should focus on grabbing business opportunities from the Hard armor segment as it accounted for the largest market share in the base year.