Specialty Chemicals Market Analysis, Size, and Forecast 2026-2030: APAC (China, India, and Japan), North America (US, Canada, and Mexico), Europe (Germany, France, and UK), South America (Brazil and Argentina), Middle East and Africa (Saudi Arabia, UAE, and South Africa), and Rest of World (ROW)

Specialty Chemicals Market Analysis, Size, and Forecast 2026-2030:
APAC (China, India, and Japan), North America (US, Canada, and Mexico), Europe (Germany, France, and UK), South America (Brazil and Argentina), Middle East and Africa (Saudi Arabia, UAE, and South Africa), and Rest of World (ROW)

Published: Mar 2026 324 Pages SKU: IRTNTR44310

Market Overview at a Glance

$381.92 B
Market Opportunity
6.3%
CAGR 2025 - 2030
63%
APAC Growth
$209.56 B
Agrochemicals segment 2024

Specialty Chemicals Market Size 2026-2030

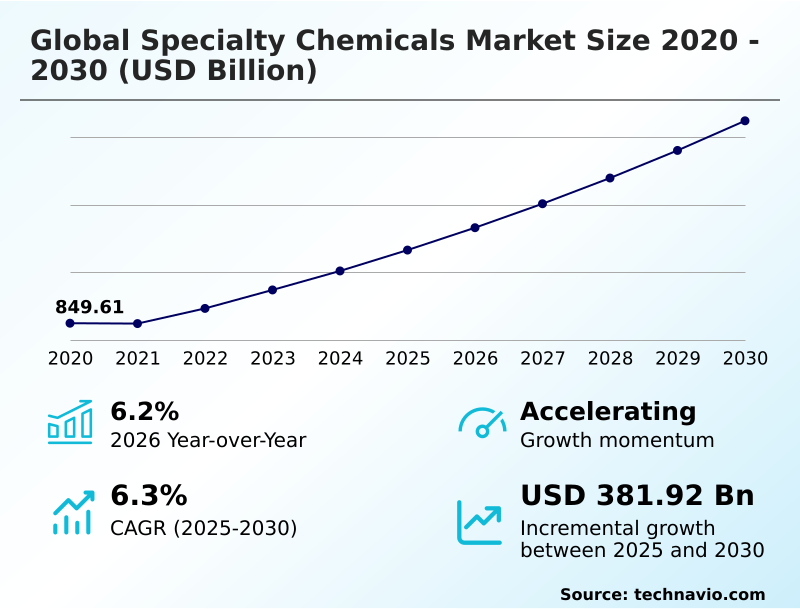
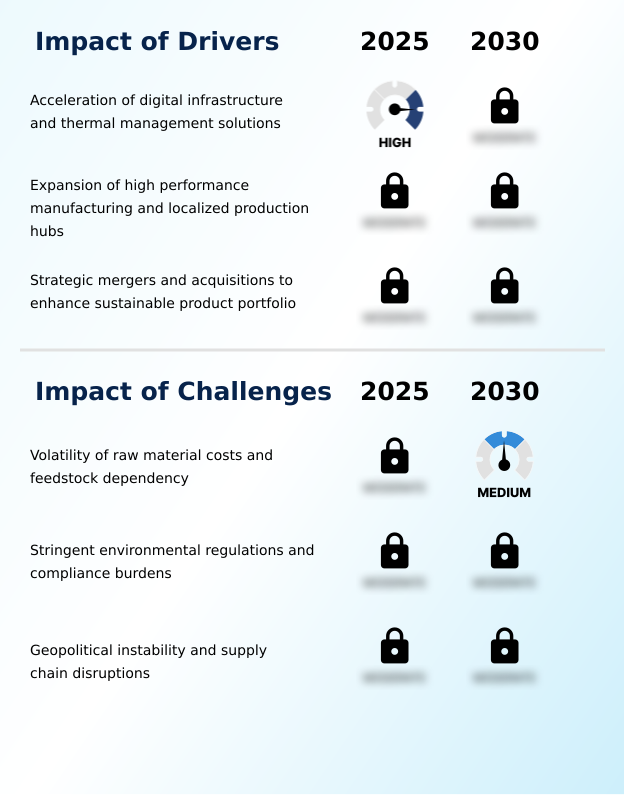
The specialty chemicals market size is valued to increase by USD 381.92 billion, at a CAGR of 6.3% from 2025 to 2030. Acceleration of digital infrastructure and thermal management solutions will drive the specialty chemicals market.

Major Market Trends & Insights

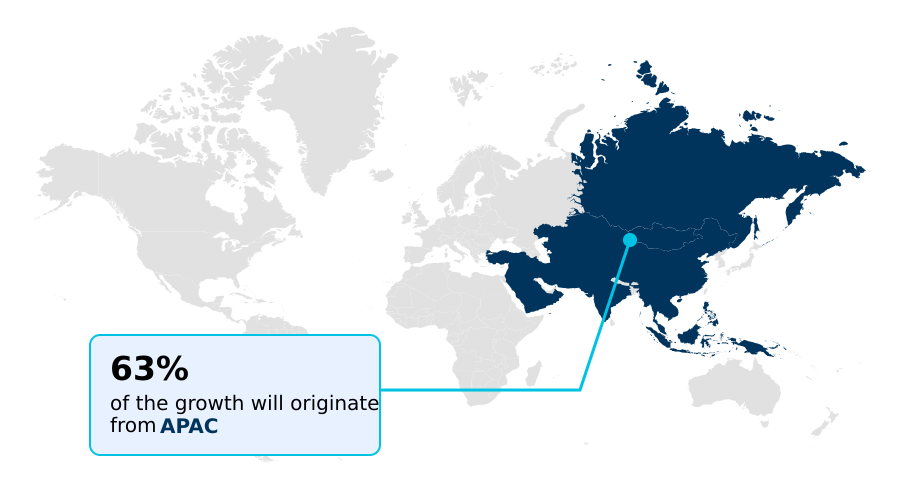
  • APAC dominated the market and accounted for a 63% growth during the forecast period.
  • By End-user - Agrochemicals segment was valued at USD 209.56 billion in 2024
  • By Type - Plasticizers segment accounted for the largest market revenue share in 2024

Market Size & Forecast

  • Market Opportunities: USD 598.02 billion
  • Market Future Opportunities: USD 381.92 billion
  • CAGR from 2025 to 2030 : 6.3%

Market Summary

  • The specialty chemicals market is defined by its role in enabling performance and innovation across a vast array of industries. These high-value chemical products are essential for applications ranging from pharmaceuticals and agriculture to electronics and construction.
  • A primary driver is the global push for sustainability, which is accelerating the adoption of bio-based surfactants and materials derived from bio-based feedstocks over traditional petrochemical feedstocks. This transition presents both opportunities and challenges.
  • For instance, a manufacturer of consumer goods might reformulate its cleaning products to meet new environmental regulations, which involves sourcing new biodegradable ingredients and re-engineering its supply chain. This scenario highlights the market's core dynamic: balancing innovation and regulatory compliance with the economic realities of volatile raw material prices and complex logistics.
  • Furthermore, the demand for advanced materials in high-tech sectors, such as electronic chemicals for semiconductors and lightweight advanced composites for electric vehicles, continues to fuel research and development. Success in this market hinges on a company's ability to deliver customized, high-performance solutions while navigating a complex global landscape of shifting consumer preferences and economic pressures.

What will be the Size of the Specialty Chemicals Market during the forecast period?

Get Key Insights on Market Forecast (PDF) Request Free Sample

How is the Specialty Chemicals Market Segmented?

The specialty chemicals industry research report provides comprehensive data (region-wise segment analysis), with forecasts and estimates in "USD million" for the period 2026-2030, as well as historical data from 2020-2024 for the following segments.
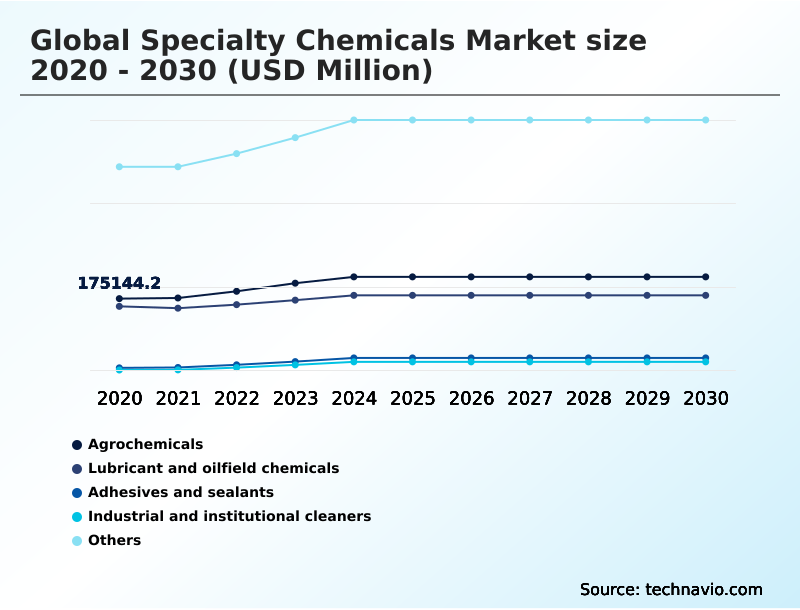
  • End-user
    • Agrochemicals
    • Lubricant and oilfield chemicals
    • Adhesives and sealants
    • Industrial and institutional cleaners
    • Others
  • Type
    • Plasticizers
    • Water-based
    • Coagulants and flocculants
    • Scale inhibitors
  • Technology
    • Traditional chemical synthesis platforms
    • Bio-based production technologies
    • Advanced manufacturing platforms
    • Circular chemistry technologies
  • Geography
    • APAC
      • China
      • India
      • Japan
    • North America
      • US
      • Canada
      • Mexico
    • Europe
      • Germany
      • France
      • UK
    • South America
      • Brazil
      • Argentina
    • Middle East and Africa
      • Saudi Arabia
      • UAE
      • South Africa
    • Rest of World (ROW)

By End-user Insights

The agrochemicals segment is estimated to witness significant growth during the forecast period.

The agrochemicals sector is undergoing a fundamental transformation, shifting toward sustainable crop protection solutions. This evolution is driven by the need to enhance agricultural productivity while adhering to stringent environmental standards.

Key developments include adhesives and sealants for seed coatings and the creation of advanced formulations using bio-based production technologies. Innovations in green chemistry principles, leveraging materials like polyolefins and polyethylene, are enabling products that improve plant resilience.

This focus on high-efficiency, low-toxicity products, including coagulants and flocculants for water management, water-soluble polymers, and corrosion inhibitors addresses the increasing global demand for sustainable food sources. Water-based adhesives are also finding new applications in agricultural packaging.

This shift reflects a broader industry trend toward high-value chemical products and specialty chemical manufacturing with lower environmental impact.

Request Free Sample

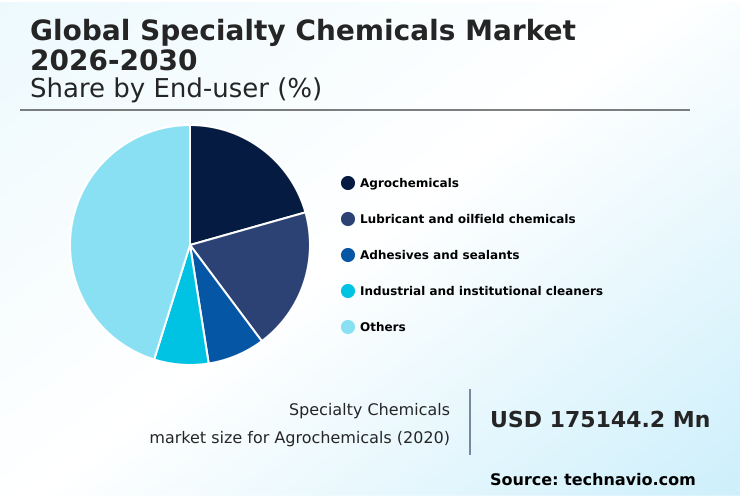
The Agrochemicals segment was valued at USD 209.56 billion in 2024 and showed a gradual increase during the forecast period.

Request Free Sample

Regional Analysis

APAC is estimated to contribute 63% to the growth of the global market during the forecast period.Technavio’s analysts have elaborately explained the regional trends and drivers that shape the market during the forecast period.

See How Specialty Chemicals Market Demand is Rising in APAC Request Free Sample

APAC dominates the landscape, accounting for over 60% of incremental growth. This is driven by rapid industrialization and demand for construction chemicals, performance additives, and agrochemicals.

European and North American markets focus on high-value innovation, particularly in low-emission specialty chemicals and hot melt adhesives, with R&D investments growing 15% faster than in commodity chemicals.

Localized production is a key strategy for manufacturing lubricant and oilfield chemicals and industrial and institutional cleaners closer to end-users.

Demand for epoxy resins, polyetheramines, and lithium compounds is also rising, supported by a focus on light-curable adhesives and water treatment chemicals to meet regional standards.

Market Dynamics

Our researchers analyzed the data with 2025 as the base year, along with the key drivers, trends, and challenges. A holistic analysis of drivers will help companies refine their marketing strategies to gain a competitive advantage.

  • The global specialty chemicals market is navigating a period of significant transformation, where long-term strategy is dictated by several interconnected factors. Innovations in specialty coatings technology are enabling more durable and environmentally friendly surfaces, a trend that is particularly relevant as industries seek to reduce their carbon footprint.
  • Simultaneously, the burgeoning electric vehicle sector is creating immense demand for specialty chemicals for electric vehicle batteries, including advanced electrolytes and thermal management fluids. Market consolidation continues through strategic mergers in specialty chemicals, allowing companies to acquire niche technologies and expand their geographic footprint.
  • However, the impact of raw material costs on specialty chemicals remains a persistent challenge, forcing producers to optimize supply chains and explore alternative feedstocks. Navigating the complex web of regulatory compliance for specialty chemicals is a critical operational priority, with proactive firms achieving up to 20% faster product-to-market times than their less prepared counterparts.
  • The focus on high performance manufacturing in chemicals through digitalization and automation is key to mitigating these pressures. Furthermore, establishing localized production hubs for specialty chemicals is becoming a crucial strategy to enhance supply chain resilience against geopolitical impact on chemical supply chains.
  • This includes better managing feedstock dependency in chemical production and undergoing strategic portfolio optimization in specialty chemicals to focus on high-margin products. The growth of non-halogenated flame retardants and the adoption of water-based systems for voc reduction highlight the industry's response to sustainability demands, even as firms grapple with the challenges in chemical regulatory compliance.
  • The essential role of coagulants in industrial water treatment and the evolving application of plasticizers in flexible pvc further illustrate the market's diversity. Ultimately, success is tied to meeting the specific specialty chemical demand in digital infrastructure and developing sustainable flame retardant solutions for electronics and advanced material solutions for semiconductors, alongside exploring bio-based alternatives in personal care chemicals.

What are the key market drivers leading to the rise in the adoption of Specialty Chemicals Industry?

  • The acceleration of digital infrastructure and the corresponding need for advanced thermal management solutions is a key driver for market growth.

  • High-tech sector demand is a primary driver, especially for materials enabling digital and energy transitions. Data center expansion has propelled the need for immersion cooling fluids and thermal interface materials, improving thermal efficiency by over 25%.
  • The shift to electric vehicles fuels demand for specialty polymers, advanced composites, specialty acrylics, and polyurethane systems for lightweighting. Concurrently, the semiconductor industry's growth requires high-purity process chemicals and electronic chemicals, where fumed silica and silanes are critical.
  • This is supported by advanced manufacturing platforms that deliver higher precision compared to traditional chemical synthesis platforms.

What are the market trends shaping the Specialty Chemicals Industry?

  • The market is witnessing a significant trend toward the expansion of non-halogenated flame-retardant solutions, a development driven by increasing demand from high-tech sectors.

  • The market is increasingly shaped by circular economy principles, evident in the development of non-halogenated flame-retardant solutions and phosphorus-based flame retardants. This shift away from bromine specialties is critical for electronics. Companies leveraging bio-circular products, such as biodegradable biopolymers for packaging, report significant sustainability gains.
  • The move to bio-based surfactants and bioplastic replacements in consumer goods has gained traction, with some product lines achieving a 30% lower carbon footprint. The use of high-performance additives in sustainable paper packaging coatings demonstrates a focus on recyclability, aligning with asset-light business models and the broader push to reduce reliance on petrochemical feedstocks.

What challenges does the Specialty Chemicals Industry face during its growth?

  • The volatility of raw material costs and dependency on petrochemical feedstocks present a key challenge to the industry's growth trajectory.

  • Navigating raw material price volatility and regulations poses a significant challenge. Dependency on feedstocks for ethylene oxide and propylene oxide makes producers vulnerable, impacting margins by up to 10% quarterly. Evolving regulations on plasticizers, scale inhibitors, and hydro-processing catalysts require investment in reformulation and know-how-based models. This creates a difficult environment for managing chemical intermediates and fine chemicals.
  • Supply chain disruptions can delay critical inputs like organic peroxides and chelates, affecting production. The shift to water-based systems and solvent-free alternatives is a response, but the transition itself introduces logistical hurdles and requires new integrated value chains.

Exclusive Technavio Analysis on Customer Landscape

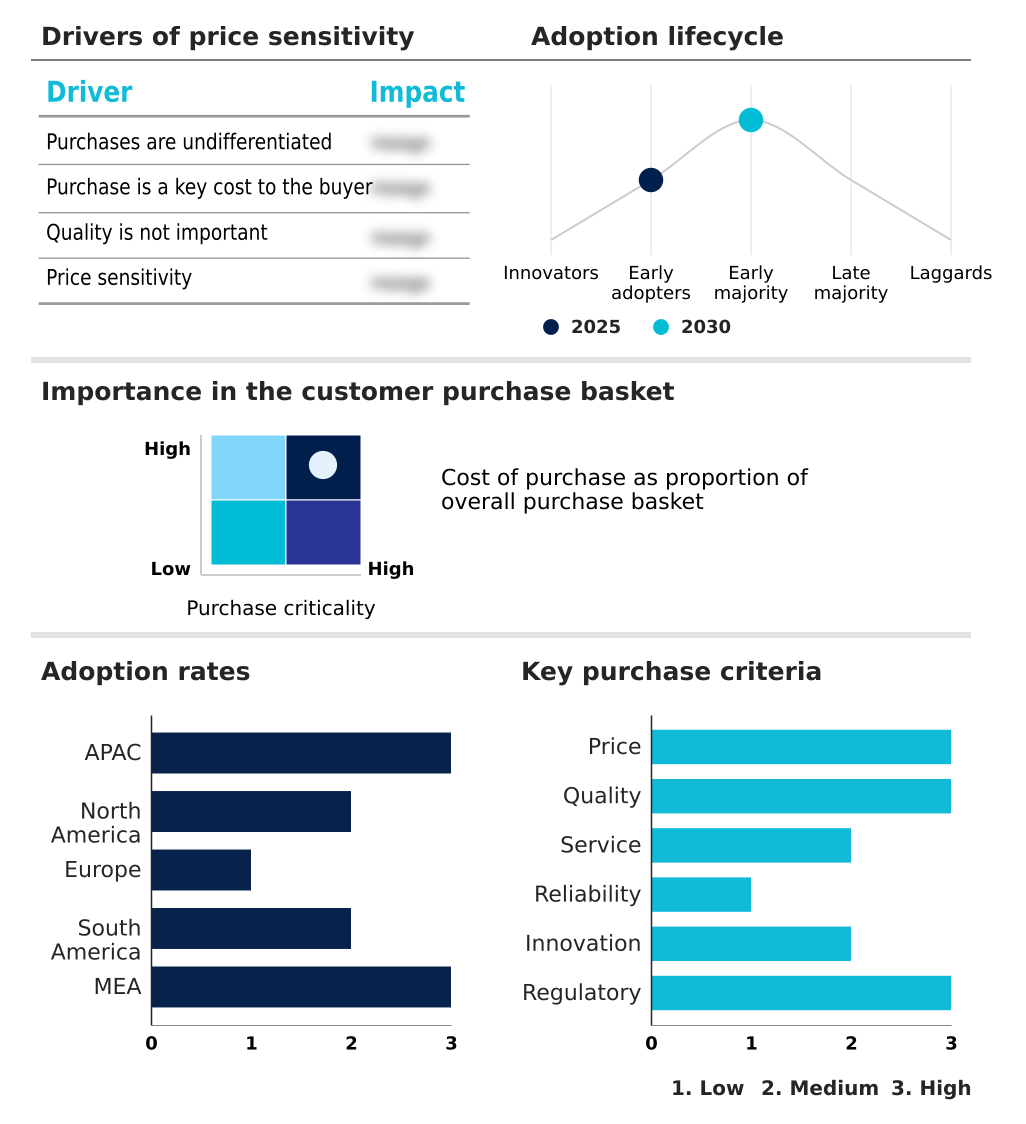
The specialty chemicals market forecasting report includes the adoption lifecycle of the market, covering from the innovator’s stage to the laggard’s stage. It focuses on adoption rates in different regions based on penetration. Furthermore, the specialty chemicals market report also includes key purchase criteria and drivers of price sensitivity to help companies evaluate and develop their market growth analysis strategies.

Customer Landscape of Specialty Chemicals Industry

Competitive Landscape

Companies are implementing various strategies, such as strategic alliances, specialty chemicals market forecast, partnerships, mergers and acquisitions, geographical expansion, and product/service launches, to enhance their presence in the industry.

Albemarle Corp. - Analyzes market-leading offerings of lithium compounds and bromine specialties, critical for energy storage, fire safety, and electronics applications.

The industry research and growth report includes detailed analyses of the competitive landscape of the market and information about key companies, including:

  • Albemarle Corp.
  • Ashland Inc.
  • BASF SE
  • Beardow and Adams Adhesives Ltd.
  • Clariant International Ltd.
  • Danimer Scientific Inc.
  • Dow Chemical Co.
  • Dymax Corp.
  • Evonik Industries AG
  • Exxon Mobil Corp.
  • H.B. Fuller Co.
  • Henkel AG and Co. KGaA
  • Huntsman International LLC
  • Lanxess AG
  • Nouryon Chemicals Holding B.V.
  • PPG Industries Inc.
  • Saudi Arabian Oil Co.
  • Shree Ganesh Remedies Ltd.
  • Solvay SA
  • Vibrantz Technologies

Qualitative and quantitative analysis of companies has been conducted to help clients understand the wider business environment as well as the strengths and weaknesses of key industry players. Data is qualitatively analyzed to categorize companies as pure play, category-focused, industry-focused, and diversified; it is quantitatively analyzed to categorize companies as dominant, leading, strong, tentative, and weak.

Recent Development and News in Specialty chemicals market

  • In August, 2024, BASF SE announced a strategic adjustment to its plasticizer production at the Ludwigshafen site, focusing on high-value, non-phthalate plasticizers to enhance competitiveness in sensitive application markets.
  • In November, 2024, Solenis completed its previously announced acquisition of NCH Corporation, a move that significantly expands its global footprint and enhances its portfolio of scale control and industrial hygiene solutions.
  • In January, 2025, Evonik Industries AG announced the strategic merger of its silica and silane business lines into a new entity named Smart Effects to enhance its technical capabilities for the tire and semiconductor industries.
  • In March, 2025, Dow Inc. and Corning Incorporated entered into a strategic collaboration to develop advanced materials for the high-growth electronics market, combining chemical expertise with materials science to create new solutions for the semiconductor industry.

Dive into Technavio’s robust research methodology, blending expert interviews, extensive data synthesis, and validated models for unparalleled Specialty Chemicals Market insights. See full methodology.

Market Scope
Page number 324
Base year 2025
Historic period 2020-2024
Forecast period 2026-2030
Growth momentum & CAGR Accelerate at a CAGR of 6.3%
Market growth 2026-2030 USD 381922.2 million
Market structure Fragmented
YoY growth 2025-2026(%) 6.2%
Key countries China, India, Japan, South Korea, Australia, Singapore, US, Canada, Mexico, Germany, France, UK, Italy, The Netherlands, Spain, Brazil, Argentina, Chile, Saudi Arabia, UAE, South Africa, Qatar and Egypt
Competitive landscape Leading Companies, Market Positioning of Companies, Competitive Strategies, and Industry Risks

Request Free Sample

Research Analyst Overview

  • The specialty chemicals market is defined by a relentless drive for innovation and functional superiority. Its trajectory is shaped by the development of high-performance products such as phosphorus-based flame retardants, specialty coatings, and advanced composites. Key sectors rely on electronic chemicals for miniaturization and adhesives and sealants for lightweighting in automotive and aerospace.
  • Boardroom decisions are increasingly influenced by the need to invest in sustainable solutions, such as formulating bio-based surfactants or adopting halogen-free flame retardants to align with ESG mandates and regulatory pressures. Companies leveraging water-soluble polymers in water treatment have reported a 15% improvement in process efficiency.
  • The market's complexity requires a focus on differentiated materials like specialty acrylics, epoxy resins, and polyurethane systems, while managing supply chains for fine chemicals, scale inhibitors, and plasticizers. Success hinges on developing specialized inputs like hot melt adhesives, fumed silica, and lithium compounds to meet niche application demands.

What are the Key Data Covered in this Specialty Chemicals Market Research and Growth Report?

  • What is the expected growth of the Specialty Chemicals Market between 2026 and 2030?

    • USD 381.92 billion, at a CAGR of 6.3%

  • What segmentation does the market report cover?

    • The report is segmented by End-user (Agrochemicals, Lubricant and oilfield chemicals, Adhesives and sealants, Industrial and institutional cleaners, and Others), Type (Plasticizers, Water-based, Coagulants and flocculants, and Scale inhibitors), Technology (Traditional chemical synthesis platforms, Bio-based production technologies, Advanced manufacturing platforms, and Circular chemistry technologies) and Geography (APAC, North America, Europe, South America, Middle East and Africa)

  • Which regions are analyzed in the report?

    • APAC, North America, Europe, South America and Middle East and Africa

  • What are the key growth drivers and market challenges?

    • Acceleration of digital infrastructure and thermal management solutions, Volatility of raw material costs and feedstock dependency

  • Who are the major players in the Specialty Chemicals Market?

    • Albemarle Corp., Ashland Inc., BASF SE, Beardow and Adams Adhesives Ltd., Clariant International Ltd., Danimer Scientific Inc., Dow Chemical Co., Dymax Corp., Evonik Industries AG, Exxon Mobil Corp., H.B. Fuller Co., Henkel AG and Co. KGaA, Huntsman International LLC, Lanxess AG, Nouryon Chemicals Holding B.V., PPG Industries Inc., Saudi Arabian Oil Co., Shree Ganesh Remedies Ltd., Solvay SA and Vibrantz Technologies

Market Research Insights

  • The specialty chemicals market is characterized by a dynamic interplay between innovation and market demands, with a strong emphasis on sustainability and performance. The transition to water-based polyurethane systems and other solvent-free alternatives is accelerating, with adoption rates in the coatings industry increasing by over 20% in some segments to meet stricter VOC emission standards.
  • The development of high-value chemical products, supported by advanced manufacturing platforms, has enabled some firms to improve production efficiency by 15% compared to traditional chemical synthesis platforms. Furthermore, the focus on circular chemistry technologies is reshaping supply chains, with pilot programs demonstrating a potential 30% reduction in waste for specific polymer streams.

We can help! Our analysts can customize this specialty chemicals market research report to meet your requirements.

Get in touch

1. Executive Summary

1.1 Market overview

Executive Summary - Chart on Market Overview
Executive Summary - Data Table on Market Overview
Executive Summary - Chart on Global Market Characteristics
Executive Summary - Chart on Market by Geography
Executive Summary - Chart on Market Segmentation by End-user
Executive Summary - Chart on Market Segmentation by Type
Executive Summary - Chart on Market Segmentation by Technology
Executive Summary - Chart on Incremental Growth
Executive Summary - Data Table on Incremental Growth
Executive Summary - Chart on Company Market Positioning

2. Technavio Analysis

2.1 Analysis of price sensitivity, lifecycle, customer purchase basket, adoption rates, and purchase criteria

2.2 Criticality of inputs and Factors of differentiation

Chart on Overview on criticality of inputs and factors of differentiation

2.3 Factors of disruption

Chart on Overview on factors of disruption

2.4 Impact of drivers and challenges

Chart on Impact of drivers and challenges in 2025 and 2030

3. Market Landscape

3.1 Market ecosystem

Chart on Parent Market
Data Table on - Parent Market

3.2 Market characteristics

Chart on Market characteristics analysis

3.3 Value chain analysis

Chart on Value chain analysis

4. Market Sizing

4.1 Market definition

Data Table on Offerings of companies included in the market definition

4.2 Market segment analysis

Market segments

4.3 Market size 2025

4.4 Market outlook: Forecast for 2025-2030

Chart on Global - Market size and forecast 2025-2030 ($ million)
Data Table on Global - Market size and forecast 2025-2030 ($ million)
Chart on Global Market: Year-over-year growth 2025-2030 (%)
Data Table on Global Market: Year-over-year growth 2025-2030 (%)

5. Historic Market Size

5.1 Global Specialty Chemicals Market 2020 - 2024

Historic Market Size - Data Table on Global Specialty Chemicals Market 2020 - 2024 ($ million)

5.2 End-user segment analysis 2020 - 2024

Historic Market Size - End-user Segment 2020 - 2024 ($ million)

5.3 Type segment analysis 2020 - 2024

Historic Market Size - Type Segment 2020 - 2024 ($ million)

5.4 Technology segment analysis 2020 - 2024

Historic Market Size - Technology Segment 2020 - 2024 ($ million)

5.5 Geography segment analysis 2020 - 2024

Historic Market Size - Geography Segment 2020 - 2024 ($ million)

5.6 Country segment analysis 2020 - 2024

Historic Market Size - Country Segment 2020 - 2024 ($ million)

6. Qualitative Analysis

6.1 Impact of AI on Global Specialty Chemicals Market

6.2 Impact of Geopolitical Conflicts on Global Specialty Chemicals Market

7. Five Forces Analysis

7.1 Five forces summary

Five forces analysis - Comparison between 2025 and 2030

7.2 Bargaining power of buyers

Bargaining power of buyers - Impact of key factors 2025 and 2030

7.3 Bargaining power of suppliers

Bargaining power of suppliers - Impact of key factors in 2025 and 2030

7.4 Threat of new entrants

Threat of new entrants - Impact of key factors in 2025 and 2030

7.5 Threat of substitutes

Threat of substitutes - Impact of key factors in 2025 and 2030

7.6 Threat of rivalry

Threat of rivalry - Impact of key factors in 2025 and 2030

7.7 Market condition

Chart on Market condition - Five forces 2025 and 2030

8. Market Segmentation by End-user

8.1 Market segments

Chart on End-user - Market share 2025-2030 (%)
Data Table on End-user - Market share 2025-2030 (%)

8.2 Comparison by End-user

Chart on Comparison by End-user
Data Table on Comparison by End-user

8.3 Agrochemicals - Market size and forecast 2025-2030

Chart on Agrochemicals - Market size and forecast 2025-2030 ($ million)
Data Table on Agrochemicals - Market size and forecast 2025-2030 ($ million)
Chart on Agrochemicals - Year-over-year growth 2025-2030 (%)
Data Table on Agrochemicals - Year-over-year growth 2025-2030 (%)

8.4 Lubricant and oilfield chemicals - Market size and forecast 2025-2030

Chart on Lubricant and oilfield chemicals - Market size and forecast 2025-2030 ($ million)
Data Table on Lubricant and oilfield chemicals - Market size and forecast 2025-2030 ($ million)
Chart on Lubricant and oilfield chemicals - Year-over-year growth 2025-2030 (%)
Data Table on Lubricant and oilfield chemicals - Year-over-year growth 2025-2030 (%)

8.5 Adhesives and sealants - Market size and forecast 2025-2030

Chart on Adhesives and sealants - Market size and forecast 2025-2030 ($ million)
Data Table on Adhesives and sealants - Market size and forecast 2025-2030 ($ million)
Chart on Adhesives and sealants - Year-over-year growth 2025-2030 (%)
Data Table on Adhesives and sealants - Year-over-year growth 2025-2030 (%)

8.6 Industrial and institutional cleaners - Market size and forecast 2025-2030

Chart on Industrial and institutional cleaners - Market size and forecast 2025-2030 ($ million)
Data Table on Industrial and institutional cleaners - Market size and forecast 2025-2030 ($ million)
Chart on Industrial and institutional cleaners - Year-over-year growth 2025-2030 (%)
Data Table on Industrial and institutional cleaners - Year-over-year growth 2025-2030 (%)

8.7 Others - Market size and forecast 2025-2030

Chart on Others - Market size and forecast 2025-2030 ($ million)
Data Table on Others - Market size and forecast 2025-2030 ($ million)
Chart on Others - Year-over-year growth 2025-2030 (%)
Data Table on Others - Year-over-year growth 2025-2030 (%)

8.8 Market opportunity by End-user

Market opportunity by End-user ($ million)
Data Table on Market opportunity by End-user ($ million)

9. Market Segmentation by Type

9.1 Market segments

Chart on Type - Market share 2025-2030 (%)
Data Table on Type - Market share 2025-2030 (%)

9.2 Comparison by Type

Chart on Comparison by Type
Data Table on Comparison by Type

9.3 Plasticizers - Market size and forecast 2025-2030

Chart on Plasticizers - Market size and forecast 2025-2030 ($ million)
Data Table on Plasticizers - Market size and forecast 2025-2030 ($ million)
Chart on Plasticizers - Year-over-year growth 2025-2030 (%)
Data Table on Plasticizers - Year-over-year growth 2025-2030 (%)

9.4 Water-based - Market size and forecast 2025-2030

Chart on Water-based - Market size and forecast 2025-2030 ($ million)
Data Table on Water-based - Market size and forecast 2025-2030 ($ million)
Chart on Water-based - Year-over-year growth 2025-2030 (%)
Data Table on Water-based - Year-over-year growth 2025-2030 (%)

9.5 Coagulants and flocculants - Market size and forecast 2025-2030

Chart on Coagulants and flocculants - Market size and forecast 2025-2030 ($ million)
Data Table on Coagulants and flocculants - Market size and forecast 2025-2030 ($ million)
Chart on Coagulants and flocculants - Year-over-year growth 2025-2030 (%)
Data Table on Coagulants and flocculants - Year-over-year growth 2025-2030 (%)

9.6 Scale inhibitors - Market size and forecast 2025-2030

Chart on Scale inhibitors - Market size and forecast 2025-2030 ($ million)
Data Table on Scale inhibitors - Market size and forecast 2025-2030 ($ million)
Chart on Scale inhibitors - Year-over-year growth 2025-2030 (%)
Data Table on Scale inhibitors - Year-over-year growth 2025-2030 (%)

9.7 Market opportunity by Type

Market opportunity by Type ($ million)
Data Table on Market opportunity by Type ($ million)

10. Market Segmentation by Technology

10.1 Market segments

Chart on Technology - Market share 2025-2030 (%)
Data Table on Technology - Market share 2025-2030 (%)

10.2 Comparison by Technology

Chart on Comparison by Technology
Data Table on Comparison by Technology

10.3 Traditional chemical synthesis platforms - Market size and forecast 2025-2030

Chart on Traditional chemical synthesis platforms - Market size and forecast 2025-2030 ($ million)
Data Table on Traditional chemical synthesis platforms - Market size and forecast 2025-2030 ($ million)
Chart on Traditional chemical synthesis platforms - Year-over-year growth 2025-2030 (%)
Data Table on Traditional chemical synthesis platforms - Year-over-year growth 2025-2030 (%)

10.4 Bio-based production technologies - Market size and forecast 2025-2030

Chart on Bio-based production technologies - Market size and forecast 2025-2030 ($ million)
Data Table on Bio-based production technologies - Market size and forecast 2025-2030 ($ million)
Chart on Bio-based production technologies - Year-over-year growth 2025-2030 (%)
Data Table on Bio-based production technologies - Year-over-year growth 2025-2030 (%)

10.5 Advanced manufacturing platforms - Market size and forecast 2025-2030

Chart on Advanced manufacturing platforms - Market size and forecast 2025-2030 ($ million)
Data Table on Advanced manufacturing platforms - Market size and forecast 2025-2030 ($ million)
Chart on Advanced manufacturing platforms - Year-over-year growth 2025-2030 (%)
Data Table on Advanced manufacturing platforms - Year-over-year growth 2025-2030 (%)

10.6 Circular chemistry technologies - Market size and forecast 2025-2030

Chart on Circular chemistry technologies - Market size and forecast 2025-2030 ($ million)
Data Table on Circular chemistry technologies - Market size and forecast 2025-2030 ($ million)
Chart on Circular chemistry technologies - Year-over-year growth 2025-2030 (%)
Data Table on Circular chemistry technologies - Year-over-year growth 2025-2030 (%)

10.7 Market opportunity by Technology

Market opportunity by Technology ($ million)
Data Table on Market opportunity by Technology ($ million)

11. Customer Landscape

11.1 Customer landscape overview

Analysis of price sensitivity, lifecycle, customer purchase basket, adoption rates, and purchase criteria

12. Geographic Landscape

12.1 Geographic segmentation

Chart on Market share by geography 2025-2030 (%)
Data Table on Market share by geography 2025-2030 (%)

12.2 Geographic comparison

Chart on Geographic comparison
Data Table on Geographic comparison

12.3 APAC - Market size and forecast 2025-2030

Chart on APAC - Market size and forecast 2025-2030 ($ million)
Data Table on APAC - Market size and forecast 2025-2030 ($ million)
Chart on APAC - Year-over-year growth 2025-2030 (%)
Data Table on APAC - Year-over-year growth 2025-2030 (%)
Chart on Regional Comparison - APAC
Data Table on Regional Comparison - APAC

12.3.1 China - Market size and forecast 2025-2030

Chart on China - Market size and forecast 2025-2030 ($ million)
Data Table on China - Market size and forecast 2025-2030 ($ million)
Chart on China - Year-over-year growth 2025-2030 (%)
Data Table on China - Year-over-year growth 2025-2030 (%)

12.3.2 India - Market size and forecast 2025-2030

Chart on India - Market size and forecast 2025-2030 ($ million)
Data Table on India - Market size and forecast 2025-2030 ($ million)
Chart on India - Year-over-year growth 2025-2030 (%)
Data Table on India - Year-over-year growth 2025-2030 (%)

12.3.3 Japan - Market size and forecast 2025-2030

Chart on Japan - Market size and forecast 2025-2030 ($ million)
Data Table on Japan - Market size and forecast 2025-2030 ($ million)
Chart on Japan - Year-over-year growth 2025-2030 (%)
Data Table on Japan - Year-over-year growth 2025-2030 (%)

12.3.4 South Korea - Market size and forecast 2025-2030

Chart on South Korea - Market size and forecast 2025-2030 ($ million)
Data Table on South Korea - Market size and forecast 2025-2030 ($ million)
Chart on South Korea - Year-over-year growth 2025-2030 (%)
Data Table on South Korea - Year-over-year growth 2025-2030 (%)

12.3.5 Australia - Market size and forecast 2025-2030

Chart on Australia - Market size and forecast 2025-2030 ($ million)
Data Table on Australia - Market size and forecast 2025-2030 ($ million)
Chart on Australia - Year-over-year growth 2025-2030 (%)
Data Table on Australia - Year-over-year growth 2025-2030 (%)

12.3.6 Singapore - Market size and forecast 2025-2030

Chart on Singapore - Market size and forecast 2025-2030 ($ million)
Data Table on Singapore - Market size and forecast 2025-2030 ($ million)
Chart on Singapore - Year-over-year growth 2025-2030 (%)
Data Table on Singapore - Year-over-year growth 2025-2030 (%)

12.4 North America - Market size and forecast 2025-2030

Chart on North America - Market size and forecast 2025-2030 ($ million)
Data Table on North America - Market size and forecast 2025-2030 ($ million)
Chart on North America - Year-over-year growth 2025-2030 (%)
Data Table on North America - Year-over-year growth 2025-2030 (%)
Chart on Regional Comparison - North America
Data Table on Regional Comparison - North America

12.4.1 US - Market size and forecast 2025-2030

Chart on US - Market size and forecast 2025-2030 ($ million)
Data Table on US - Market size and forecast 2025-2030 ($ million)
Chart on US - Year-over-year growth 2025-2030 (%)
Data Table on US - Year-over-year growth 2025-2030 (%)

12.4.2 Canada - Market size and forecast 2025-2030

Chart on Canada - Market size and forecast 2025-2030 ($ million)
Data Table on Canada - Market size and forecast 2025-2030 ($ million)
Chart on Canada - Year-over-year growth 2025-2030 (%)
Data Table on Canada - Year-over-year growth 2025-2030 (%)

12.4.3 Mexico - Market size and forecast 2025-2030

Chart on Mexico - Market size and forecast 2025-2030 ($ million)
Data Table on Mexico - Market size and forecast 2025-2030 ($ million)
Chart on Mexico - Year-over-year growth 2025-2030 (%)
Data Table on Mexico - Year-over-year growth 2025-2030 (%)

12.5 Europe - Market size and forecast 2025-2030

Chart on Europe - Market size and forecast 2025-2030 ($ million)
Data Table on Europe - Market size and forecast 2025-2030 ($ million)
Chart on Europe - Year-over-year growth 2025-2030 (%)
Data Table on Europe - Year-over-year growth 2025-2030 (%)
Chart on Regional Comparison - Europe
Data Table on Regional Comparison - Europe

12.5.1 Germany - Market size and forecast 2025-2030

Chart on Germany - Market size and forecast 2025-2030 ($ million)
Data Table on Germany - Market size and forecast 2025-2030 ($ million)
Chart on Germany - Year-over-year growth 2025-2030 (%)
Data Table on Germany - Year-over-year growth 2025-2030 (%)

12.5.2 France - Market size and forecast 2025-2030

Chart on France - Market size and forecast 2025-2030 ($ million)
Data Table on France - Market size and forecast 2025-2030 ($ million)
Chart on France - Year-over-year growth 2025-2030 (%)
Data Table on France - Year-over-year growth 2025-2030 (%)

12.5.3 UK - Market size and forecast 2025-2030

Chart on UK - Market size and forecast 2025-2030 ($ million)
Data Table on UK - Market size and forecast 2025-2030 ($ million)
Chart on UK - Year-over-year growth 2025-2030 (%)
Data Table on UK - Year-over-year growth 2025-2030 (%)

12.5.4 Italy - Market size and forecast 2025-2030

Chart on Italy - Market size and forecast 2025-2030 ($ million)
Data Table on Italy - Market size and forecast 2025-2030 ($ million)
Chart on Italy - Year-over-year growth 2025-2030 (%)
Data Table on Italy - Year-over-year growth 2025-2030 (%)

12.5.5 The Netherlands - Market size and forecast 2025-2030

Chart on The Netherlands - Market size and forecast 2025-2030 ($ million)
Data Table on The Netherlands - Market size and forecast 2025-2030 ($ million)
Chart on The Netherlands - Year-over-year growth 2025-2030 (%)
Data Table on The Netherlands - Year-over-year growth 2025-2030 (%)

12.5.6 Spain - Market size and forecast 2025-2030

Chart on Spain - Market size and forecast 2025-2030 ($ million)
Data Table on Spain - Market size and forecast 2025-2030 ($ million)
Chart on Spain - Year-over-year growth 2025-2030 (%)
Data Table on Spain - Year-over-year growth 2025-2030 (%)

12.6 South America - Market size and forecast 2025-2030

Chart on South America - Market size and forecast 2025-2030 ($ million)
Data Table on South America - Market size and forecast 2025-2030 ($ million)
Chart on South America - Year-over-year growth 2025-2030 (%)
Data Table on South America - Year-over-year growth 2025-2030 (%)
Chart on Regional Comparison - South America
Data Table on Regional Comparison - South America

12.6.1 Brazil - Market size and forecast 2025-2030

Chart on Brazil - Market size and forecast 2025-2030 ($ million)
Data Table on Brazil - Market size and forecast 2025-2030 ($ million)
Chart on Brazil - Year-over-year growth 2025-2030 (%)
Data Table on Brazil - Year-over-year growth 2025-2030 (%)

12.6.2 Argentina - Market size and forecast 2025-2030

Chart on Argentina - Market size and forecast 2025-2030 ($ million)
Data Table on Argentina - Market size and forecast 2025-2030 ($ million)
Chart on Argentina - Year-over-year growth 2025-2030 (%)
Data Table on Argentina - Year-over-year growth 2025-2030 (%)

12.6.3 Chile - Market size and forecast 2025-2030

Chart on Chile - Market size and forecast 2025-2030 ($ million)
Data Table on Chile - Market size and forecast 2025-2030 ($ million)
Chart on Chile - Year-over-year growth 2025-2030 (%)
Data Table on Chile - Year-over-year growth 2025-2030 (%)

12.7 Middle East and Africa - Market size and forecast 2025-2030

Chart on Middle East and Africa - Market size and forecast 2025-2030 ($ million)
Data Table on Middle East and Africa - Market size and forecast 2025-2030 ($ million)
Chart on Middle East and Africa - Year-over-year growth 2025-2030 (%)
Data Table on Middle East and Africa - Year-over-year growth 2025-2030 (%)
Chart on Regional Comparison - Middle East and Africa
Data Table on Regional Comparison - Middle East and Africa

12.7.1 Saudi Arabia - Market size and forecast 2025-2030

Chart on Saudi Arabia - Market size and forecast 2025-2030 ($ million)
Data Table on Saudi Arabia - Market size and forecast 2025-2030 ($ million)
Chart on Saudi Arabia - Year-over-year growth 2025-2030 (%)
Data Table on Saudi Arabia - Year-over-year growth 2025-2030 (%)

12.7.2 UAE - Market size and forecast 2025-2030

Chart on UAE - Market size and forecast 2025-2030 ($ million)
Data Table on UAE - Market size and forecast 2025-2030 ($ million)
Chart on UAE - Year-over-year growth 2025-2030 (%)
Data Table on UAE - Year-over-year growth 2025-2030 (%)

12.7.3 South Africa - Market size and forecast 2025-2030

Chart on South Africa - Market size and forecast 2025-2030 ($ million)
Data Table on South Africa - Market size and forecast 2025-2030 ($ million)
Chart on South Africa - Year-over-year growth 2025-2030 (%)
Data Table on South Africa - Year-over-year growth 2025-2030 (%)

12.7.4 Qatar - Market size and forecast 2025-2030

Chart on Qatar - Market size and forecast 2025-2030 ($ million)
Data Table on Qatar - Market size and forecast 2025-2030 ($ million)
Chart on Qatar - Year-over-year growth 2025-2030 (%)
Data Table on Qatar - Year-over-year growth 2025-2030 (%)

12.7.5 Egypt - Market size and forecast 2025-2030

Chart on Egypt - Market size and forecast 2025-2030 ($ million)
Data Table on Egypt - Market size and forecast 2025-2030 ($ million)
Chart on Egypt - Year-over-year growth 2025-2030 (%)
Data Table on Egypt - Year-over-year growth 2025-2030 (%)

12.8 Market opportunity by geography

Market opportunity by geography ($ million)
Data Tables on Market opportunity by geography ($ million)

13. Drivers, Challenges, and Opportunity

13.1 Market drivers

Acceleration of digital infrastructure and thermal management solutions
Expansion of high performance manufacturing and localized production hubs
Strategic mergers and acquisitions to enhance sustainable product portfolio

13.2 Market challenges

Volatility of raw material costs and feedstock dependency
Stringent environmental regulations and compliance burdens
Geopolitical instability and supply chain disruptions

13.3 Impact of drivers and challenges

Impact of drivers and challenges in 2025 and 2030

13.4 Market opportunities

Expansion of non-halogenated flame-retardant solutions for high-tech sectors
Diversification through specialty coatings acquisitions and know-how-based models
Integration of bio-based surfactants and fermentation technologies in care chemicals

14. Competitive Landscape

14.1 Overview

14.2

Overview on criticality of inputs and factors of differentiation

14.3 Landscape disruption

Overview on factors of disruption

14.4 Industry risks

Impact of key risks on business

15. Competitive Analysis

15.1 Companies profiled

Companies covered

15.2 Company ranking index

15.3 Market positioning of companies

Matrix on companies position and classification

15.4 Albemarle Corp.

Albemarle Corp. - Overview
Albemarle Corp. - Business segments
Albemarle Corp. - Key news
Albemarle Corp. - Key offerings
Albemarle Corp. - Segment focus
SWOT

15.5 BASF SE

BASF SE - Overview
BASF SE - Business segments
BASF SE - Key news
BASF SE - Key offerings
BASF SE - Segment focus
SWOT

15.6 Beardow and Adams Adhesives Ltd.

Beardow and Adams Adhesives Ltd. - Overview
Beardow and Adams Adhesives Ltd. - Product / Service
Beardow and Adams Adhesives Ltd. - Key offerings
SWOT

15.7 Clariant International Ltd.

Clariant International Ltd. - Overview
Clariant International Ltd. - Business segments
Clariant International Ltd. - Key news
Clariant International Ltd. - Key offerings
Clariant International Ltd. - Segment focus
SWOT

15.8 Danimer Scientific Inc.

Danimer Scientific Inc. - Overview
Danimer Scientific Inc. - Product / Service
Danimer Scientific Inc. - Key offerings
SWOT

15.9 Dow Chemical Co.

Dow Chemical Co. - Overview
Dow Chemical Co. - Business segments
Dow Chemical Co. - Key news
Dow Chemical Co. - Key offerings
Dow Chemical Co. - Segment focus
SWOT

15.10 Dymax Corp.

Dymax Corp. - Overview
Dymax Corp. - Product / Service
Dymax Corp. - Key offerings
SWOT

15.11 Evonik Industries AG

Evonik Industries AG - Overview
Evonik Industries AG - Business segments
Evonik Industries AG - Key news
Evonik Industries AG - Key offerings
Evonik Industries AG - Segment focus
SWOT

15.12 Exxon Mobil Corp.

Exxon Mobil Corp. - Overview
Exxon Mobil Corp. - Business segments
Exxon Mobil Corp. - Key news
Exxon Mobil Corp. - Key offerings
Exxon Mobil Corp. - Segment focus
SWOT

15.13 Henkel AG and Co. KGaA

Henkel AG and Co. KGaA - Overview
Henkel AG and Co. KGaA - Business segments
Henkel AG and Co. KGaA - Key news
Henkel AG and Co. KGaA - Key offerings
Henkel AG and Co. KGaA - Segment focus
SWOT

15.14 Huntsman International LLC

Huntsman International LLC - Overview
Huntsman International LLC - Business segments
Huntsman International LLC - Key news
Huntsman International LLC - Key offerings
Huntsman International LLC - Segment focus
SWOT

15.15 Nouryon Chemicals Holding B.V.

Nouryon Chemicals Holding B.V. - Overview
Nouryon Chemicals Holding B.V. - Product / Service
Nouryon Chemicals Holding B.V. - Key offerings
SWOT

15.16 PPG Industries Inc.

PPG Industries Inc. - Overview
PPG Industries Inc. - Business segments
PPG Industries Inc. - Key news
PPG Industries Inc. - Key offerings
PPG Industries Inc. - Segment focus
SWOT

15.17 Saudi Arabian Oil Co.

Saudi Arabian Oil Co. - Overview
Saudi Arabian Oil Co. - Business segments
Saudi Arabian Oil Co. - Key offerings
Saudi Arabian Oil Co. - Segment focus
SWOT

15.18 Solvay SA

Solvay SA - Overview
Solvay SA - Business segments
Solvay SA - Key news
Solvay SA - Key offerings
Solvay SA - Segment focus
SWOT

16. Appendix

16.1 Scope of the report

Market definition
Objectives
Notes and caveats

16.2 Inclusions and exclusions checklist

Inclusions checklist
Exclusions checklist

16.3 Currency conversion rates for US$

16.4 Research methodology

16.5 Data procurement

Information sources

16.6 Data validation

16.7 Validation techniques employed for market sizing

16.8 Data synthesis

16.9 360 degree market analysis

16.10 List of abbreviations

Research Methodology

Technavio presents a detailed picture of the market by way of study, synthesis, and summation of data from multiple sources. The analysts have presented the various facets of the market with a particular focus on identifying the key industry influencers. The data thus presented is comprehensive, reliable, and the result of extensive research, both primary and secondary.

INFORMATION SOURCES

Primary sources

  • Manufacturers and suppliers
  • Channel partners
  • Industry experts
  • Strategic decision makers

Secondary sources

  • Industry journals and periodicals
  • Government data
  • Financial reports of key industry players
  • Historical data
  • Press releases

DATA ANALYSIS

Data Synthesis

  • Collation of data
  • Estimation of key figures
  • Analysis of derived insights

Data Validation

  • Triangulation with data models
  • Reference against proprietary databases
  • Corroboration with industry experts

REPORT WRITING

Qualitative

  • Market drivers
  • Market challenges
  • Market trends
  • Five forces analysis

Quantitative

  • Market size and forecast
  • Market segmentation
  • Geographical insights
  • Competitive landscape

Interested in this report?

Get your sample now to see our research methodology and insights!

Download Now

Frequently Asked Questions

Specialty Chemicals market growth will increase by USD 381922.2 million during 2026-2030.

The Specialty Chemicals market is expected to grow at a CAGR of 6.3% during 2026-2030.

Specialty Chemicals market is segmented by End-user (Agrochemicals, Lubricant and oilfield chemicals, Adhesives and sealants, Industrial and institutional cleaners, Others) Type (Plasticizers, Water-based, Coagulants and flocculants, Scale inhibitors) Technology (Traditional chemical synthesis platforms, Bio-based production technologies, Advanced manufacturing platforms, Circular chemistry technologies)

Albemarle Corp., Ashland Inc., BASF SE, Beardow and Adams Adhesives Ltd., Clariant International Ltd., Danimer Scientific Inc., Dow Chemical Co., Dymax Corp., Evonik Industries AG, Exxon Mobil Corp., H.B. Fuller Co., Henkel AG and Co. KGaA, Huntsman International LLC, Lanxess AG, Nouryon Chemicals Holding B.V., PPG Industries Inc., Saudi Arabian Oil Co., Shree Ganesh Remedies Ltd., Solvay SA, Vibrantz Technologies are a few of the key vendors in the Specialty Chemicals market.

APAC will register the highest growth rate of 63% among the other regions. Therefore, the Specialty Chemicals market in APAC is expected to garner significant business opportunities for the vendors during the forecast period.

China, India, Japan, South Korea, Australia, Singapore, US, Canada, Mexico, Germany, France, UK, Italy, The Netherlands, Spain, Brazil, Argentina, Chile, Saudi Arabia, UAE, South Africa, Qatar, Egypt

  • Acceleration of digital infrastructure and thermal management solutions is the driving factor this market.

The Specialty Chemicals market vendors should focus on grabbing business opportunities from the End-user segment as it accounted for the largest market share in the base year.
RIA - Research AI Assistant
Ask RIA