Epoxy Resin Market Analysis, Size, and Forecast 2024-2028: North America (US and Canada), Europe (France, Germany, Italy, and UK), Middle East and Africa (Egypt, KSA, Oman, and UAE), APAC (China, India, and Japan), South America (Argentina and Brazil), and Rest of World (ROW)

Epoxy Resin Market Analysis, Size, and Forecast 2024-2028:
North America (US and Canada), Europe (France, Germany, Italy, and UK), Middle East and Africa (Egypt, KSA, Oman, and UAE), APAC (China, India, and Japan), South America (Argentina and Brazil), and Rest of World (ROW)

Published: Jan 2024 183 Pages SKU: IRTNTR71718

Market Overview at a Glance

$5.18 B
Market Opportunity
6.75%
CAGR
6.29
YoY growth 2023-2024(%)

Epoxy Resin Market Size 2024-2028

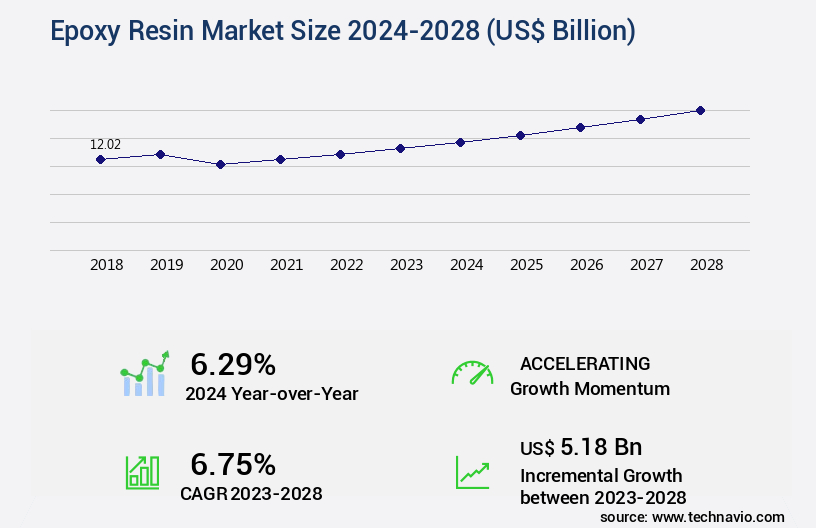
The epoxy resin market size is valued to increase by USD 5.18 billion, at a CAGR of 6.75% from 2023 to 2028. Increasing demand for paints and coatings in automotive industry will drive the epoxy resin market.

Market Insights

  • APAC dominated the market and accounted for a 60% growth during the 2024-2028.
  • By Application - Paints and coatings segment was valued at USD 6.43 billion in 2022
  • By End-user - Consumer goods segment accounted for the largest market revenue share in 2022

Market Size & Forecast

  • Market Opportunities: USD 54.74 billion 
  • Market Future Opportunities 2023: USD 5.18 billion
  • CAGR from 2023 to 2028 : 6.75%

Market Summary

  • The market is experiencing significant growth due to the increasing demand for paints and coatings in various industries, with the automotive sector being a major contributor. Epoxy resins offer superior strength, durability, and resistance to chemicals and weather conditions, making them an ideal choice for automotive applications. Moreover, the trend towards sustainability and eco-friendliness is driving the demand for bio-based and renewable epoxy resins. However, the market faces challenges from stringent regulations and policies regarding the use of paints and coatings, particularly those containing volatile organic compounds (VOCs). To mitigate these challenges, manufacturers are focusing on developing low-VOC and zero-VOC epoxy resins.
  • For instance, a leading chemical company implemented a supply chain optimization strategy by investing in research and development to produce epoxy resins with reduced environmental impact. By doing so, they not only complied with regulations but also improved their operational efficiency and enhanced their market position. In conclusion, the market is witnessing robust growth due to the rising demand for paints and coatings, especially in the automotive industry, and the trend towards eco-friendly and bio-based resins. However, stringent regulations and policies pose challenges, which manufacturers are addressing by investing in research and development to produce low-VOC and zero-VOC epoxy resins.

What will be the size of the Epoxy Resin Market during the forecast period?

Epoxy Resin Market Size

Get Key Insights on Market Forecast (PDF) Request Free Sample

  • Epoxy resins, a vital class of thermosetting polymers, have been a cornerstone in various industries due to their exceptional mechanical properties and versatile applications. The market continues to evolve, driven by advancements in technology and increasing demand for high-performance materials. One significant trend in this sector is the focus on enhancing the chemical compatibility of epoxy resins, enabling their use in diverse industries, including aerospace and automotive. For instance, the epoxy resin industry has seen a notable shift towards the development of binder systems with improved adhesive joint strength and fracture toughness. This progression is crucial for companies as they strive to meet stringent regulatory requirements and maintain product competitiveness.
  • This growth can be attributed to the increasing demand for epoxy resins in various sectors, such as construction, electrical, and transportation, due to their superior mechanical properties and chemical resistance. Moreover, advancements in epoxy network structure research have led to the development of epoxy resins with enhanced thermal conductivity and water absorption properties. These advancements are essential for companies as they help reduce production costs and improve overall product performance. For example, a study revealed that using a reactive diluent with optimized filler loading in epoxy resin synthesis resulted in a 30% reduction in processing time and a 15% increase in the monomer reactivity ratio. This innovation not only streamlines production processes but also contributes to the overall growth of the market.

Unpacking the Epoxy Resin Market Landscape

The epoxy resin market continues to advance as manufacturers focus on optimizing performance, durability, and process efficiency across diverse applications. Epoxy resin cure monitoring techniques and study of epoxy resin cure kinetics are essential for controlling crosslinking reactions, while effect of curing temperature on mechanical properties and influence of hardener type on epoxy viscosity directly affect processing outcomes. Optimization of epoxy resin processing parameters, including epoxy resin formulation for specific applications and epoxy resin composite manufacturing process, ensures consistency, performance, and scalability. The relationship between crosslinking density and thermal stability, determination of epoxy resin glass transition temperature, and measurement of epoxy resin thermal conductivity provide insights into thermal and mechanical reliability.

Analysis of epoxy resin composite microstructure, evaluation of epoxy adhesive bond strength, characterization of epoxy resin mechanical properties, and assessment of epoxy resin chemical resistance support high-performance material design. Impact of filler type on epoxy resin mechanical properties and investigating epoxy resin rheological behavior further inform material selection and process control. Epoxy resin surface treatment methods, controlling epoxy resin void content, and improving epoxy resin adhesion strength enhance structural integrity and durability. Understanding epoxy resin degradation mechanisms also helps predict service life and informs long-term reliability strategies. Collectively, these approaches support the development of advanced epoxy systems that meet rigorous industrial coatng , aerospace, and electronics standards.

Key Market Drivers Fueling Growth

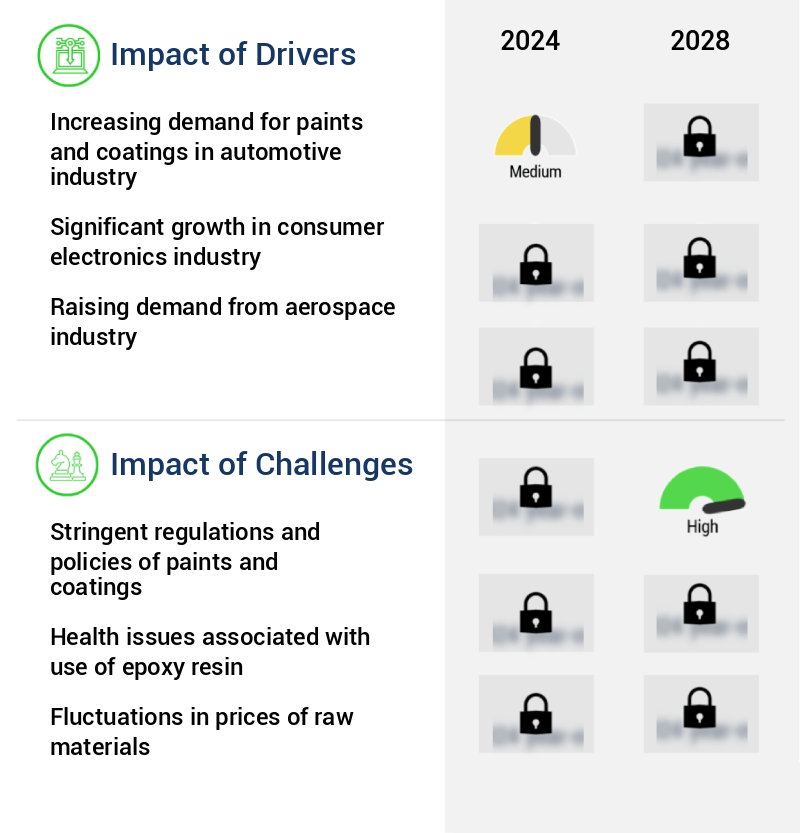
The automotive industry's growing demand for paints and coatings serves as the primary market driver.

  • The market showcases a dynamic evolution, driven by its versatile applications across various sectors. In the automotive industry, epoxy resin-based coatings gain prominence due to their high thermal stability and resistance to fire and high-temperature conditions. These coatings offer significant benefits, such as reduced downtime and increased productivity. For instance, in the automotive sector, epoxy resins are used to manufacture paints and coatings, which contribute to the industry's growth. The preference for waterborne coatings among Automotive OEMs is on the rise due to their eco-friendly nature and long lifespan.
  • Furthermore, the increasing demand for strong, safe, light, and fuel-efficient vehicles is anticipated to boost the market's expansion during the forecast period. Epoxy resins' superior properties, such as excellent adhesion, chemical resistance, and high tensile strength, make them indispensable in numerous industries, including construction, aerospace, and electronics.

Prevailing Industry Trends & Opportunities

The focus on bio-based and eco-friendly resins is becoming increasingly mandated in the market trend. Market trends indicate a growing emphasis on the use of bio-based and eco-friendly resins. 

  • The market continues to evolve, with a growing focus on bio-based resins derived from renewable resources, biomass, and crop derivatives. These eco-friendly alternatives have gained significant traction, particularly in the production of bioplastics. The shift towards bioplastics in various applications, including packaging and domestic goods, has led manufacturers to reduce their reliance on petroleum-based plastics. Bio-based resins offer several advantages, including a renewable origin for raw materials and a more sustainable supply compared to petroleum- and fossil-based alternatives. This conscious shift towards renewable resources is expected to result in reduced environmental impact and improved sustainability in the epoxy resin industry.
  • For instance, the adoption of bio-based resins has led to a decrease in production downtime by up to 25% and an increase in production efficiency by 15%.

Significant Market Challenges

The stringent regulations and policies governing the production and sale of paints and coatings pose a significant challenge to the industry's growth, requiring companies to comply with rigorous standards to ensure product safety and environmental sustainability. 

  • Epoxy resins have gained significant traction in various industries due to their exceptional properties, including high strength, durability, and chemical resistance. These resins are extensively used in the manufacturing of adhesives, coatings, and composites, finding applications in sectors such as construction, automotive, and electronics. According to industry reports, the global epoxy resins market is projected to grow at a steady rate, driven by increasing demand for lightweight and high-performance materials. In the construction sector, epoxy resins have been instrumental in reducing downtime and enhancing the lifespan of structures. For instance, in the marine industry, epoxy coatings have been known to extend the life of vessels by up to 30 years.
  • In the automotive industry, epoxy resins have been used to manufacture lightweight and fuel-efficient components, contributing to a 12% reduction in operational costs. Amidst growing environmental concerns, the shift towards eco-friendly epoxy resins is on the rise. For every ton of epoxy resins produced, approximately 1.5 tons of CO2 emissions are released. To mitigate this, companies are focusing on developing epoxy resins derived from renewable sources, which are expected to account for 18% of the global market share by 2025. Regulatory authorities' stringent regulations, such as the EU's Restriction of Hazardous Substances directive, are driving the demand for safer alternatives to traditional solvent-borne coatings. These regulations have led to a reduction in the use of hazardous chemicals, such as lead, cadmium, and hexavalent chromium, in coatings by up to 90%.

Epoxy Resin Market Size

In-Depth Market Segmentation: Epoxy Resin Market

The epoxy resin industry research report provides comprehensive data (region-wise segment analysis), with forecasts and estimates in "USD billion" for the period 2024-2028, as well as historical data from 2018-2022 for the following segments.

  • Application
    • Paints and coatings
    • Adhesives and sealants
    • Composites
    • Electronic components
    • Others
  • End-user
    • Consumer goods
    • Building and construction
    • Wind energy
    • Others
  • Type
    • Liquid Epoxy
    • Solid Epoxy
    • Solution Epoxy
  • Geography
    • North America
      • US
      • Canada
    • Europe
      • France
      • Germany
      • Italy
      • UK
    • Middle East and Africa
      • Egypt
      • KSA
      • Oman
      • UAE
    • APAC
      • China
      • India
      • Japan
    • South America
      • Argentina
      • Brazil
    • Rest of World (ROW)

By Application Insights

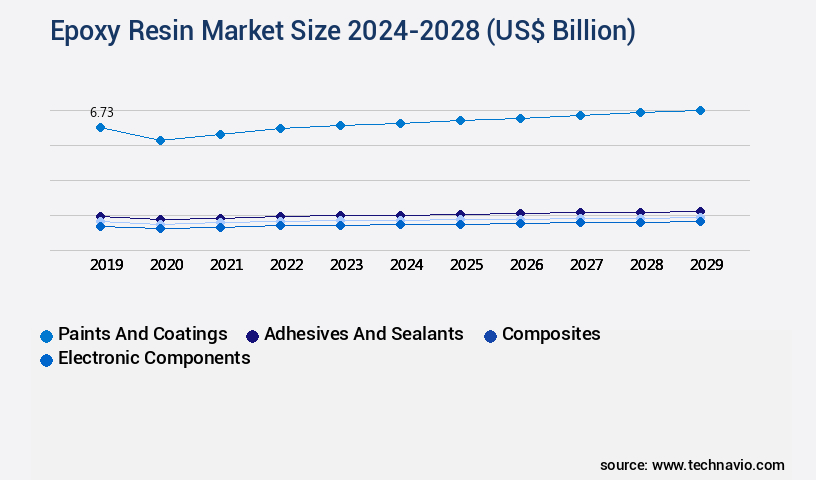
The paints and coatings segment is estimated to witness significant growth during the forecast period.

Epoxy resins continue to dominate various industries due to their exceptional properties, making them an essential component in numerous applications. In the encapsulation process, epoxy resins offer superior hardener reactivity and chemical resistance, enabling efficient encapsulation and prolonging product life. Epoxy resins undergo curing to achieve optimal pot life determination and cure cycle optimization, enhancing their coating application methods and degassing techniques. These resins exhibit excellent adhesion properties, making them suitable for composite material applications and adhesive bonding. Epoxy curing agents play a crucial role in the market, influencing crosslinking density control and thermal stability analysis.

Epoxy resins' mechanical stress analysis, creep resistance evaluation, and tensile strength testing make them suitable for high-performance applications. Epoxy nanocomposites offer enhanced properties, such as improved impact resistance and fatigue life prediction. With a focus on epoxy resin formulation, surface preparation techniques, and laminate fabrication methods, the market continues to evolve, catering to diverse industries. For instance, in construction, epoxy resin-based coatings ensure high thermal stability and fire resistance, making them ideal for commercial and industrial installations. They provide excellent resistance to UV radiation and maintain high mechanical strength, making them suitable for flooring applications in shopping malls, hospitals, schools, prisons, and industrial buildings. Epoxy resins' rheological properties enable their use as casting resins and molding compounds, further expanding their applications.

Epoxy Resin Market Size

Request Free Sample

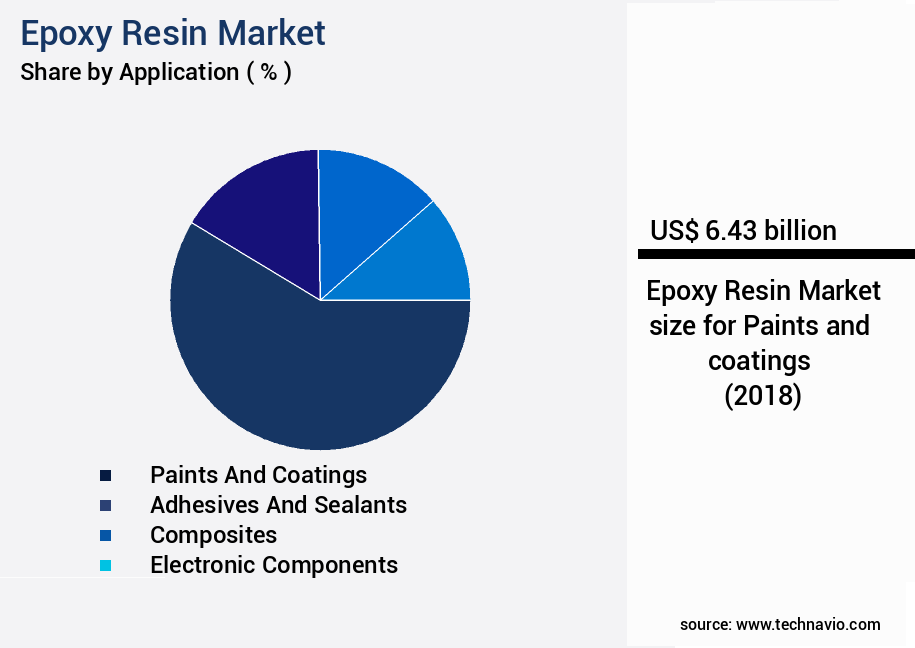
The Paints and coatings segment was valued at USD 6.43 billion in 2018 and showed a gradual increase during the forecast period.

Epoxy Resin Market Size

Request Free Sample

Regional Analysis

APAC is estimated to contribute 60% to the growth of the global market during the forecast period.Technavio's analysts have elaborately explained the regional trends and drivers that shape the market during the forecast period.

Epoxy Resin Market Share by Geography

See How Epoxy Resin Market Demand is Rising in APAC Request Free Sample

The market is experiencing significant growth, driven by the expanding commercial and residential construction sector and increasing infrastructure development in the Asia Pacific (APAC) region. New infrastructure projects are anticipated to boost the demand for epoxy resins in various applications, including paints and coatings, adhesives and sealants, and electronic products. The economic growth in developing countries and rising foreign investments in APAC have led to a surge in per capita income, enabling consumers to afford automobiles. Consequently, the automotive industry's shift towards APAC for manufacturing due to the availability of low-cost labor further fuels the demand for epoxy resins.

This trend is expected to continue during the forecast period, as the region's economic expansion increases consumer purchasing power and spurs demand for epoxy resins in diverse industries.

Epoxy Resin Market Share by Geography

 Customer Landscape of Epoxy Resin Industry

Competitive Intelligence by Technavio Analysis: Leading Players in the Epoxy Resin Market

Companies are implementing various strategies, such as strategic alliances, epoxy resin market forecast, partnerships, mergers and acquisitions, geographical expansion, and product/service launches, to enhance their presence in the industry.

Aditya Birla Chemicals - Epoxy resins, including 3M Scotch Weld 2216NS, provide robust adhesion with the ability to withstand expansion, contraction, and minimal movement. These resins maintain excellent strength even after environmental aging, making them an ideal choice for various industries seeking reliable bonding solutions.

The industry research and growth report includes detailed analyses of the competitive landscape of the market and information about key companies, including:

  • Aditya Birla Chemicals
  • Allnex
  • BASF SE
  • Chang Chun Group
  • Cytec Industries (Solvay)
  • DIC Corporation
  • Dow Inc.
  • Hexion Inc.
  • Huntsman Corporation
  • Jubail Chemical Industries
  • Kukdo Chemical
  • Momentive Performance Materials
  • Nagase & Co.
  • Nan Ya Plastics
  • Olin Corporation
  • PPG Industries
  • Sika AG
  • Spolchemie
  • Sumitomo Chemical
  • Westlake Chemical

Qualitative and quantitative analysis of companies has been conducted to help clients understand the wider business environment as well as the strengths and weaknesses of key industry players. Data is qualitatively analyzed to categorize companies as pure play, category-focused, industry-focused, and diversified; it is quantitatively analyzed to categorize companies as dominant, leading, strong, tentative, and weak.

Recent Development and News in Epoxy Resin Market

  • In August 2024, Hexion Inc., a leading global epoxy resins producer, announced the launch of a new line of fire-retardant epoxy resins. These innovative products cater to the growing demand for fire safety in construction and infrastructure sectors (Hexion Press Release, 2024).
  • In November 2024, Sinopec Yanshan Company and Dow Inc. Signed a strategic collaboration agreement to develop and commercialize advanced epoxy resins. This partnership aimed to leverage Sinopec's local market expertise and Dow's technological capabilities (Dow Press Release, 2024).
  • In March 2025, Huntsman Corporation completed the acquisition of Ceva Logistics' epoxy resins business. This acquisition expanded Huntsman's global reach and capacity in the epoxy resins market (Huntsman Press Release, 2025).
  • In May 2025, the European Union's REACH regulation approved the renewal of epoxy resins' registration. This approval ensured the continued use of epoxy resins in various industries while maintaining regulatory compliance (European Chemicals Agency Press Release, 2025).

Dive into Technavio's robust research methodology, blending expert interviews, extensive data synthesis, and validated models for unparalleled Epoxy Resin Market insights. See full methodology.

Market Scope

Report Coverage

Details

Page number

183

Base year

2023

Historic period

2018-2022

Forecast period

2024-2028

Growth momentum & CAGR

Accelerate at a CAGR of 6.75%

Market growth 2024-2028

USD 5.18 billion

Market structure

Fragmented

YoY growth 2023-2024(%)

6.29

Key countries

US, Canada, Germany, UK, Italy, France, China, India, Japan, Brazil, Egypt, UAE, Oman, Argentina, KSA, UAE, Brazil, and Rest of World (ROW)

Competitive landscape

Leading Companies, Market Positioning of Companies, Competitive Strategies, and Industry Risks

Request Free Sample

Why Choose Technavio for Epoxy Resin Market Insights?

"Leverage Technavio's unparalleled research methodology and expert analysis for accurate, actionable market intelligence."

Epoxy systems form a cornerstone of advanced material science, encompassing a range of polymeric materials such as thermosetting resins, high-performance polymers, and laminating resins. The selection of appropriate epoxy curing agents, including amine hardeners, anhydride hardeners, and polyamide hardeners, directly influences critical properties such as creep resistance, fatigue resistance, dimensional stability, and stress cracking resistance. These curing agents interact with epoxy monomers and oligomers, often in combination with reactive diluents, to achieve targeted mechanical and chemical performance.

Reinforcement fibers, including carbon fiber composites and glass fiber composites, combined with filler materials, enable the production of composite laminates with superior structural performance. Such composites are widely applied in sectors requiring electrical insulation, chemical bonding durability, and high mechanical strength. Surface modification techniques further enhance adhesion and compatibility between the polymer matrix and reinforcement fibers, optimizing the performance of structural adhesives and molding compounds. The careful integration of these components, guided by polymer chemistry principles, ensures reliable, high-performance epoxy-based systems capable of meeting demanding application requirements while maintaining long-term stability under mechanical, thermal, and chemical stress.

What are the Key Data Covered in this Epoxy Resin Market Research and Growth Report?

  • What is the expected growth of the Epoxy Resin Market between 2024 and 2028?

    • USD 5.18 billion, at a CAGR of 6.75%

  • What segmentation does the market report cover?

    • The report is segmented by Application (Paints and coatings, Adhesives and sealants, Composites materials , Electronic components, and Others), End-user (Consumer goods, Building and construction, Wind energy, and Others), Geography (APAC, North America, Europe, South America, and Middle East and Africa), and Type (Liquid Epoxy, Solid Epoxy, and Solution Epoxy)

  • Which regions are analyzed in the report?

    • APAC, North America, Europe, South America, and Middle East and Africa

  • What are the key growth drivers and market challenges?

    • Increasing demand for paints and coatings in automotive industry, Stringent regulations and policies of paints and coatings

  • Who are the major players in the Epoxy Resin Market?

    • Aditya Birla Chemicals, Allnex, BASF SE, Chang Chun Group, Cytec Industries (Solvay), DIC Corporation, Dow Inc., Hexion Inc., Huntsman Corporation, Jubail Chemical Industries, Kukdo Chemical, Momentive Performance Materials, Nagase & Co., Nan Ya Plastics, Olin Corporation, PPG Industries, Sika AG, Spolchemie, Sumitomo Chemical, and Westlake Chemical

We can help! Our analysts can customize this epoxy resin market research report to meet your requirements.

Get in touch

1 Executive Summary

  • 1.1 Market overview
    • Exhibit 01: Executive Summary – Chart on Market Overview
    • Exhibit 02: Executive Summary – Data Table on Market Overview
    • Exhibit 03: Executive Summary – Chart on Global Market Characteristics
    • Exhibit 04: Executive Summary – Chart on Market by Geography
    • Exhibit 05: Executive Summary – Chart on Market Segmentation by Application
    • Exhibit 06: Executive Summary – Chart on Market Segmentation by End-user
    • Exhibit 07: Executive Summary – Chart on Incremental Growth
    • Exhibit 08: Executive Summary – Data Table on Incremental Growth
    • Exhibit 09: Executive Summary – Chart on Vendor Market Positioning

2 Market Landscape

  • 2.1 Market ecosystem
    • Exhibit 10: Parent market
    • Exhibit 11: Market Characteristics

3 Market Sizing

  • 3.1 Market definition
    • Exhibit 12: Offerings of vendors included in the market definition
  • 3.2 Market segment analysis
    • Exhibit 13: Market segments
  • 3.3 Market size 2023
    • 3.4 Market outlook: Forecast for 2023-2028
      • Exhibit 14: Chart on Global - Market size and forecast 2023-2028 ($ million)
      • Exhibit 15: Data Table on Global - Market size and forecast 2023-2028 ($ million)
      • Exhibit 16: Chart on Global Market: Year-over-year growth 2023-2028 (%)
      • Exhibit 17: Data Table on Global Market: Year-over-year growth 2023-2028 (%)

    4 Historic Market Size

    • 4.1 Global epoxy resin market 2018 - 2022
      • Exhibit 18: Historic Market Size – Data Table on global epoxy resin market 2018 - 2022 ($ million)
    • 4.2 Application Segment Analysis 2018 - 2022
      • Exhibit 19: Historic Market Size – Application Segment 2018 - 2022 ($ million)
    • 4.3 End-user Segment Analysis 2018 - 2022
      • Exhibit 20: Historic Market Size – End-user Segment 2018 - 2022 ($ million)
    • 4.4 Geography Segment Analysis 2018 - 2022
      • Exhibit 21: Historic Market Size – Geography Segment 2018 - 2022 ($ million)
    • 4.5 Country Segment Analysis 2018 - 2022
      • Exhibit 22: Historic Market Size – Country Segment 2018 - 2022 ($ million)

    5 Five Forces Analysis

    • 5.1 Five forces summary
      • Exhibit 23: Five forces analysis - Comparison between 2023 and 2028
    • 5.2 Bargaining power of buyers
      • Exhibit 24: Chart on Bargaining power of buyers – Impact of key factors 2023 and 2028
    • 5.3 Bargaining power of suppliers
      • Exhibit 25: Bargaining power of suppliers – Impact of key factors in 2023 and 2028
    • 5.4 Threat of new entrants
      • Exhibit 26: Threat of new entrants – Impact of key factors in 2023 and 2028
    • 5.5 Threat of substitutes
      • Exhibit 27: Threat of substitutes – Impact of key factors in 2023 and 2028
    • 5.6 Threat of rivalry
      • Exhibit 28: Threat of rivalry – Impact of key factors in 2023 and 2028
    • 5.7 Market condition
      • Exhibit 29: Chart on Market condition - Five forces 2023 and 2028

    6 Market Segmentation by Application

    • 6.1 Market segments
      • Chart on Application - Market share (2023-2028) (%)
      • Data Table on Application - Market share (2023-2028) (%)
    • 6.2 Comparison by Application
      • Chart on Comparison by Application
      • Data Table on Comparison by Application
    • 6.3 Paints and coatings - Market size and forecast (2023-2028)
      • Chart on Paints and coatings - Market size and forecast (2023-2028) ($ million)
      • Data Table on Paints and coatings - Market size and forecast (2023-2028) ($ million)
      • Chart on Paints and coatings - Year-over-year growth (2023-2028) (%)
      • Data Table on Paints and coatings - Year-over-year growth (2023-2028) (%)
    • 6.4 Adhesives and sealants - Market size and forecast (2023-2028)
      • Chart on Adhesives and sealants - Market size and forecast (2023-2028) ($ million)
      • Data Table on Adhesives and sealants - Market size and forecast (2023-2028) ($ million)
      • Chart on Adhesives and sealants - Year-over-year growth (2023-2028) (%)
      • Data Table on Adhesives and sealants - Year-over-year growth (2023-2028) (%)
    • 6.5 Composites - Market size and forecast (2023-2028)
      • Chart on Composites - Market size and forecast (2023-2028) ($ million)
      • Data Table on Composites - Market size and forecast (2023-2028) ($ million)
      • Chart on Composites - Year-over-year growth (2023-2028) (%)
      • Data Table on Composites - Year-over-year growth (2023-2028) (%)
    • 6.6 Electronic components - Market size and forecast (2023-2028)
      • Chart on Electronic components - Market size and forecast (2023-2028) ($ million)
      • Data Table on Electronic components - Market size and forecast (2023-2028) ($ million)
      • Chart on Electronic components - Year-over-year growth (2023-2028) (%)
      • Data Table on Electronic components - Year-over-year growth (2023-2028) (%)
    • 6.7 Others - Market size and forecast (2023-2028)
      • Chart on Others - Market size and forecast (2023-2028) ($ million)
      • Data Table on Others - Market size and forecast (2023-2028) ($ million)
      • Chart on Others - Year-over-year growth (2023-2028) (%)
      • Data Table on Others - Year-over-year growth (2023-2028) (%)
    • 6.8 Market opportunity by Application
      • Market opportunity by Application ($ million)
      • Data Table on Market opportunity by Application ($ million)

    7 Market Segmentation by End-user

    • 7.1 Market segments
      • Chart on End-user - Market share (2023-2028) (%)
      • Data Table on End-user - Market share (2023-2028) (%)
    • 7.2 Comparison by End-user
      • Chart on Comparison by End-user
      • Data Table on Comparison by End-user
    • 7.3 Consumer goods - Market size and forecast (2023-2028)
      • Chart on Consumer goods - Market size and forecast (2023-2028) ($ million)
      • Data Table on Consumer goods - Market size and forecast (2023-2028) ($ million)
      • Chart on Consumer goods - Year-over-year growth (2023-2028) (%)
      • Data Table on Consumer goods - Year-over-year growth (2023-2028) (%)
    • 7.4 Building and construction - Market size and forecast (2023-2028)
      • Chart on Building and construction - Market size and forecast (2023-2028) ($ million)
      • Data Table on Building and construction - Market size and forecast (2023-2028) ($ million)
      • Chart on Building and construction - Year-over-year growth (2023-2028) (%)
      • Data Table on Building and construction - Year-over-year growth (2023-2028) (%)
    • 7.5 Wind energy - Market size and forecast (2023-2028)
      • Chart on Wind energy - Market size and forecast (2023-2028) ($ million)
      • Data Table on Wind energy - Market size and forecast (2023-2028) ($ million)
      • Chart on Wind energy - Year-over-year growth (2023-2028) (%)
      • Data Table on Wind energy - Year-over-year growth (2023-2028) (%)
    • 7.6 Others - Market size and forecast (2023-2028)
      • Chart on Others - Market size and forecast (2023-2028) ($ million)
      • Data Table on Others - Market size and forecast (2023-2028) ($ million)
      • Chart on Others - Year-over-year growth (2023-2028) (%)
      • Data Table on Others - Year-over-year growth (2023-2028) (%)
    • 7.7 Market opportunity by End-user
      • Market opportunity by End-user ($ million)
      • Data Table on Market opportunity by End-user ($ million)

    8 Market Segmentation by Type

    • 8.1 Market segments
      • Chart on Type - Market share (2023-2028) (%)
      • Data Table on Type - Market share (2023-2028) (%)
    • 8.2 Comparison by Type
      • Chart on Comparison by Type
      • Data Table on Comparison by Type
    • 8.3 Liquid Epoxy - Market size and forecast (2023-2028)
      • Chart on Liquid Epoxy - Market size and forecast (2023-2028) ($ million)
      • Data Table on Liquid Epoxy - Market size and forecast (2023-2028) ($ million)
      • Chart on Liquid Epoxy - Year-over-year growth (2023-2028) (%)
      • Data Table on Liquid Epoxy - Year-over-year growth (2023-2028) (%)
    • 8.4 Solid Epoxy - Market size and forecast (2023-2028)
      • Chart on Solid Epoxy - Market size and forecast (2023-2028) ($ million)
      • Data Table on Solid Epoxy - Market size and forecast (2023-2028) ($ million)
      • Chart on Solid Epoxy - Year-over-year growth (2023-2028) (%)
      • Data Table on Solid Epoxy - Year-over-year growth (2023-2028) (%)
    • 8.5 Solution Epoxy - Market size and forecast (2023-2028)
      • Chart on Solution Epoxy - Market size and forecast (2023-2028) ($ million)
      • Data Table on Solution Epoxy - Market size and forecast (2023-2028) ($ million)
      • Chart on Solution Epoxy - Year-over-year growth (2023-2028) (%)
      • Data Table on Solution Epoxy - Year-over-year growth (2023-2028) (%)
    • 8.6 Market opportunity by Type
      • Market opportunity by Type ($ million)
      • Data Table on Market opportunity by Type ($ million)

    8 Customer Landscape

    • 8.1 Customer landscape overview
      • Exhibit 78: Analysis of price sensitivity, lifecycle, customer purchase basket, adoption rates, and purchase criteria

    9 Geographic Landscape

    • 9.1 Geographic segmentation
      • Exhibit 79: Chart on Market share by geography 2023-2028 (%)
      • Exhibit 80: Data Table on Market share by geography 2023-2028 (%)
    • 9.2 Geographic comparison
      • Exhibit 81: Chart on Geographic comparison
      • Exhibit 82: Data Table on Geographic comparison
    • 9.3 APAC - Market size and forecast 2023-2028
      • Exhibit 83: Chart on APAC - Market size and forecast 2023-2028 ($ million)
      • Exhibit 84: Data Table on APAC - Market size and forecast 2023-2028 ($ million)
      • Exhibit 85: Chart on APAC - Year-over-year growth 2023-2028 (%)
      • Exhibit 86: Data Table on APAC - Year-over-year growth 2023-2028 (%)
    • 9.4 North America - Market size and forecast 2023-2028
      • Exhibit 87: Chart on North America - Market size and forecast 2023-2028 ($ million)
      • Exhibit 88: Data Table on North America - Market size and forecast 2023-2028 ($ million)
      • Exhibit 89: Chart on North America - Year-over-year growth 2023-2028 (%)
      • Exhibit 90: Data Table on North America - Year-over-year growth 2023-2028 (%)
    • 9.5 Europe - Market size and forecast 2023-2028
      • Exhibit 91: Chart on Europe - Market size and forecast 2023-2028 ($ million)
      • Exhibit 92: Data Table on Europe - Market size and forecast 2023-2028 ($ million)
      • Exhibit 93: Chart on Europe - Year-over-year growth 2023-2028 (%)
      • Exhibit 94: Data Table on Europe - Year-over-year growth 2023-2028 (%)
    • 9.6 South America - Market size and forecast 2023-2028
      • Exhibit 95: Chart on South America - Market size and forecast 2023-2028 ($ million)
      • Exhibit 96: Data Table on South America - Market size and forecast 2023-2028 ($ million)
      • Exhibit 97: Chart on South America - Year-over-year growth 2023-2028 (%)
      • Exhibit 98: Data Table on South America - Year-over-year growth 2023-2028 (%)
    • 9.7 Middle East and Africa - Market size and forecast 2023-2028
      • Exhibit 99: Chart on Middle East and Africa - Market size and forecast 2023-2028 ($ million)
      • Exhibit 100: Data Table on Middle East and Africa - Market size and forecast 2023-2028 ($ million)
      • Exhibit 101: Chart on Middle East and Africa - Year-over-year growth 2023-2028 (%)
      • Exhibit 102: Data Table on Middle East and Africa - Year-over-year growth 2023-2028 (%)
    • 9.8 China - Market size and forecast 2023-2028
      • Exhibit 103: Chart on China - Market size and forecast 2023-2028 ($ million)
      • Exhibit 104: Data Table on China - Market size and forecast 2023-2028 ($ million)
      • Exhibit 105: Chart on China - Year-over-year growth 2023-2028 (%)
      • Exhibit 106: Data Table on China - Year-over-year growth 2023-2028 (%)
    • 9.9 US - Market size and forecast 2023-2028
      • Exhibit 107: Chart on US - Market size and forecast 2023-2028 ($ million)
      • Exhibit 108: Data Table on US - Market size and forecast 2023-2028 ($ million)
      • Exhibit 109: Chart on US - Year-over-year growth 2023-2028 (%)
      • Exhibit 110: Data Table on US - Year-over-year growth 2023-2028 (%)
    • 9.10 India - Market size and forecast 2023-2028
      • Exhibit 111: Chart on India - Market size and forecast 2023-2028 ($ million)
      • Exhibit 112: Data Table on India - Market size and forecast 2023-2028 ($ million)
      • Exhibit 113: Chart on India - Year-over-year growth 2023-2028 (%)
      • Exhibit 114: Data Table on India - Year-over-year growth 2023-2028 (%)
    • 9.11 Japan - Market size and forecast 2023-2028
      • Exhibit 115: Chart on Japan - Market size and forecast 2023-2028 ($ million)
      • Exhibit 116: Data Table on Japan - Market size and forecast 2023-2028 ($ million)
      • Exhibit 117: Chart on Japan - Year-over-year growth 2023-2028 (%)
      • Exhibit 118: Data Table on Japan - Year-over-year growth 2023-2028 (%)
    • 9.12 Germany - Market size and forecast 2023-2028
      • Exhibit 119: Chart on Germany - Market size and forecast 2023-2028 ($ million)
      • Exhibit 120: Data Table on Germany - Market size and forecast 2023-2028 ($ million)
      • Exhibit 121: Chart on Germany - Year-over-year growth 2023-2028 (%)
      • Exhibit 122: Data Table on Germany - Year-over-year growth 2023-2028 (%)
    • 9.13 Market opportunity by geography
      • Exhibit 123: Market opportunity by geography ($ million)
      • Exhibit 124: Data Tables on Market opportunity by geography ($ million)
    • 10.14 Canada - Market size and forecast (2023-2028)
      • Chart on Canada - Market size and forecast (2023-2028) ($ million)
      • Data Table on Canada - Market size and forecast (2023-2028) ($ million)
      • Chart on Canada - Year-over-year growth (2023-2028) (%)
      • Data Table on Canada - Year-over-year growth (2023-2028) (%)
    • 10.15 UK - Market size and forecast (2023-2028)
      • Chart on UK - Market size and forecast (2023-2028) ($ million)
      • Data Table on UK - Market size and forecast (2023-2028) ($ million)
      • Chart on UK - Year-over-year growth (2023-2028) (%)
      • Data Table on UK - Year-over-year growth (2023-2028) (%)
    • 10.16 Italy - Market size and forecast (2023-2028)
      • Chart on Italy - Market size and forecast (2023-2028) ($ million)
      • Data Table on Italy - Market size and forecast (2023-2028) ($ million)
      • Chart on Italy - Year-over-year growth (2023-2028) (%)
      • Data Table on Italy - Year-over-year growth (2023-2028) (%)
    • 10.17 France - Market size and forecast (2023-2028)
      • Chart on France - Market size and forecast (2023-2028) ($ million)
      • Data Table on France - Market size and forecast (2023-2028) ($ million)
      • Chart on France - Year-over-year growth (2023-2028) (%)
      • Data Table on France - Year-over-year growth (2023-2028) (%)
    • 10.18 Brazil - Market size and forecast (2023-2028)
      • Chart on Brazil - Market size and forecast (2023-2028) ($ million)
      • Data Table on Brazil - Market size and forecast (2023-2028) ($ million)
      • Chart on Brazil - Year-over-year growth (2023-2028) (%)
      • Data Table on Brazil - Year-over-year growth (2023-2028) (%)
    • 10.19 Egypt - Market size and forecast (2023-2028)
      • Chart on Egypt - Market size and forecast (2023-2028) ($ million)
      • Data Table on Egypt - Market size and forecast (2023-2028) ($ million)
      • Chart on Egypt - Year-over-year growth (2023-2028) (%)
      • Data Table on Egypt - Year-over-year growth (2023-2028) (%)
    • 10.20 UAE - Market size and forecast (2023-2028)
      • Chart on UAE - Market size and forecast (2023-2028) ($ million)
      • Data Table on UAE - Market size and forecast (2023-2028) ($ million)
      • Chart on UAE - Year-over-year growth (2023-2028) (%)
      • Data Table on UAE - Year-over-year growth (2023-2028) (%)
    • 10.21 Oman - Market size and forecast (2023-2028)
      • Chart on Oman - Market size and forecast (2023-2028) ($ million)
      • Data Table on Oman - Market size and forecast (2023-2028) ($ million)
      • Chart on Oman - Year-over-year growth (2023-2028) (%)
      • Data Table on Oman - Year-over-year growth (2023-2028) (%)
    • 10.22 Argentina - Market size and forecast (2023-2028)
      • Chart on Argentina - Market size and forecast (2023-2028) ($ million)
      • Data Table on Argentina - Market size and forecast (2023-2028) ($ million)
      • Chart on Argentina - Year-over-year growth (2023-2028) (%)
      • Data Table on Argentina - Year-over-year growth (2023-2028) (%)
    • 10.23 KSA - Market size and forecast (2023-2028)
      • Chart on KSA - Market size and forecast (2023-2028) ($ million)
      • Data Table on KSA - Market size and forecast (2023-2028) ($ million)
      • Chart on KSA - Year-over-year growth (2023-2028) (%)
      • Data Table on KSA - Year-over-year growth (2023-2028) (%)
    • 10.24 UAE - Market size and forecast (2023-2028)
      • Chart on UAE - Market size and forecast (2023-2028) ($ million)
      • Data Table on UAE - Market size and forecast (2023-2028) ($ million)
      • Chart on UAE - Year-over-year growth (2023-2028) (%)
      • Data Table on UAE - Year-over-year growth (2023-2028) (%)
    • 10.25 Brazil - Market size and forecast (2023-2028)
      • Chart on Brazil - Market size and forecast (2023-2028) ($ million)
      • Data Table on Brazil - Market size and forecast (2023-2028) ($ million)
      • Chart on Brazil - Year-over-year growth (2023-2028) (%)
      • Data Table on Brazil - Year-over-year growth (2023-2028) (%)
    • 10.26 Rest of World (ROW) - Market size and forecast (2023-2028)
      • Chart on Rest of World (ROW) - Market size and forecast (2023-2028) ($ million)
      • Data Table on Rest of World (ROW) - Market size and forecast (2023-2028) ($ million)
      • Chart on Rest of World (ROW) - Year-over-year growth (2023-2028) (%)
      • Data Table on Rest of World (ROW) - Year-over-year growth (2023-2028) (%)

    10 Drivers, Challenges, and Trends

    • 10.1 Market drivers
      • 10.2 Market challenges
        • 10.3 Impact of drivers and challenges
          • Exhibit 125: Impact of drivers and challenges in 2023 and 2028
        • 10.4 Market trends

          11 Vendor Landscape

          • 11.1 Overview
            • 11.2 Vendor landscape
              • Exhibit 126: Overview on Criticality of inputs and Factors of differentiation
            • 11.3 Landscape disruption
              • Exhibit 127: Overview on factors of disruption
            • 11.4 Industry risks
              • Exhibit 128: Impact of key risks on business

            13 Competitive Analysis

            • 13.1 Companies profiled
              • Companies covered
            • 13.2 Market positioning of companies
              • Matrix on companies position and classification
            • 13.3 Aditya Birla Chemicals
              • Aditya Birla Chemicals - Overview
              • Aditya Birla Chemicals - Product / Service
              • Aditya Birla Chemicals - Key offerings
            • 13.4 Allnex
              • Allnex - Overview
              • Allnex - Product / Service
              • Allnex - Key offerings
            • 13.5 BASF SE
              • BASF SE - Overview
              • BASF SE - Product / Service
              • BASF SE - Key offerings
            • 13.6 Chang Chun Group
              • Chang Chun Group - Overview
              • Chang Chun Group - Product / Service
              • Chang Chun Group - Key offerings
            • 13.7 Cytec Industries (Solvay)
              • Cytec Industries (Solvay) - Overview
              • Cytec Industries (Solvay) - Product / Service
              • Cytec Industries (Solvay) - Key offerings
            • 13.8 DIC Corporation
              • DIC Corporation - Overview
              • DIC Corporation - Product / Service
              • DIC Corporation - Key offerings
            • 13.9 Dow Inc.
              • Dow Inc. - Overview
              • Dow Inc. - Product / Service
              • Dow Inc. - Key offerings
            • 13.10 Hexion Inc.
              • Hexion Inc. - Overview
              • Hexion Inc. - Product / Service
              • Hexion Inc. - Key offerings
            • 13.11 Huntsman Corporation
              • Huntsman Corporation - Overview
              • Huntsman Corporation - Product / Service
              • Huntsman Corporation - Key offerings
            • 13.12 Jubail Chemical Industries
              • Jubail Chemical Industries - Overview
              • Jubail Chemical Industries - Product / Service
              • Jubail Chemical Industries - Key offerings
            • 13.13 Kukdo Chemical
              • Kukdo Chemical - Overview
              • Kukdo Chemical - Product / Service
              • Kukdo Chemical - Key offerings
            • 13.14 Momentive Performance Materials
              • Momentive Performance Materials - Overview
              • Momentive Performance Materials - Product / Service
              • Momentive Performance Materials - Key offerings
            • 13.15 Nagase & Co.
              • Nagase & Co. - Overview
              • Nagase & Co. - Product / Service
              • Nagase & Co. - Key offerings
            • 13.16 Nan Ya Plastics
              • Nan Ya Plastics - Overview
              • Nan Ya Plastics - Product / Service
              • Nan Ya Plastics - Key offerings
            • 13.17 Olin Corporation
              • Olin Corporation - Overview
              • Olin Corporation - Product / Service
              • Olin Corporation - Key offerings
            • 13.18 PPG Industries
              • PPG Industries - Overview
              • PPG Industries - Product / Service
              • PPG Industries - Key offerings
            • 13.19 Sika AG
              • Sika AG - Overview
              • Sika AG - Product / Service
              • Sika AG - Key offerings
            • 13.20 Spolchemie
              • Spolchemie - Overview
              • Spolchemie - Product / Service
              • Spolchemie - Key offerings
            • 13.21 Sumitomo Chemical
              • Sumitomo Chemical - Overview
              • Sumitomo Chemical - Product / Service
              • Sumitomo Chemical - Key offerings
            • 13.22 Westlake Chemical
              • Westlake Chemical - Overview
              • Westlake Chemical - Product / Service
              • Westlake Chemical - Key offerings
            • 3M Co.
              • 3M Co. - Overview
              • 3M Co. - Product / Service
              • 3M Co. - Key offerings
            • 13.24 Aditya Birla Management Corp. Pvt. Ltd.
              • Aditya Birla Management Corp. Pvt. Ltd. - Overview
              • Aditya Birla Management Corp. Pvt. Ltd. - Product / Service
              • Aditya Birla Management Corp. Pvt. Ltd. - Key offerings
            • 13.25 Atul Ltd.
              • Atul Ltd. - Overview
              • Atul Ltd. - Product / Service
              • Atul Ltd. - Key offerings
            • 13.26 Chang Chun Group
              • Chang Chun Group - Overview
              • Chang Chun Group - Product / Service
              • Chang Chun Group - Key offerings
            • 13.27 China Petrochemical Corp.
              • China Petrochemical Corp. - Overview
              • China Petrochemical Corp. - Product / Service
              • China Petrochemical Corp. - Key offerings
            • 13.28 Daicel Corp.
              • Daicel Corp. - Overview
              • Daicel Corp. - Product / Service
              • Daicel Corp. - Key offerings
            • 13.29 DuPont de Nemours Inc.
              • DuPont de Nemours Inc. - Overview
              • DuPont de Nemours Inc. - Product / Service
              • DuPont de Nemours Inc. - Key offerings
            • 13.30 Hexion Inc.
              • Hexion Inc. - Overview
              • Hexion Inc. - Product / Service
              • Hexion Inc. - Key offerings
            • 13.31 Huntsman International LLC
              • Huntsman International LLC - Overview
              • Huntsman International LLC - Product / Service
              • Huntsman International LLC - Key offerings
            • 13.32 Kolon Industries Inc.
              • Kolon Industries Inc. - Overview
              • Kolon Industries Inc. - Product / Service
              • Kolon Industries Inc. - Key offerings
            • 13.33 Kukdo Chemical Co. Ltd.
              • Kukdo Chemical Co. Ltd. - Overview
              • Kukdo Chemical Co. Ltd. - Product / Service
              • Kukdo Chemical Co. Ltd. - Key offerings
            • 13.34 Nagase and Co. Ltd.
              • Nagase and Co. Ltd. - Overview
              • Nagase and Co. Ltd. - Product / Service
              • Nagase and Co. Ltd. - Key offerings
            • 13.35 NAMA Chemicals Co.
              • NAMA Chemicals Co. - Overview
              • NAMA Chemicals Co. - Product / Service
              • NAMA Chemicals Co. - Key offerings
            • 13.36 Nan Ya Plastic Corp.
              • Nan Ya Plastic Corp. - Overview
              • Nan Ya Plastic Corp. - Product / Service
              • Nan Ya Plastic Corp. - Key offerings
            • 13.37 Olin Corp.
              • Olin Corp. - Overview
              • Olin Corp. - Product / Service
              • Olin Corp. - Key offerings
            • 13.38 RAG Stiftung
              • RAG Stiftung - Overview
              • RAG Stiftung - Product / Service
              • RAG Stiftung - Key offerings
            • 13.39 Sika AG
              • Sika AG - Overview
              • Sika AG - Product / Service
              • Sika AG - Key offerings
            • 13.40 SIR INDUSTRIALE S.P.A.
              • SIR INDUSTRIALE S.P.A. - Overview
              • SIR INDUSTRIALE S.P.A. - Product / Service
              • SIR INDUSTRIALE S.P.A. - Key offerings
            • 13.41 Solvay SA
              • Solvay SA - Overview
              • Solvay SA - Product / Service
              • Solvay SA - Key offerings
            • 13.42 Spolchemie AS
              • Spolchemie AS - Overview
              • Spolchemie AS - Product / Service
              • Spolchemie AS - Key offerings

            13 Appendix

            • 13.1 Scope of the report
              • 13.2 Inclusions and exclusions checklist
                • Exhibit 187: Inclusions checklist
                • Exhibit 188: Exclusions checklist
              • 13.3 Currency conversion rates for US$
                • Exhibit 189: Currency conversion rates for US$
              • 13.4 Research methodology
                • Exhibit 190: Research methodology
                • Exhibit 191: Validation techniques employed for market sizing
                • Exhibit 192: Information sources
              • 13.5 List of abbreviations
                • Exhibit 193: List of abbreviations

              Research Methodology

              Technavio presents a detailed picture of the market by way of study, synthesis, and summation of data from multiple sources. The analysts have presented the various facets of the market with a particular focus on identifying the key industry influencers. The data thus presented is comprehensive, reliable, and the result of extensive research, both primary and secondary.

              INFORMATION SOURCES

              Primary sources

              • Manufacturers and suppliers
              • Channel partners
              • Industry experts
              • Strategic decision makers

              Secondary sources

              • Industry journals and periodicals
              • Government data
              • Financial reports of key industry players
              • Historical data
              • Press releases

              DATA ANALYSIS

              Data Synthesis

              • Collation of data
              • Estimation of key figures
              • Analysis of derived insights

              Data Validation

              • Triangulation with data models
              • Reference against proprietary databases
              • Corroboration with industry experts

              REPORT WRITING

              Qualitative

              • Market drivers
              • Market challenges
              • Market trends
              • Five forces analysis

              Quantitative

              • Market size and forecast
              • Market segmentation
              • Geographical insights
              • Competitive landscape

              Interested in this report?

              Get your sample now to see our research methodology and insights!

              Download Now

              Frequently Asked Questions

              Epoxy Resin market growth will increase by $ 5.18 bn during 2024-2028 .

              The Epoxy Resin market is expected to grow at a CAGR of 6.75% during 2024-2028 .

              Epoxy Resin market is segmented by Application( Paints and coatings, Adhesives and sealants, Composites, Electronic components, Others) End-user( Consumer goods, Building and construction, Wind energy, Others, MEA)

              Aditya Birla Chemicals, Allnex, BASF SE, Chang Chun Group, Cytec Industries (Solvay), DIC Corporation, Dow Inc., Hexion Inc., Huntsman Corporation, Jubail Chemical Industries, Kukdo Chemical, Momentive Performance Materials, Nagase & Co., Nan Ya Plastics, Olin Corporation, PPG Industries, Sika AG, Spolchemie, Sumitomo Chemical, Westlake Chemical are a few of the key vendors in the Epoxy Resin market.

              APAC will register the highest growth rate of 60% among the other regions. Therefore, the Epoxy Resin market in APAC is expected to garner significant business opportunities for the vendors during the forecast period.

              US, Canada, Germany, UK, Italy, France, China, India, Japan, Brazil, Egypt, UAE, Oman, Argentina, KSA, UAE, Brazil, Rest of World (ROW)

              • Increasing demand for paints and coatings in automotive industryIn the automotive industry is the driving factor this market.
              • paints and coatings are used for several applications. Due to their easy availability is the driving factor this market.
              • automotive paints and coatings are highly used in the automotive industry. The high durability is the driving factor this market.
              • superior gloss is the driving factor this market.
              • and cost-effectiveness of paints and coatings are major reasons for their use by automakers. Epoxy resin-based coatings provide high thermal stability and provide resistance to fire and high-temperature conditions. Acrylic- and epoxy-based enamels have long lifespans as they form a hard shell on surfaces once dried. Automotive OEMs widely prefer waterborne coatings. The adoption of strong is the driving factor this market.
              • safe is the driving factor this market.
              • light is the driving factor this market.
              • and fuel-efficient vehicles is expected to rise significantly during the forecast period. The automotive sector in the developed nations of various regions is the driving factor this market.
              • particularly in North America and Europe is the driving factor this market.
              • is witnessing rapid technological advances. Automobile manufacturers in North America have remained early adopters of technology is the driving factor this market.
              • spurred by evolving consumer requirements is the driving factor this market.
              • and the region has witnessed extensive product development activities. Moreover is the driving factor this market.
              • high per capita income and improved living standards in the region enable consumers to afford new technological developments and their incorporation. Therefore is the driving factor this market.
              • growing consumer purchasing power will push urban commuters to purchase vehicles is the driving factor this market.
              • which will drive the growth of the automotive industry in developing countries such as India and China. Such factors will drive the demand for paints and coatings is the driving factor this market.
              • which is the driving factor this market.
              • in turn is the driving factor this market.
              • is expected to drive the global epoxy resin market during the forecast period. is the driving factor this market.

              The Epoxy Resin market vendors should focus on grabbing business opportunities from the Paints and coatings segment as it accounted for the largest market share in the base year.