Automotive Subscription Services Market Analysis, Size, and Forecast 2026-2030: North America (US, Canada, and Mexico), Europe (Germany, UK, and France), APAC (China, Japan, and South Korea), South America (Brazil and Argentina), Middle East and Africa (Saudi Arabia, UAE, and South Africa), and Rest of World (ROW)

Automotive Subscription Services Market Analysis, Size, and Forecast 2026-2030:
North America (US, Canada, and Mexico), Europe (Germany, UK, and France), APAC (China, Japan, and South Korea), South America (Brazil and Argentina), Middle East and Africa (Saudi Arabia, UAE, and South Africa), and Rest of World (ROW)

Published: Mar 2026 286 Pages SKU: IRTNTR41296

Market Overview at a Glance

$4.43 B
Market Opportunity
17.3%
CAGR 2025 - 2030
48.3%
North America Growth
$2.19 B
OEMs segment 2024

Automotive Subscription Services Market Size 2026-2030

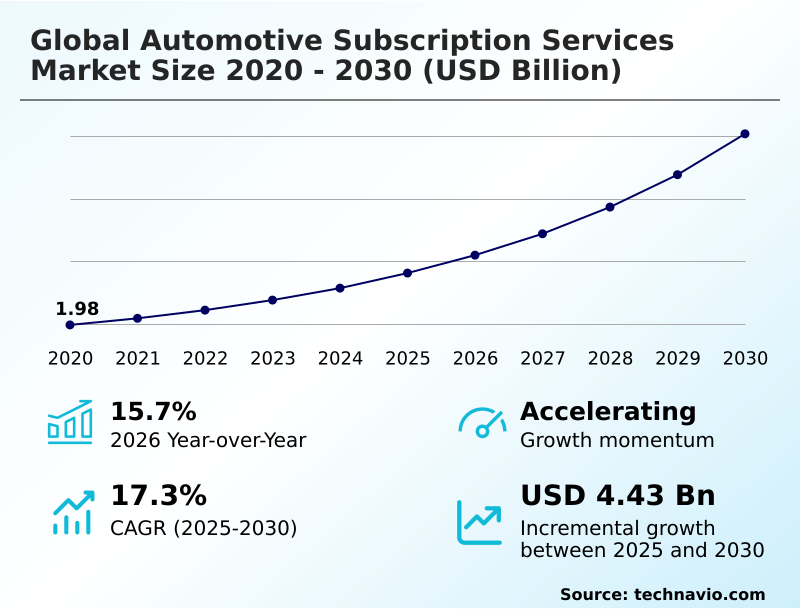
The automotive subscription services market size is valued to increase by USD 4.43 billion, at a CAGR of 17.3% from 2025 to 2030. Paradigm shift from asset ownership toward flexible usership models will drive the automotive subscription services market.

Major Market Trends & Insights

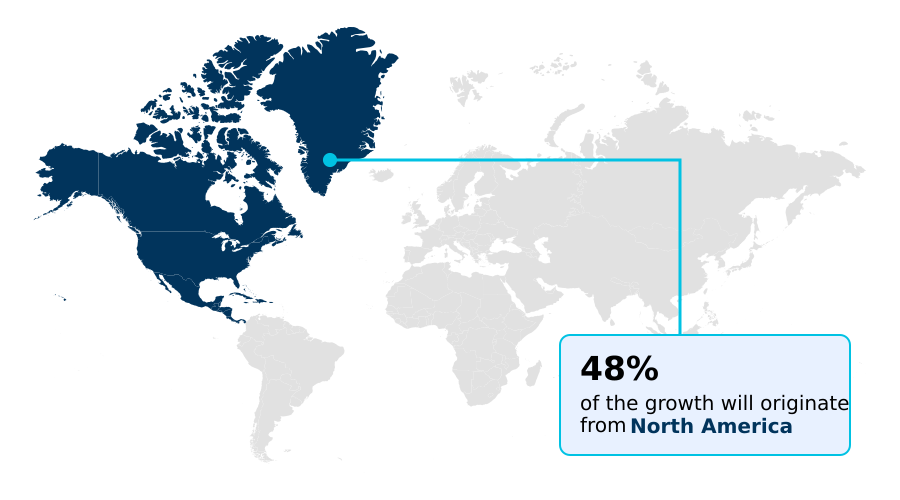
  • North America dominated the market and accounted for a 48.3% growth during the forecast period.
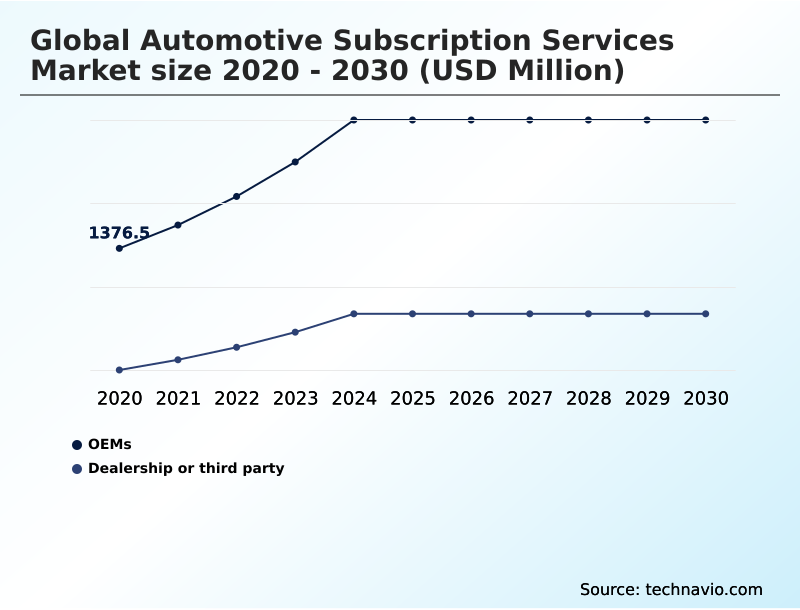
  • By Distribution Channel - OEMs segment was valued at USD 2.19 billion in 2024
  • By Type - Multi-brand subscriptions segment accounted for the largest market revenue share in 2024

Market Size & Forecast

  • Market Opportunities: USD 6.08 billion
  • Market Future Opportunities: USD 4.43 billion
  • CAGR from 2025 to 2030 : 17.3%

Market Summary

  • The automotive subscription services market represents a fundamental transformation in personal and corporate mobility, pivoting from traditional ownership to flexible, usage-based models. This evolution is driven by a consumer preference for convenience, where an all-inclusive monthly payment covers insurance, maintenance, and other associated costs, facilitated by seamless digital onboarding and app-based vehicle management.
  • A key trend accelerating this shift is the rise of the software-defined vehicle, which allows for functions-on-demand and over-the-air updates, creating new recurring revenue streams.
  • For instance, a logistics company can dynamically scale its delivery fleet for peak seasons using a corporate car subscription service, leveraging telematics data to optimize routes and monitor vehicle health, thereby enhancing operational efficiency without long-term capital expenditure.
  • However, the industry grapples with significant challenges, including managing the residual value risk of rapidly advancing electric vehicle fleets and the operational complexity of maintaining high vehicle utilization rates across geographically dispersed user bases.

What will be the Size of the Automotive Subscription Services Market during the forecast period?

Get Key Insights on Market Forecast (PDF) Request Free Sample

How is the Automotive Subscription Services Market Segmented?

The automotive subscription services industry research report provides comprehensive data (region-wise segment analysis), with forecasts and estimates in "USD million" for the period 2026-2030, as well as historical data from 2020-2024 for the following segments.

  • Distribution channel
    • OEMs
    • Dealership or third party
  • Type
    • Multi-brand subscriptions
    • Single-brand subscriptions
  • End-user
    • Individual
    • Business
  • Geography
    • North America
      • US
      • Canada
      • Mexico
    • Europe
      • Germany
      • UK
      • France
    • APAC
      • China
      • Japan
      • South Korea
    • South America
      • Brazil
      • Argentina
    • Middle East and Africa
      • Saudi Arabia
      • UAE
      • South Africa
    • Rest of World (ROW)

By Distribution Channel Insights

The oems segment is estimated to witness significant growth during the forecast period.

The Original Equipment Manufacturers (OEMs) segment is foundational, representing a strategic shift from transactional sales to recurring service-oriented revenue streams. This channel enables direct-to-consumer models, allowing brands to cultivate customer lifetime value with younger, asset-light demographics.

By offering all-inclusive pricing and digital subscription tiers, OEMs lower entry barriers for premium and electric vehicles. These electric vehicle experience programs serve as a low-risk gateway for consumers.

This model's success is tied to a seamless digital onboarding process and the ability to manage vehicle lifecycle management effectively.

Data confirms this pivot, with some OEMs reporting a 24% increase in software-based revenue driven by commercial telematics data and fleet management software, transforming the car into a dynamic, software-defined vehicle.

Request Free Sample

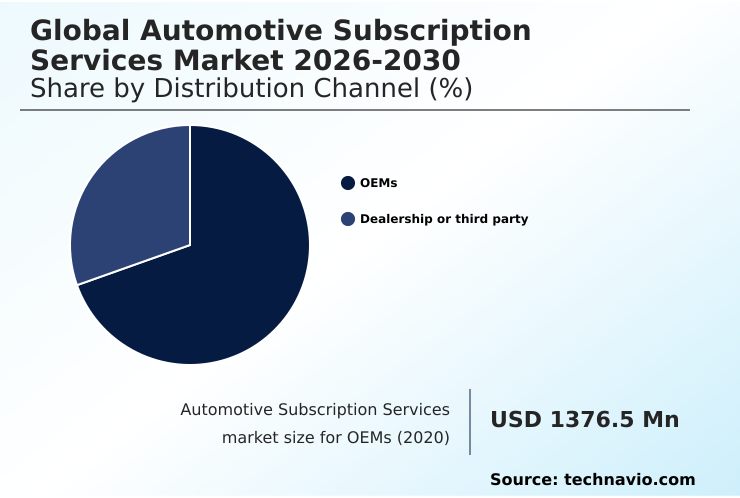
The OEMs segment was valued at USD 2.19 billion in 2024 and showed a gradual increase during the forecast period.

Request Free Sample

Regional Analysis

North America is estimated to contribute 48.3% to the growth of the global market during the forecast period.Technavio’s analysts have elaborately explained the regional trends and drivers that shape the market during the forecast period.

See How Automotive Subscription Services Market Demand is Rising in North America Request Free Sample

The geographic landscape is led by North America, which captures nearly half the market's incremental growth, driven by consumer demand for on-demand transportation and asset-light mobility. This region benefits from a mature ecosystem of third-party providers offering vehicle swap services.

Conversely, the APAC region is the fastest-growing geography, with a projected growth rate almost 20% higher than Europe's, fueled by rapid urbanization and a digitally native consumer base.

This expansion is supported by marketplace-based car subscriptions and a strong interest in commercial vehicle subscriptions.

The adoption of advanced driver assistance systems and EV charging solutions is a key factor across all developed regions, with data-driven personalization becoming a competitive differentiator.

Market Dynamics

Our researchers analyzed the data with 2025 as the base year, along with the key drivers, trends, and challenges. A holistic analysis of drivers will help companies refine their marketing strategies to gain a competitive advantage.

  • Understanding the automotive subscription services market growth requires a comprehensive look at its business model canvas. For entrepreneurs asking how to start a car subscription business, the initial focus must be on securing capital for fleet acquisition and developing software for managing vehicle subscriptions.
  • A key decision involves choosing between an OEM-backed service and finding the best multi-brand automotive subscription, which often involves comparing OEM vs third-party car subscriptions. The rise of specialized niches, such as automotive subscription services for gig workers and automotive subscription services for startups, presents unique opportunities.
  • Financial viability hinges on managing depreciation, leading many to seek residual value insurance for subscription fleets. Moreover, using telematics for subscription pricing models is becoming critical for profitability, while effective customer retention strategies for car subscriptions are essential for long-term success.
  • Operators must also consider the tax implications of business car subscriptions and the complexities of integrating EV charging into subscription packages. The benefits of car subscription over leasing are clear, but providers offering an all-inclusive car subscription with no deposit face higher risk.
  • Emerging trends include luxury car subscription with driver service and the logistical challenges of cross-border car subscription services, all while navigating data privacy in vehicle subscription apps and managing fleet maintenance for subscriptions. Addressing cybersecurity risks in connected car subscriptions remains a paramount concern for all stakeholders.
  • Platforms that integrate telematics for subscription pricing models have demonstrated an ability to reduce unauthorized vehicle use by more than 15% compared to those with fixed-rate plans.

What are the key market drivers leading to the rise in the adoption of Automotive Subscription Services Industry?

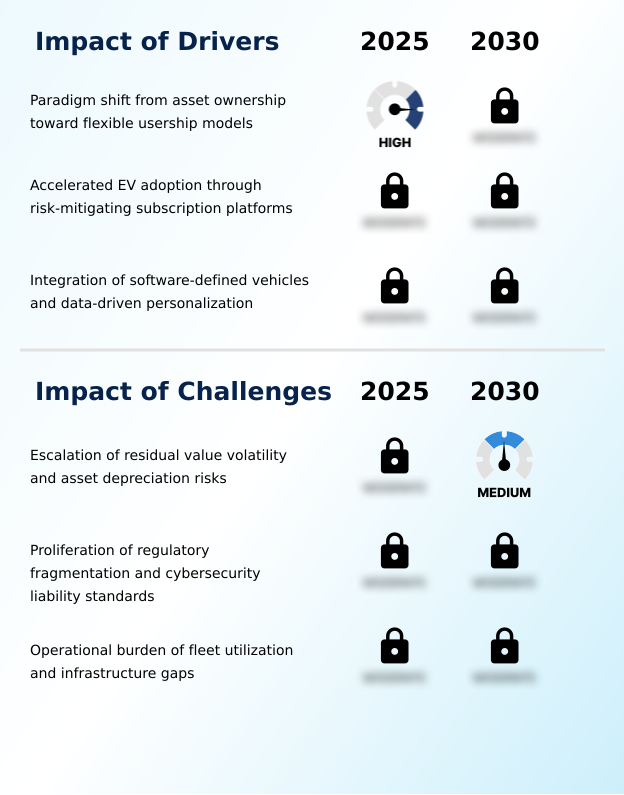
  • A key market driver is the fundamental paradigm shift from traditional asset ownership toward flexible, access-based usership models.

  • A fundamental driver is the consumer shift toward flexible vehicle access, moving away from long-term financial commitments. This has spurred the growth of both OEM-led direct-to-consumer models and multi-brand vehicle access platforms.
  • The all-inclusive monthly payment structure, bundling car subscription insurance and maintenance, simplifies budgeting for users.
  • Subscription models also serve as a critical tool for fleet electrification, lowering EV adoption barriers; some providers report that over 25% of users who trial an EV via subscription subsequently purchase one.
  • The adoption of app-based vehicle management and digital key access streamlines the user experience, boosting customer lifetime value and making on-demand transportation a practical reality for a wider audience.

What are the market trends shaping the Automotive Subscription Services Industry?

  • A defining market trend is the integration of software-defined vehicle features. This shift is enabling the creation of digital subscription tiers for on-demand functionalities and services.

  • The market is structurally realigning toward digital-first offerings, where the physical asset is secondary to the services it enables. A key trend is the growth of functions-on-demand, where capabilities like advanced infotainment content are unlocked via recurring billing. This user-centric mobility approach is enhanced by seamless digital onboarding processes.
  • For instance, some providers have doubled their software-based revenue year-over-year by focusing on commercial telematics. This pivot to a subscription-based model is particularly effective for subscription fleet electrification, with some European markets seeing battery-electric vehicles, often introduced through subscriptions, achieve nearly 20% of new registrations. This strategy relies on effective vehicle lifecycle management and robust connected services to succeed.

What challenges does the Automotive Subscription Services Industry face during its growth?

  • A primary challenge affecting industry growth is the escalating volatility of residual values and the associated risks of asset depreciation for fleet operators.

  • The market faces significant operational and financial challenges. The primary issue is managing residual value risk, as the accelerated asset depreciation of early-model EVs can result in losses exceeding 40% of the initial value within two years.
  • Another hurdle is the high cost associated with vehicle utilization; logistical expenses for cleaning and delivering vehicles can account for up to 15% of the monthly subscription fee, eroding margins. This is compounded by cybersecurity liability in software-defined vehicles and the complexity of remarketing used vehicle subscription fleets.
  • These factors create economic friction, forcing providers to build significant risk premiums into their dynamic pricing models.

Exclusive Technavio Analysis on Customer Landscape

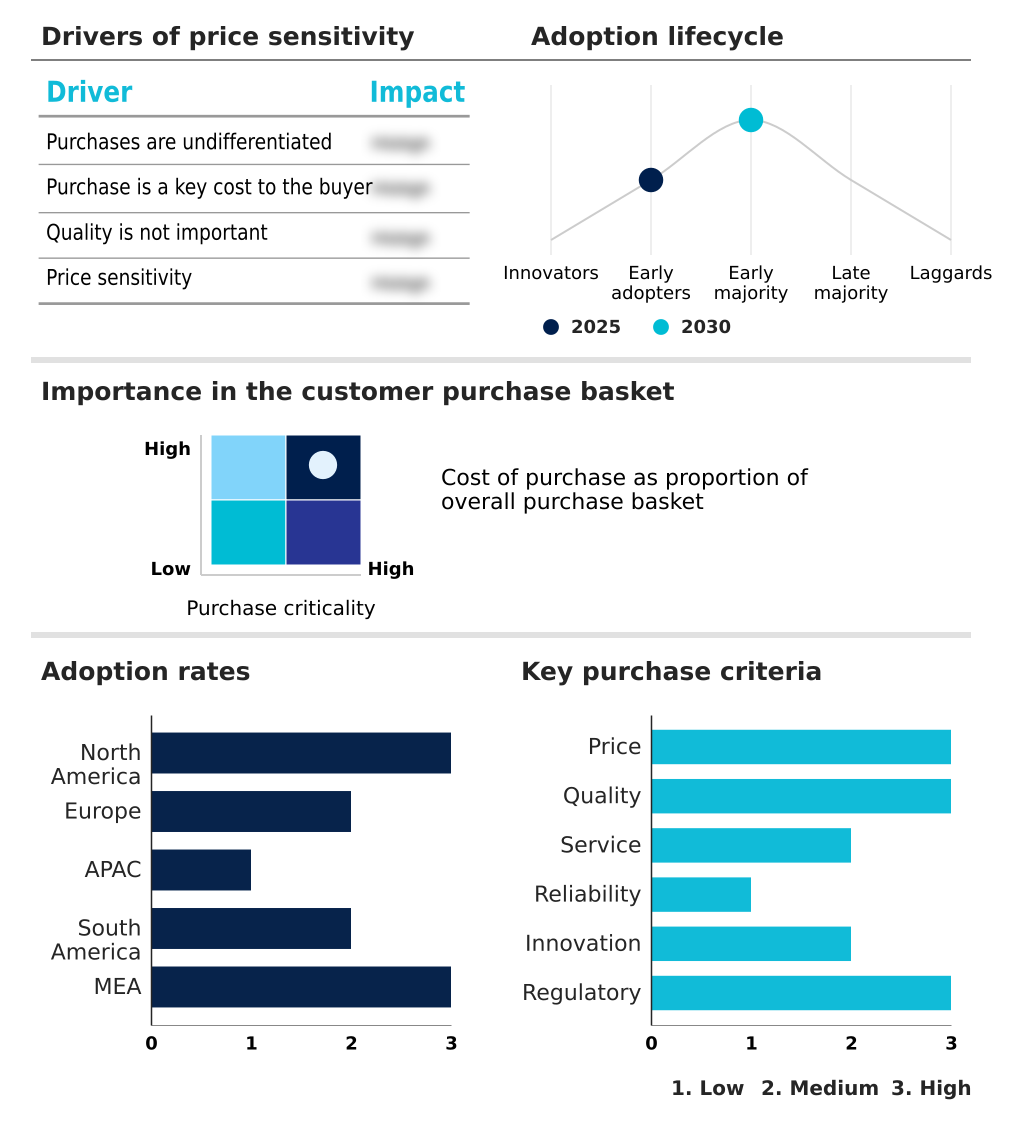
The automotive subscription services market forecasting report includes the adoption lifecycle of the market, covering from the innovator’s stage to the laggard’s stage. It focuses on adoption rates in different regions based on penetration. Furthermore, the automotive subscription services market report also includes key purchase criteria and drivers of price sensitivity to help companies evaluate and develop their market growth analysis strategies.

Customer Landscape of Automotive Subscription Services Industry

Competitive Landscape

Companies are implementing various strategies, such as strategic alliances, automotive subscription services market forecast, partnerships, mergers and acquisitions, geographical expansion, and product/service launches, to enhance their presence in the industry.

Audi of America - Provides flexible, all-inclusive premium vehicle access through subscription models, bundling insurance and maintenance to streamline user mobility and reduce ownership costs.

The industry research and growth report includes detailed analyses of the competitive landscape of the market and information about key companies, including:

  • Audi of America
  • Autonomy
  • BMW of North America LLC
  • Cadillac
  • Cazoo Ltd.
  • Dr. Ing. h.c. F. Porsche AG
  • Electric Road
  • Finn.auto
  • FlexClub
  • Ford Motor Co.
  • Hyundai Motor Co.
  • KIA CORP.
  • Lexus
  • Loopit
  • Mercedes Benz USA LLC
  • Renault SAS
  • SIXT SE
  • Stellantis NV
  • Wagonex Ltd

Qualitative and quantitative analysis of companies has been conducted to help clients understand the wider business environment as well as the strengths and weaknesses of key industry players. Data is qualitatively analyzed to categorize companies as pure play, category-focused, industry-focused, and diversified; it is quantitatively analyzed to categorize companies as dominant, leading, strong, tentative, and weak.

Recent Development and News in Automotive subscription services market

  • In March, 2025, SIXT SE announced a record fiscal year for 2024, attributed to the successful global expansion of its SIXT Plus subscription platform and the rollout of its SIXT ONE digital ecosystem, which enhances fleet management across North America and Europe.
  • In February, 2025, The European Union initiated new data frameworks to formalize protocols for sharing and commercializing connected vehicle data, creating significant compliance complexities for providers of cross-border subscription services.
  • In October, 2024, Volvo Cars reaffirmed its long-term strategic commitment to its Care by Volvo platform, highlighting the integration of its newest fully electric models to accelerate EV adoption among urban professionals.
  • In September, 2024, Stellantis NV initiated a strategic business reset to better align its vehicle fleet availability with shifting consumer demand for hybrids and advanced internal combustion engines within its subscription and sales channels.

Dive into Technavio’s robust research methodology, blending expert interviews, extensive data synthesis, and validated models for unparalleled Automotive Subscription Services Market insights. See full methodology.

Market Scope
Page number 286
Base year 2025
Historic period 2020-2024
Forecast period 2026-2030
Growth momentum & CAGR Accelerate at a CAGR of 17.3%
Market growth 2026-2030 USD 4430.2 million
Market structure Fragmented
YoY growth 2025-2026(%) 15.7%
Key countries US, Canada, Mexico, Germany, UK, France, Italy, Spain, The Netherlands, China, Japan, South Korea, India, Australia, Indonesia, Brazil, Argentina, Chile, Saudi Arabia, UAE, South Africa, Israel and Turkey
Competitive landscape Leading Companies, Market Positioning of Companies, Competitive Strategies, and Industry Risks

Request Free Sample

Research Analyst Overview

  • The market's evolution is defined by the convergence of the software-defined vehicle and new business structures. Original equipment manufacturers and third-party providers are leveraging a SaaS platform approach to offer digital subscription tiers with all-inclusive pricing.
  • This is enabled by connected car technologies that provide a constant stream of telematics data, which is crucial for predictive maintenance, data-driven personalization, and creating dynamic pricing models. The concept of functions-on-demand, delivered via over-the-air updates for infotainment content and advanced driver assistance systems, is central to this shift.
  • This creates a system of recurring billing and fundamentally alters vehicle lifecycle management. While mobility-as-a-service and multi-modal mobility are expanding the service scope with concierge services and EV charging solutions, significant hurdles remain. Firms must manage asset depreciation and residual value through effective remarketing to maintain high vehicle utilization.
  • Furthermore, the increasing reliance on connected services introduces significant cybersecurity liability, a boardroom-level concern. The deployment of over-the-air updates to millions of vehicles has demonstrated a significant increase in customer engagement, with feature adoption rates climbing by over 30% post-update.
  • This move toward fleet electrification through electric vehicle experience programs, managed via white-label technology platform and app-based vehicle management with digital key access and seamless digital onboarding, is reshaping the industry.

What are the Key Data Covered in this Automotive Subscription Services Market Research and Growth Report?

  • What is the expected growth of the Automotive Subscription Services Market between 2026 and 2030?

    • USD 4.43 billion, at a CAGR of 17.3%

  • What segmentation does the market report cover?

    • The report is segmented by Distribution Channel (OEMs, and Dealership or third party), Type (Multi-brand subscriptions, and Single-brand subscriptions), End-user (Individual, and Business) and Geography (North America, Europe, APAC, South America, Middle East and Africa)

  • Which regions are analyzed in the report?

    • North America, Europe, APAC, South America and Middle East and Africa

  • What are the key growth drivers and market challenges?

    • Paradigm shift from asset ownership toward flexible usership models, Escalation of residual value volatility and asset depreciation risks

  • Who are the major players in the Automotive Subscription Services Market?

    • Audi of America, Autonomy, BMW of North America LLC, Cadillac, Cazoo Ltd., Dr. Ing. h.c. F. Porsche AG, Electric Road, Finn.auto, FlexClub, Ford Motor Co., Hyundai Motor Co., KIA CORP., Lexus, Loopit, Mercedes Benz USA LLC, Renault SAS, SIXT SE, Stellantis NV and Wagonex Ltd

Market Research Insights

  • The market's dynamism is rooted in the shift toward user-centric mobility, where flexible vehicle access and all-inclusive monthly payments are standard. This subscription-based model appeals to consumers seeking alternatives to car subscription vs leasing, driven by a desire for no-commitment car access. The competitive environment is pushing providers to innovate with offerings like drive-to-buy financing and specialized corporate car subscriptions.
  • This evolution is delivering tangible results; commercial operators using subscription fleet electrification report software-related revenue increases of over 20%. Furthermore, in certain mature markets, EV-focused car subscriptions now account for nearly one-fifth of new battery-electric vehicle registrations, demonstrating the model's effectiveness in lowering adoption barriers.

We can help! Our analysts can customize this automotive subscription services market research report to meet your requirements.

Get in touch

1. Executive Summary

1.1 Market overview

Executive Summary - Chart on Market Overview
Executive Summary - Data Table on Market Overview
Executive Summary - Chart on Global Market Characteristics
Executive Summary - Chart on Market by Geography
Executive Summary - Chart on Market Segmentation by Distribution Channel
Executive Summary - Chart on Market Segmentation by Type
Executive Summary - Chart on Market Segmentation by End-user
Executive Summary - Chart on Incremental Growth
Executive Summary - Data Table on Incremental Growth
Executive Summary - Chart on Company Market Positioning

2. Technavio Analysis

2.1 Analysis of price sensitivity, lifecycle, customer purchase basket, adoption rates, and purchase criteria

2.2 Criticality of inputs and Factors of differentiation

Chart on Overview on criticality of inputs and factors of differentiation

2.3 Factors of disruption

Chart on Overview on factors of disruption

2.4 Impact of drivers and challenges

Chart on Impact of drivers and challenges in 2025 and 2030

3. Market Landscape

3.1 Market ecosystem

Chart on Parent Market
Data Table on - Parent Market

3.2 Market characteristics

Chart on Market characteristics analysis

3.3 Value chain analysis

Chart on Value chain analysis

4. Market Sizing

4.1 Market definition

Data Table on Offerings of companies included in the market definition

4.2 Market segment analysis

Market segments

4.3 Market size 2025

4.4 Market outlook: Forecast for 2025-2030

Chart on Global - Market size and forecast 2025-2030 ($ million)
Data Table on Global - Market size and forecast 2025-2030 ($ million)
Chart on Global Market: Year-over-year growth 2025-2030 (%)
Data Table on Global Market: Year-over-year growth 2025-2030 (%)

5. Historic Market Size

5.1 Global Automotive Subscription Services Market 2020 - 2024

Historic Market Size - Data Table on Global Automotive Subscription Services Market 2020 - 2024 ($ million)

5.2 Distribution Channel segment analysis 2020 - 2024

Historic Market Size - Distribution Channel Segment 2020 - 2024 ($ million)

5.3 Type segment analysis 2020 - 2024

Historic Market Size - Type Segment 2020 - 2024 ($ million)

5.4 End-user segment analysis 2020 - 2024

Historic Market Size - End-user Segment 2020 - 2024 ($ million)

5.5 Geography segment analysis 2020 - 2024

Historic Market Size - Geography Segment 2020 - 2024 ($ million)

5.6 Country segment analysis 2020 - 2024

Historic Market Size - Country Segment 2020 - 2024 ($ million)

6. Qualitative Analysis

6.1 Impact of AI in global automotive subscription services market

6.2 Impact of geopolitical conflict for global automotive subscription services market

7. Five Forces Analysis

7.1 Five forces summary

Five forces analysis - Comparison between 2025 and 2030

7.2 Bargaining power of buyers

Bargaining power of buyers - Impact of key factors 2025 and 2030

7.3 Bargaining power of suppliers

Bargaining power of suppliers - Impact of key factors in 2025 and 2030

7.4 Threat of new entrants

Threat of new entrants - Impact of key factors in 2025 and 2030

7.5 Threat of substitutes

Threat of substitutes - Impact of key factors in 2025 and 2030

7.6 Threat of rivalry

Threat of rivalry - Impact of key factors in 2025 and 2030

7.7 Market condition

Chart on Market condition - Five forces 2025 and 2030

8. Market Segmentation by Distribution Channel

8.1 Market segments

Chart on Distribution Channel - Market share 2025-2030 (%)
Data Table on Distribution Channel - Market share 2025-2030 (%)

8.2 Comparison by Distribution Channel

Chart on Comparison by Distribution Channel
Data Table on Comparison by Distribution Channel

8.3 OEMs - Market size and forecast 2025-2030

Chart on OEMs - Market size and forecast 2025-2030 ($ million)
Data Table on OEMs - Market size and forecast 2025-2030 ($ million)
Chart on OEMs - Year-over-year growth 2025-2030 (%)
Data Table on OEMs - Year-over-year growth 2025-2030 (%)

8.4 Dealership or third party - Market size and forecast 2025-2030

Chart on Dealership or third party - Market size and forecast 2025-2030 ($ million)
Data Table on Dealership or third party - Market size and forecast 2025-2030 ($ million)
Chart on Dealership or third party - Year-over-year growth 2025-2030 (%)
Data Table on Dealership or third party - Year-over-year growth 2025-2030 (%)

8.5 Market opportunity by Distribution Channel

Market opportunity by Distribution Channel ($ million)
Data Table on Market opportunity by Distribution Channel ($ million)

9. Market Segmentation by Type

9.1 Market segments

Chart on Type - Market share 2025-2030 (%)
Data Table on Type - Market share 2025-2030 (%)

9.2 Comparison by Type

Chart on Comparison by Type
Data Table on Comparison by Type

9.3 Multi-brand subscriptions - Market size and forecast 2025-2030

Chart on Multi-brand subscriptions - Market size and forecast 2025-2030 ($ million)
Data Table on Multi-brand subscriptions - Market size and forecast 2025-2030 ($ million)
Chart on Multi-brand subscriptions - Year-over-year growth 2025-2030 (%)
Data Table on Multi-brand subscriptions - Year-over-year growth 2025-2030 (%)

9.4 Single-brand subscriptions - Market size and forecast 2025-2030

Chart on Single-brand subscriptions - Market size and forecast 2025-2030 ($ million)
Data Table on Single-brand subscriptions - Market size and forecast 2025-2030 ($ million)
Chart on Single-brand subscriptions - Year-over-year growth 2025-2030 (%)
Data Table on Single-brand subscriptions - Year-over-year growth 2025-2030 (%)

9.5 Market opportunity by Type

Market opportunity by Type ($ million)
Data Table on Market opportunity by Type ($ million)

10. Market Segmentation by End-user

10.1 Market segments

Chart on End-user - Market share 2025-2030 (%)
Data Table on End-user - Market share 2025-2030 (%)

10.2 Comparison by End-user

Chart on Comparison by End-user
Data Table on Comparison by End-user

10.3 Individual - Market size and forecast 2025-2030

Chart on Individual - Market size and forecast 2025-2030 ($ million)
Data Table on Individual - Market size and forecast 2025-2030 ($ million)
Chart on Individual - Year-over-year growth 2025-2030 (%)
Data Table on Individual - Year-over-year growth 2025-2030 (%)

10.4 Business - Market size and forecast 2025-2030

Chart on Business - Market size and forecast 2025-2030 ($ million)
Data Table on Business - Market size and forecast 2025-2030 ($ million)
Chart on Business - Year-over-year growth 2025-2030 (%)
Data Table on Business - Year-over-year growth 2025-2030 (%)

10.5 Market opportunity by End-user

Market opportunity by End-user ($ million)
Data Table on Market opportunity by End-user ($ million)

11. Customer Landscape

11.1 Customer landscape overview

Analysis of price sensitivity, lifecycle, customer purchase basket, adoption rates, and purchase criteria

12. Geographic Landscape

12.1 Geographic segmentation

Chart on Market share by geography 2025-2030 (%)
Data Table on Market share by geography 2025-2030 (%)

12.2 Geographic comparison

Chart on Geographic comparison
Data Table on Geographic comparison

12.3 North America - Market size and forecast 2025-2030

Chart on North America - Market size and forecast 2025-2030 ($ million)
Data Table on North America - Market size and forecast 2025-2030 ($ million)
Chart on North America - Year-over-year growth 2025-2030 (%)
Data Table on North America - Year-over-year growth 2025-2030 (%)
Chart on Regional Comparison - North America
Data Table on Regional Comparison - North America

12.3.1 US - Market size and forecast 2025-2030

Chart on US - Market size and forecast 2025-2030 ($ million)
Data Table on US - Market size and forecast 2025-2030 ($ million)
Chart on US - Year-over-year growth 2025-2030 (%)
Data Table on US - Year-over-year growth 2025-2030 (%)

12.3.2 Canada - Market size and forecast 2025-2030

Chart on Canada - Market size and forecast 2025-2030 ($ million)
Data Table on Canada - Market size and forecast 2025-2030 ($ million)
Chart on Canada - Year-over-year growth 2025-2030 (%)
Data Table on Canada - Year-over-year growth 2025-2030 (%)

12.3.3 Mexico - Market size and forecast 2025-2030

Chart on Mexico - Market size and forecast 2025-2030 ($ million)
Data Table on Mexico - Market size and forecast 2025-2030 ($ million)
Chart on Mexico - Year-over-year growth 2025-2030 (%)
Data Table on Mexico - Year-over-year growth 2025-2030 (%)

12.4 Europe - Market size and forecast 2025-2030

Chart on Europe - Market size and forecast 2025-2030 ($ million)
Data Table on Europe - Market size and forecast 2025-2030 ($ million)
Chart on Europe - Year-over-year growth 2025-2030 (%)
Data Table on Europe - Year-over-year growth 2025-2030 (%)
Chart on Regional Comparison - Europe
Data Table on Regional Comparison - Europe

12.4.1 Germany - Market size and forecast 2025-2030

Chart on Germany - Market size and forecast 2025-2030 ($ million)
Data Table on Germany - Market size and forecast 2025-2030 ($ million)
Chart on Germany - Year-over-year growth 2025-2030 (%)
Data Table on Germany - Year-over-year growth 2025-2030 (%)

12.4.2 UK - Market size and forecast 2025-2030

Chart on UK - Market size and forecast 2025-2030 ($ million)
Data Table on UK - Market size and forecast 2025-2030 ($ million)
Chart on UK - Year-over-year growth 2025-2030 (%)
Data Table on UK - Year-over-year growth 2025-2030 (%)

12.4.3 France - Market size and forecast 2025-2030

Chart on France - Market size and forecast 2025-2030 ($ million)
Data Table on France - Market size and forecast 2025-2030 ($ million)
Chart on France - Year-over-year growth 2025-2030 (%)
Data Table on France - Year-over-year growth 2025-2030 (%)

12.4.4 Italy - Market size and forecast 2025-2030

Chart on Italy - Market size and forecast 2025-2030 ($ million)
Data Table on Italy - Market size and forecast 2025-2030 ($ million)
Chart on Italy - Year-over-year growth 2025-2030 (%)
Data Table on Italy - Year-over-year growth 2025-2030 (%)

12.4.5 Spain - Market size and forecast 2025-2030

Chart on Spain - Market size and forecast 2025-2030 ($ million)
Data Table on Spain - Market size and forecast 2025-2030 ($ million)
Chart on Spain - Year-over-year growth 2025-2030 (%)
Data Table on Spain - Year-over-year growth 2025-2030 (%)

12.4.6 The Netherlands - Market size and forecast 2025-2030

Chart on The Netherlands - Market size and forecast 2025-2030 ($ million)
Data Table on The Netherlands - Market size and forecast 2025-2030 ($ million)
Chart on The Netherlands - Year-over-year growth 2025-2030 (%)
Data Table on The Netherlands - Year-over-year growth 2025-2030 (%)

12.5 APAC - Market size and forecast 2025-2030

Chart on APAC - Market size and forecast 2025-2030 ($ million)
Data Table on APAC - Market size and forecast 2025-2030 ($ million)
Chart on APAC - Year-over-year growth 2025-2030 (%)
Data Table on APAC - Year-over-year growth 2025-2030 (%)
Chart on Regional Comparison - APAC
Data Table on Regional Comparison - APAC

12.5.1 China - Market size and forecast 2025-2030

Chart on China - Market size and forecast 2025-2030 ($ million)
Data Table on China - Market size and forecast 2025-2030 ($ million)
Chart on China - Year-over-year growth 2025-2030 (%)
Data Table on China - Year-over-year growth 2025-2030 (%)

12.5.2 Japan - Market size and forecast 2025-2030

Chart on Japan - Market size and forecast 2025-2030 ($ million)
Data Table on Japan - Market size and forecast 2025-2030 ($ million)
Chart on Japan - Year-over-year growth 2025-2030 (%)
Data Table on Japan - Year-over-year growth 2025-2030 (%)

12.5.3 South Korea - Market size and forecast 2025-2030

Chart on South Korea - Market size and forecast 2025-2030 ($ million)
Data Table on South Korea - Market size and forecast 2025-2030 ($ million)
Chart on South Korea - Year-over-year growth 2025-2030 (%)
Data Table on South Korea - Year-over-year growth 2025-2030 (%)

12.5.4 India - Market size and forecast 2025-2030

Chart on India - Market size and forecast 2025-2030 ($ million)
Data Table on India - Market size and forecast 2025-2030 ($ million)
Chart on India - Year-over-year growth 2025-2030 (%)
Data Table on India - Year-over-year growth 2025-2030 (%)

12.5.5 Australia - Market size and forecast 2025-2030

Chart on Australia - Market size and forecast 2025-2030 ($ million)
Data Table on Australia - Market size and forecast 2025-2030 ($ million)
Chart on Australia - Year-over-year growth 2025-2030 (%)
Data Table on Australia - Year-over-year growth 2025-2030 (%)

12.5.6 Indonesia - Market size and forecast 2025-2030

Chart on Indonesia - Market size and forecast 2025-2030 ($ million)
Data Table on Indonesia - Market size and forecast 2025-2030 ($ million)
Chart on Indonesia - Year-over-year growth 2025-2030 (%)
Data Table on Indonesia - Year-over-year growth 2025-2030 (%)

12.6 South America - Market size and forecast 2025-2030

Chart on South America - Market size and forecast 2025-2030 ($ million)
Data Table on South America - Market size and forecast 2025-2030 ($ million)
Chart on South America - Year-over-year growth 2025-2030 (%)
Data Table on South America - Year-over-year growth 2025-2030 (%)
Chart on Regional Comparison - South America
Data Table on Regional Comparison - South America

12.6.1 Brazil - Market size and forecast 2025-2030

Chart on Brazil - Market size and forecast 2025-2030 ($ million)
Data Table on Brazil - Market size and forecast 2025-2030 ($ million)
Chart on Brazil - Year-over-year growth 2025-2030 (%)
Data Table on Brazil - Year-over-year growth 2025-2030 (%)

12.6.2 Argentina - Market size and forecast 2025-2030

Chart on Argentina - Market size and forecast 2025-2030 ($ million)
Data Table on Argentina - Market size and forecast 2025-2030 ($ million)
Chart on Argentina - Year-over-year growth 2025-2030 (%)
Data Table on Argentina - Year-over-year growth 2025-2030 (%)

12.6.3 Chile - Market size and forecast 2025-2030

Chart on Chile - Market size and forecast 2025-2030 ($ million)
Data Table on Chile - Market size and forecast 2025-2030 ($ million)
Chart on Chile - Year-over-year growth 2025-2030 (%)
Data Table on Chile - Year-over-year growth 2025-2030 (%)

12.7 Middle East and Africa - Market size and forecast 2025-2030

Chart on Middle East and Africa - Market size and forecast 2025-2030 ($ million)
Data Table on Middle East and Africa - Market size and forecast 2025-2030 ($ million)
Chart on Middle East and Africa - Year-over-year growth 2025-2030 (%)
Data Table on Middle East and Africa - Year-over-year growth 2025-2030 (%)
Chart on Regional Comparison - Middle East and Africa
Data Table on Regional Comparison - Middle East and Africa

12.7.1 Saudi Arabia - Market size and forecast 2025-2030

Chart on Saudi Arabia - Market size and forecast 2025-2030 ($ million)
Data Table on Saudi Arabia - Market size and forecast 2025-2030 ($ million)
Chart on Saudi Arabia - Year-over-year growth 2025-2030 (%)
Data Table on Saudi Arabia - Year-over-year growth 2025-2030 (%)

12.7.2 UAE - Market size and forecast 2025-2030

Chart on UAE - Market size and forecast 2025-2030 ($ million)
Data Table on UAE - Market size and forecast 2025-2030 ($ million)
Chart on UAE - Year-over-year growth 2025-2030 (%)
Data Table on UAE - Year-over-year growth 2025-2030 (%)

12.7.3 South Africa - Market size and forecast 2025-2030

Chart on South Africa - Market size and forecast 2025-2030 ($ million)
Data Table on South Africa - Market size and forecast 2025-2030 ($ million)
Chart on South Africa - Year-over-year growth 2025-2030 (%)
Data Table on South Africa - Year-over-year growth 2025-2030 (%)

12.7.4 Israel - Market size and forecast 2025-2030

Chart on Israel - Market size and forecast 2025-2030 ($ million)
Data Table on Israel - Market size and forecast 2025-2030 ($ million)
Chart on Israel - Year-over-year growth 2025-2030 (%)
Data Table on Israel - Year-over-year growth 2025-2030 (%)

12.7.5 Turkey - Market size and forecast 2025-2030

Chart on Turkey - Market size and forecast 2025-2030 ($ million)
Data Table on Turkey - Market size and forecast 2025-2030 ($ million)
Chart on Turkey - Year-over-year growth 2025-2030 (%)
Data Table on Turkey - Year-over-year growth 2025-2030 (%)

12.8 Market opportunity by geography

Market opportunity by geography ($ million)
Data Tables on Market opportunity by geography ($ million)

13. Drivers, Challenges, and Opportunity

13.1 Market drivers

Paradigm shift from asset ownership toward flexible usership models
Accelerated EV adoption through risk-mitigating subscription platforms
Integration of software-defined vehicles and data-driven personalization

13.2 Market challenges

Escalation of residual value volatility and asset depreciation risks
Proliferation of regulatory fragmentation and cybersecurity liability standards
Operational burden of fleet utilization and infrastructure gaps

13.3 Impact of drivers and challenges

Impact of drivers and challenges in 2025 and 2030

13.4 Market opportunities

Integration of software-defined vehicle features and digital subscription tiers
Growth of fleet-led electrification and electric vehicle experience programs
Expansion of multi-modal mobility-as-a-service and integrated digital platforms

14. Competitive Landscape

14.1 Overview

14.2

Overview on criticality of inputs and factors of differentiation

14.3 Landscape disruption

Overview on factors of disruption

14.4 Industry risks

Impact of key risks on business

15. Competitive Analysis

15.1 Companies profiled

Companies covered

15.2 Company ranking index

15.3 Market positioning of companies

Matrix on companies position and classification

15.4 Audi of America

Audi of America - Overview
Audi of America - Product / Service
Audi of America - Key offerings
SWOT

15.5 BMW of North America LLC

BMW of North America LLC - Overview
BMW of North America LLC - Product / Service
BMW of North America LLC - Key offerings
SWOT

15.6 Cadillac

Cadillac - Overview
Cadillac - Product / Service
Cadillac - Key offerings
SWOT

15.7 Dr. Ing. h.c. F. Porsche AG

Dr. Ing. h.c. F. Porsche AG - Overview
Dr. Ing. h.c. F. Porsche AG - Business segments
Dr. Ing. h.c. F. Porsche AG - Key offerings
Dr. Ing. h.c. F. Porsche AG - Segment focus
SWOT

15.8 Electric Road

Electric Road - Overview
Electric Road - Product / Service
Electric Road - Key offerings
SWOT

15.9 FlexClub

FlexClub - Overview
FlexClub - Product / Service
FlexClub - Key offerings
SWOT

15.10 Ford Motor Co.

Ford Motor Co. - Overview
Ford Motor Co. - Business segments
Ford Motor Co. - Key offerings
Ford Motor Co. - Segment focus
SWOT

15.11 Hyundai Motor Co.

Hyundai Motor Co. - Overview
Hyundai Motor Co. - Business segments
Hyundai Motor Co. - Key offerings
Hyundai Motor Co. - Segment focus
SWOT

15.12 KIA CORP.

KIA CORP. - Overview
KIA CORP. - Product / Service
KIA CORP. - Key offerings
SWOT

15.13 Loopit

Loopit - Overview
Loopit - Product / Service
Loopit - Key offerings
SWOT

15.14 Mercedes Benz USA LLC

Mercedes Benz USA LLC - Overview
Mercedes Benz USA LLC - Product / Service
Mercedes Benz USA LLC - Key offerings
SWOT

15.15 Renault SAS

Renault SAS - Overview
Renault SAS - Business segments
Renault SAS - Key offerings
Renault SAS - Segment focus
SWOT

15.16 SIXT SE

SIXT SE - Overview
SIXT SE - Business segments
SIXT SE - Key offerings
SIXT SE - Segment focus
SWOT

15.17 Stellantis NV

Stellantis NV - Overview
Stellantis NV - Business segments
Stellantis NV - Key news
Stellantis NV - Key offerings
Stellantis NV - Segment focus
SWOT

15.18 Wagonex Ltd

Wagonex Ltd - Overview
Wagonex Ltd - Product / Service
Wagonex Ltd - Key offerings
SWOT

16. Appendix

16.1 Scope of the report

Market definition
Objectives
Notes and caveats

16.2 Inclusions and exclusions checklist

Inclusions checklist
Exclusions checklist

16.3 Currency conversion rates for US$

16.4 Research methodology

16.5 Data procurement

Information sources

16.6 Data validation

16.7 Validation techniques employed for market sizing

16.8 Data synthesis

16.9 360 degree market analysis

16.10 List of abbreviations

Research Methodology

Technavio presents a detailed picture of the market by way of study, synthesis, and summation of data from multiple sources. The analysts have presented the various facets of the market with a particular focus on identifying the key industry influencers. The data thus presented is comprehensive, reliable, and the result of extensive research, both primary and secondary.

INFORMATION SOURCES

Primary sources

  • Manufacturers and suppliers
  • Channel partners
  • Industry experts
  • Strategic decision makers

Secondary sources

  • Industry journals and periodicals
  • Government data
  • Financial reports of key industry players
  • Historical data
  • Press releases

DATA ANALYSIS

Data Synthesis

  • Collation of data
  • Estimation of key figures
  • Analysis of derived insights

Data Validation

  • Triangulation with data models
  • Reference against proprietary databases
  • Corroboration with industry experts

REPORT WRITING

Qualitative

  • Market drivers
  • Market challenges
  • Market trends
  • Five forces analysis

Quantitative

  • Market size and forecast
  • Market segmentation
  • Geographical insights
  • Competitive landscape

Interested in this report?

Get your sample now to see our research methodology and insights!

Download Now

Frequently Asked Questions

Automotive Subscription Services market growth will increase by USD 4430.2 million during 2026-2030.

The Automotive Subscription Services market is expected to grow at a CAGR of 17.3% during 2026-2030.

Automotive Subscription Services market is segmented by Distribution channel (OEMs, Dealership or third party) Type (Multi-brand subscriptions, Single-brand subscriptions) End-user (Individual, Business)

Audi of America, Autonomy, BMW of North America LLC, Cadillac, Cazoo Ltd., Dr. Ing. h.c. F. Porsche AG, Electric Road, Finn.auto, FlexClub, Ford Motor Co., Hyundai Motor Co., KIA CORP., Lexus, Loopit, Mercedes Benz USA LLC, Renault SAS, SIXT SE, Stellantis NV, Wagonex Ltd are a few of the key vendors in the Automotive Subscription Services market.

North America will register the highest growth rate of 48.3% among the other regions. Therefore, the Automotive Subscription Services market in North America is expected to garner significant business opportunities for the vendors during the forecast period.

US, Canada, Mexico, Germany, UK, France, Italy, Spain, The Netherlands, China, Japan, South Korea, India, Australia, Indonesia, Brazil, Argentina, Chile, Saudi Arabia, UAE, South Africa, Israel, Turkey

  • Paradigm shift from asset ownership toward flexible usership models is the driving factor this market.

The Automotive Subscription Services market vendors should focus on grabbing business opportunities from the Distribution channel segment as it accounted for the largest market share in the base year.
RIA - Research AI Assistant
Ask RIA