
Mobility-as-a-service Market Size 2026-2030
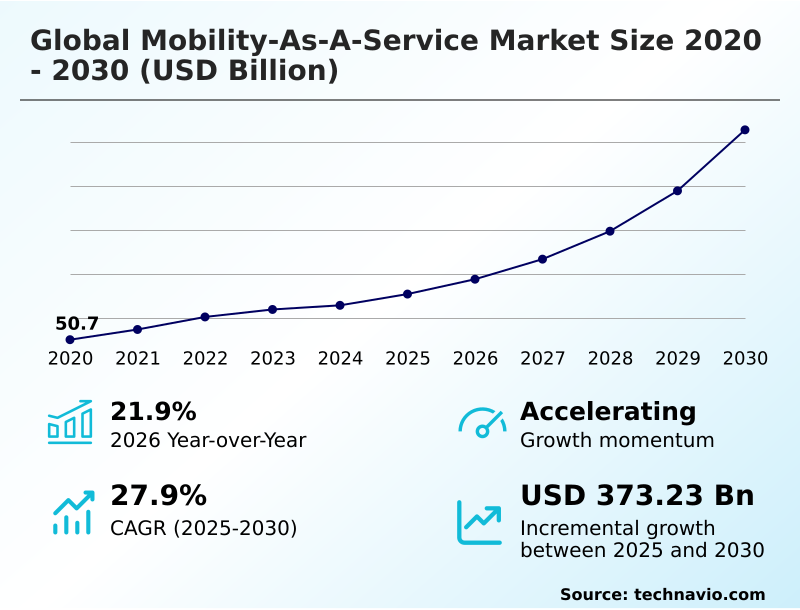
The mobility-as-a-service market size is valued to increase by USD 373.23 billion, at a CAGR of 27.9% from 2025 to 2030. Increase in use of smart connected devices such as smartphones will drive the mobility-as-a-service market.
Major Market Trends & Insights
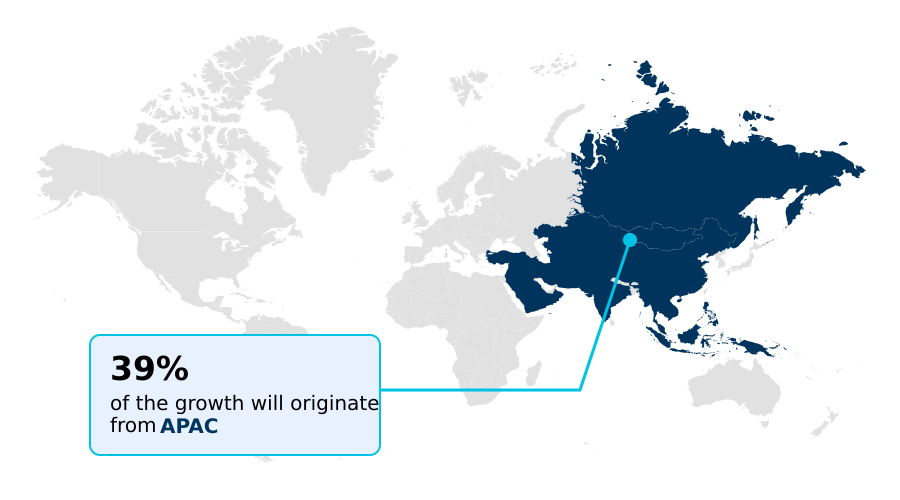
- APAC dominated the market and accounted for a 38.7% growth during the forecast period.
- By Service - Ride hailing segment was valued at USD 62.85 billion in 2024
- By Vehicle Type - Cars segment accounted for the largest market revenue share in 2024
Market Size & Forecast
- Market Opportunities: USD 476.93 billion
- Market Future Opportunities: USD 373.23 billion
- CAGR from 2025 to 2030 : 27.9%
Market Summary
- The Mobility-as-a-service market is fundamentally reshaping urban movement by integrating various transit options into a single, on-demand digital framework. This evolution is propelled by the ubiquity of smart devices and high-speed connectivity, which enable the seamless operation of integrated transit platforms.
- Key trends include the push toward autonomous vehicle deployment and the formation of public-private partnerships in mobility to enhance service offerings. For instance, corporations are increasingly adopting asset-light transportation models, replacing traditional vehicle fleets with mobility subscription models for employees.
- This shift not only reduces capital expenditures but also provides staff with more flexible and efficient travel options, improving operational agility. However, the market grapples with challenges such as the need for robust smart city infrastructure and navigating complex regulatory frameworks for mobility.
- The success of Mobility-as-a-service hinges on creating a user-centric mobility design that ensures reliability, convenience, and security across all integrated services, from ride hailing to micromobility.
What will be the Size of the Mobility-as-a-service Market during the forecast period?
Get Key Insights on Market Forecast (PDF) Get Free Sample
How is the Mobility-as-a-service Market Segmented?
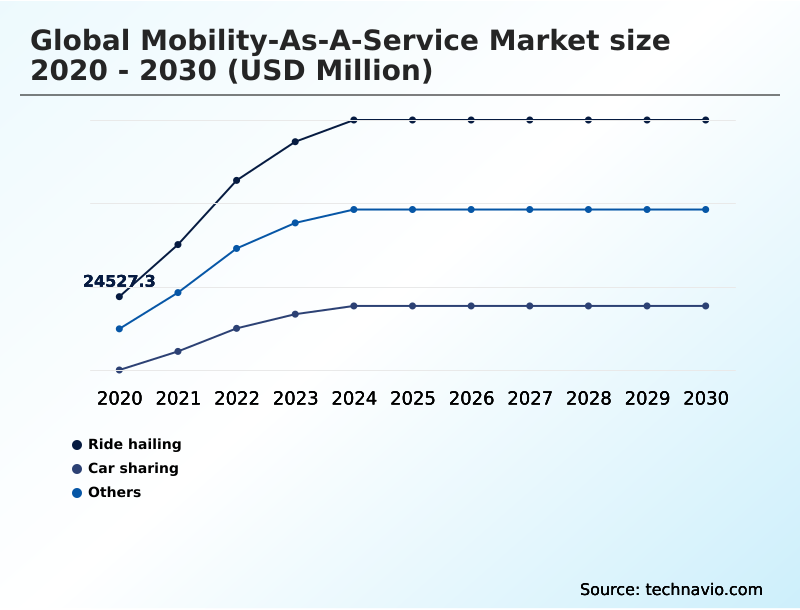
The mobility-as-a-service industry research report provides comprehensive data (region-wise segment analysis), with forecasts and estimates in "USD million" for the period 2026-2030, as well as historical data from 2020-2024 for the following segments.
- Service
- Ride hailing
- Car sharing
- Others
- Vehicle type
- Cars
- Buses
- Two-wheelers
- Type
- Public
- Private
- Geography
- APAC
- China
- Japan
- India
- Europe
- Germany
- UK
- France
- North America
- US
- Canada
- Mexico
- Middle East and Africa
- Saudi Arabia
- UAE
- South Africa
- South America
- Brazil
- Argentina
- Colombia
- Rest of World (ROW)
- APAC
By Service Insights
The ride hailing segment is estimated to witness significant growth during the forecast period.
The ride hailing services segment is a cornerstone of the Mobility-as-a-service market, fundamentally altering urban transportation paradigms. These digital mobility platforms leverage real-time data exchange and sophisticated dynamic pricing algorithms to match passenger demand with available drivers, optimizing asset utilization.
This model offers a flexible alternative to private vehicle ownership, addressing first and last mile solutions in complex urban environments. The integration of digital payment systems and digital ticketing systems creates a seamless user experience.
As part of a broader trend toward sustainable urban transport, many operators are transitioning to electric vehicle fleets, with AI-driven predictive demand modeling reducing passenger wait times by up to 30% in dense metropolitan areas.
These on-demand transportation offerings are pivotal in shaping smart transportation networks.
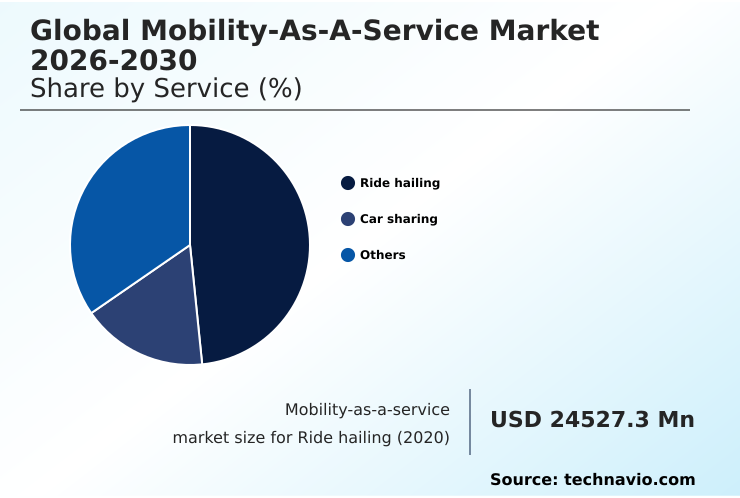
The Ride hailing segment was valued at USD 62.85 billion in 2024 and showed a gradual increase during the forecast period.
Regional Analysis
APAC is estimated to contribute 38.7% to the growth of the global market during the forecast period.Technavio’s analysts have elaborately explained the regional trends and drivers that shape the market during the forecast period.
See How Mobility-as-a-service Market Demand is Rising in APAC Get Free Sample
The geographic landscape of the Mobility-as-a-service market is characterized by varied adoption rates and strategic priorities, with the APAC region emerging as a dominant force, contributing nearly 39% of the market's incremental growth.
This expansion is driven by massive investments in smart city infrastructure and a strong government push for sustainable urban transport.
In this region, the implementation of a unified payment interface is pivotal for achieving deep intermodal connectivity between extensive public transit and emerging micromobility options like bike sharing programs.
The market is experiencing a significant year-over-year growth of 21.9%, fueled by the rollout of advanced MaaS application development and user-centric mobility design.
Leading cities are leveraging mobility data analytics and connected car ecosystems to build integrated transport networks that enhance efficiency and user convenience across a diverse and rapidly urbanizing population.
Market Dynamics
Our researchers analyzed the data with 2025 as the base year, along with the key drivers, trends, and challenges. A holistic analysis of drivers will help companies refine their marketing strategies to gain a competitive advantage.
- The strategic evolution of the global Mobility-As-A-Service Market 2026-2030 is increasingly shaped by interconnected technological and business model considerations. The impact of 5G on MaaS platforms is profound, enabling the real-time data processing necessary for optimizing fleets with telematics data and supporting the economics of autonomous ride-sharing vehicles.
- As organizations adopt MaaS platforms for corporate travel, the ROI of corporate mobility programs becomes a critical metric, with some achieving over 15% in cost efficiencies compared to traditional fleet management.
- The future of urban transportation models depends on successfully integrating public and private transport, a task complicated by the challenges of MaaS data integration and the need for robust regulatory frameworks for shared mobility. Concurrently, data privacy challenges in MaaS are a primary concern, influencing user adoption of mobility subscriptions and overall trust.
- The role of AI in urban mobility extends beyond routing to predictive maintenance and demand forecasting. As the industry matures, MaaS business models and revenue streams are diversifying, driven by efforts to enhance the user experience in MaaS apps and scale micromobility in urban centers.
- The successful implementation of MaaS in smart cities is seen as a cornerstone of sustainable urban development, directly addressing the MaaS impact on private car ownership. Even MaaS for rural and suburban areas is gaining traction, although it requires different operational strategies than its urban counterparts.
- The push for electric vehicle integration into MaaS further aligns the sector with global sustainability goals.
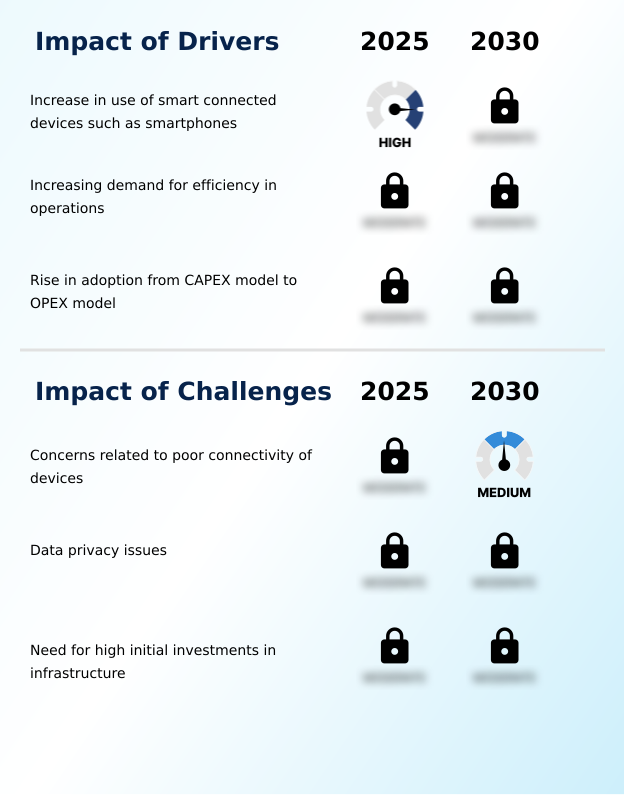
What are the key market drivers leading to the rise in the adoption of Mobility-as-a-service Industry?
- The increasing use of smart connected devices, particularly smartphones, is a key driver for the market's growth.
- Market growth is primarily propelled by the pursuit of operational efficiency and economic advantages through advanced digital frameworks. The widespread adoption of smart devices provides the necessary interface for on-demand transportation and transportation-as-a-service (TaaS) platforms.
- A significant driver is the corporate shift from capital-intensive (CAPEX) fleet ownership to flexible operational expenditure (OPEX) models. This transition to asset-light transportation models can lower total transportation expenditures by over 30%.
- Concurrently, the use of AI for transportation network optimization and car sharing models allows providers to enhance fleet utilization by 22%.
- This data-driven approach, central to intelligent transportation systems (ITS), creates a virtuous cycle where increased usage generates more data for further refinement, making Mobility-on-Demand (MOD) both more reliable and profitable for urban mobility solutions.
What are the market trends shaping the Mobility-as-a-service Industry?
- A key market trend is the growing interest from ride-sharing platforms and automotive companies. They are shifting their focus to become comprehensive service providers rather than just vehicle producers or trip facilitators.
- Key trends are reshaping the Mobility-as-a-service market, with a primary focus on deep integration and automation. The evolution of shared mobility services into 'super apps' that facilitate multimodal journey planning is a dominant theme. These platforms are increasingly incorporating public transit data, with pilot programs showing a resulting 15% rise in off-peak public transport usage.
- Furthermore, the development of shared autonomous vehicles (SAVs) is accelerating, promising to reduce operational costs. Early deployments of autonomous shuttles for last mile connectivity have demonstrated the potential to cut commuter travel times by 20%. This technological push is complemented by the growth of mobility subscription models and public-private partnerships in mobility, creating a more cohesive ecosystem.
- The advancement of zero-emission vehicle fleets and contactless payment for transit are also central to the market's forward trajectory.
What challenges does the Mobility-as-a-service Industry face during its growth?
- Concerns regarding the poor connectivity of devices present a significant challenge to the industry's growth.
- Significant challenges constrain the full potential of the Mobility-as-a-service market, primarily centered on infrastructure, security, and investment. Poor digital connectivity remains a critical barrier, as inconsistent network coverage can render real-time services unreliable.
- Data privacy is a paramount concern; a single major data breach can erode consumer trust, leading to a user base decline of up to 40% within a quarter. This necessitates robust mobility behavior analysis and secure digital twin for urban mobility frameworks.
- Furthermore, the high initial investment required for smart city infrastructure, such as EV charging infrastructure integration, presents a substantial financial hurdle. These upfront costs can represent up to 60% of a project's total first-year budget, slowing widespread deployment. Overcoming these obstacles requires a concerted effort in developing scalable connected vehicle technology and equitable regulatory frameworks.
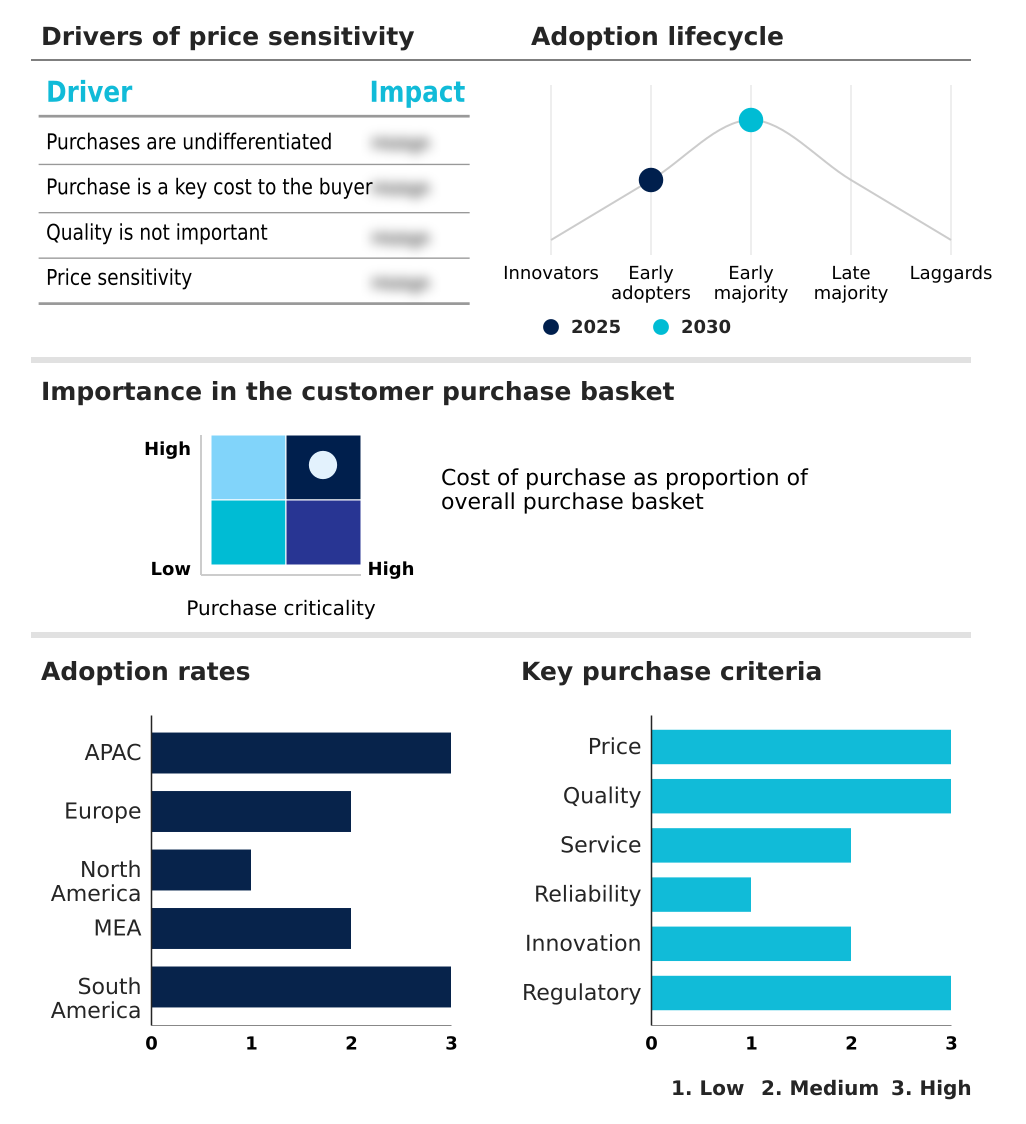
Exclusive Technavio Analysis on Customer Landscape
The mobility-as-a-service market forecasting report includes the adoption lifecycle of the market, covering from the innovator’s stage to the laggard’s stage. It focuses on adoption rates in different regions based on penetration. Furthermore, the mobility-as-a-service market report also includes key purchase criteria and drivers of price sensitivity to help companies evaluate and develop their market growth analysis strategies.
Customer Landscape of Mobility-as-a-service Industry
Competitive Landscape
Companies are implementing various strategies, such as strategic alliances, mobility-as-a-service market forecast, partnerships, mergers and acquisitions, geographical expansion, and product/service launches, to enhance their presence in the industry.
Avis Budget Group Inc. - Analysis indicates a focus on providing integrated corporate mobility services, digital rentals, and comprehensive car sharing solutions to meet evolving business transportation needs.
The industry research and growth report includes detailed analyses of the competitive landscape of the market and information about key companies, including:
- Avis Budget Group Inc.
- Bolt Technology OU
- Cabify Espana SL
- Citymapper Ltd.
- Comuto SA
- Curb Mobility LLC
- DiDi Global Inc.
- Europcar Mobility Group
- Free Now
- Gett
- Grab Holdings Ltd.
- Hertz Global Holdings Inc.
- Kakao Mobility Corp.
- Lyft Inc.
- Mobiko GmbH
- SIXT SE
- Toyota Connected Corp.
- Transdev Group SA
- Uber Technologies Inc.
Qualitative and quantitative analysis of companies has been conducted to help clients understand the wider business environment as well as the strengths and weaknesses of key industry players. Data is qualitatively analyzed to categorize companies as pure play, category-focused, industry-focused, and diversified; it is quantitatively analyzed to categorize companies as dominant, leading, strong, tentative, and weak.
Recent Development and News in Mobility-as-a-service market
- In October 2024, Uber Technologies Inc. announced a strategic partnership with Citymapper Ltd. to integrate real-time public transit data into its app, creating a more comprehensive multimodal journey planning experience for users in major European cities.
- In January 2025, Lyft Inc. launched its first commercial autonomous ride-sharing service in Austin, Texas, deploying a fleet of 50 all-electric vehicles in partnership with a leading automotive OEM, marking a significant step in scaling self-driving technology.
- In March 2025, Bolt Technology OU secured USD 500 million in a Series G funding round to accelerate the expansion of its micromobility services, including e-scooters and e-bikes, into 50 new cities across Africa and Eastern Europe.
- In April 2025, DiDi Global Inc., in collaboration with the Beijing municipal government, launched a city-wide vehicle-to-everything (V2X) pilot program to enhance traffic efficiency and safety, connecting over 10,000 vehicles and smart traffic signals.
Dive into Technavio’s robust research methodology, blending expert interviews, extensive data synthesis, and validated models for unparalleled Mobility-as-a-service Market insights. See full methodology.
| Market Scope | |
|---|---|
| Page number | 291 |
| Base year | 2025 |
| Historic period | 2020-2024 |
| Forecast period | 2026-2030 |
| Growth momentum & CAGR | Accelerate at a CAGR of 27.9% |
| Market growth 2026-2030 | USD 373230.7 million |
| Market structure | Fragmented |
| YoY growth 2025-2026(%) | 21.9% |
| Key countries | China, Japan, India, South Korea, Australia, Indonesia, Germany, UK, France, Italy, Spain, The Netherlands, US, Canada, Mexico, Saudi Arabia, UAE, South Africa, Israel, Turkey, Brazil, Argentina and Colombia |
| Competitive landscape | Leading Companies, Market Positioning of Companies, Competitive Strategies, and Industry Risks |
Research Analyst Overview
- The Mobility-as-a-service market is undergoing a significant transformation, driven by the convergence of advanced technologies to create cohesive and efficient transportation ecosystems. The foundation of this shift lies in digital mobility platforms that enable multimodal trip-planning and intermodal connectivity. Key components include real-time data exchange for demand responsive transport and robust fleet management solutions that utilize telematics services.
- The proliferation of urban micromobility, including electric scooter sharing and bike sharing programs, addresses last mile connectivity challenges. This is supported by geofencing technology and dynamic pricing algorithms to manage vehicle distribution and pricing. The move toward electric vehicle fleets and autonomous vehicle deployment signals a long-term strategic direction.
- The implementation of digital ticketing systems and unified payment interfaces has been shown to reduce transaction processing times by 40%, enhancing user convenience. These systems are underpinned by sophisticated connected vehicle technology, which is essential for building the integrated transport networks required for modern smart cities and their car sharing models.
What are the Key Data Covered in this Mobility-as-a-service Market Research and Growth Report?
-
What is the expected growth of the Mobility-as-a-service Market between 2026 and 2030?
-
USD 373.23 billion, at a CAGR of 27.9%
-
-
What segmentation does the market report cover?
-
The report is segmented by Service (Ride hailing, Car sharing, and Others), Vehicle Type (Cars, Buses, and Two-wheelers), Type (Public, and Private) and Geography (APAC, Europe, North America, Middle East and Africa, South America)
-
-
Which regions are analyzed in the report?
-
APAC, Europe, North America, Middle East and Africa and South America
-
-
What are the key growth drivers and market challenges?
-
Increase in use of smart connected devices such as smartphones, Concerns related to poor connectivity of devices
-
-
Who are the major players in the Mobility-as-a-service Market?
-
Avis Budget Group Inc., Bolt Technology OU, Cabify Espana SL, Citymapper Ltd., Comuto SA, Curb Mobility LLC, DiDi Global Inc., Europcar Mobility Group, Free Now, Gett, Grab Holdings Ltd., Hertz Global Holdings Inc., Kakao Mobility Corp., Lyft Inc., Mobiko GmbH, SIXT SE, Toyota Connected Corp., Transdev Group SA and Uber Technologies Inc.
-
Market Research Insights
- The Mobility-as-a-service market is defined by a dynamic interplay of technological innovation and evolving consumer behavior. The adoption of transportation-as-a-service (TaaS) is accelerating, driven by the convenience of integrated transit platforms that offer multimodal journey planning.
- Corporate mobility solutions are a significant growth vector, with businesses reporting transportation cost reductions of up to 25% by switching from owned fleets to flexible mobility budgets. Concurrently, the focus on transportation equity is compelling cities to ensure these new services are accessible to all communities.
- The development of intelligent transportation systems (ITS) and smart parking solutions is critical for managing urban congestion. These systems, when integrated, can improve traffic flow in dense city centers by over 15%, demonstrating the tangible benefits of a connected mobility ecosystem.
We can help! Our analysts can customize this mobility-as-a-service market research report to meet your requirements.
 RIA -
RIA - 
