
Subscription Services Market Size 2026-2030
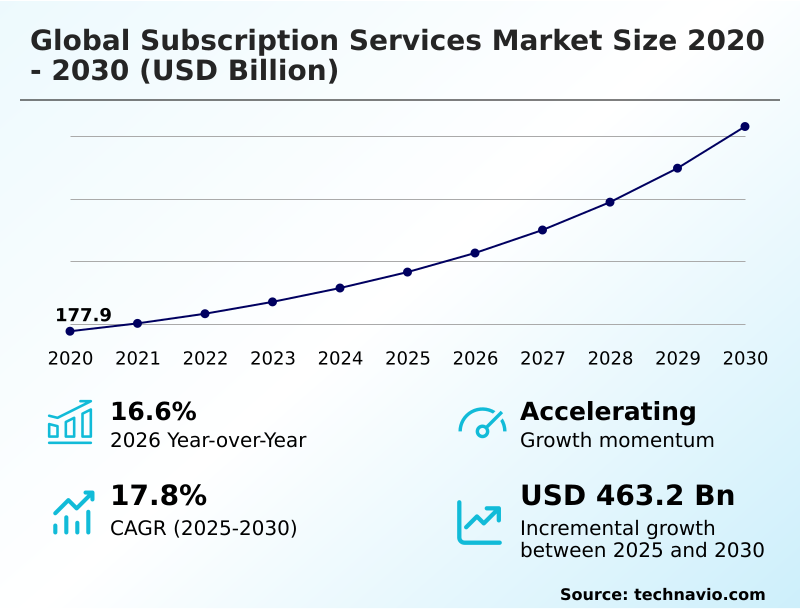
The subscription services market size is valued to increase by USD 463.2 billion, at a CAGR of 17.8% from 2025 to 2030. Increasing demand for convenience and personalization will drive the subscription services market.
Major Market Trends & Insights
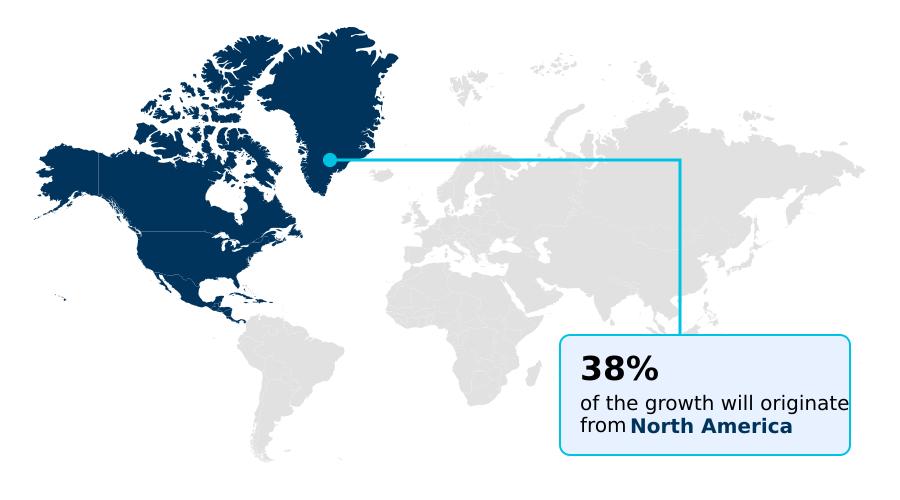
- North America dominated the market and accounted for a 38.5% growth during the forecast period.
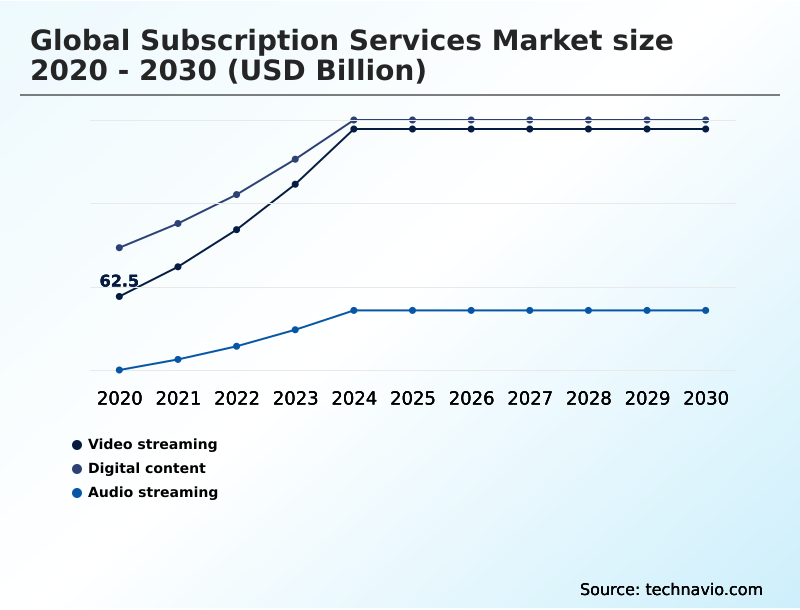
- By Service - Video streaming segment was valued at USD 127.4 billion in 2024
- By Type - Paid segment accounted for the largest market revenue share in 2024
Market Size & Forecast
- Market Opportunities: USD 651.4 billion
- Market Future Opportunities: USD 463.2 billion
- CAGR from 2025 to 2030 : 17.8%
Market Summary
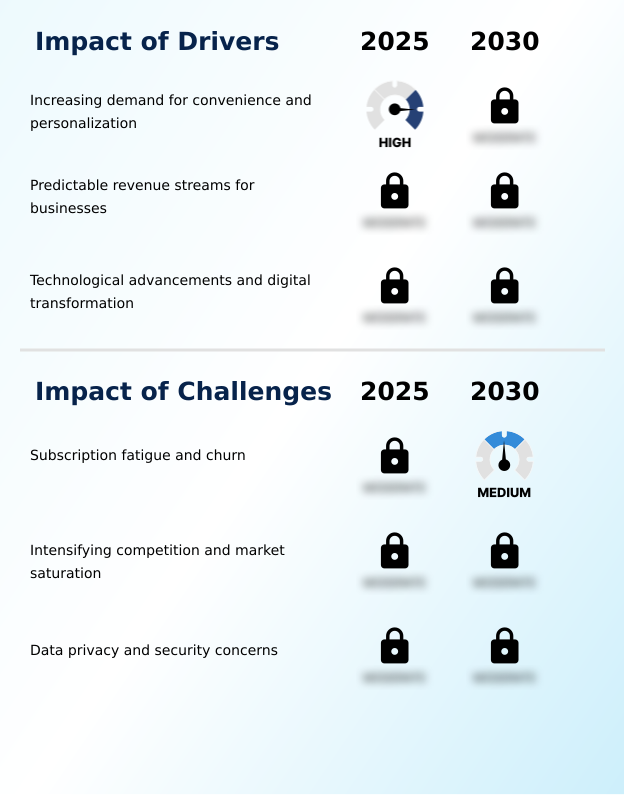
- The subscription services market is undergoing a significant transformation, driven by a consumer shift toward access over ownership. This model, built on recurring revenue models, offers businesses predictable income streams and deeper customer relationships. Key drivers include the demand for convenience and hyper-personalization, facilitated by technological advancements like cloud computing and AI.
- For example, a media company can utilize subscription analytics dashboards to monitor viewing patterns, enabling the creation of targeted content that reduces churn and increases customer lifetime value. However, the industry faces challenges such as market saturation and subscription fatigue, where consumers feel overwhelmed by multiple recurring payments.
- Success in this environment requires a focus on delivering continuous value, whether through exclusive content, curated products, or superior service. Businesses must also navigate the complexities of data privacy and security, as building and maintaining customer trust is paramount for long-term retention and growth in this competitive landscape.
What will be the Size of the Subscription Services Market during the forecast period?
Get Key Insights on Market Forecast (PDF) Get Free Sample
How is the Subscription Services Market Segmented?
The subscription services industry research report provides comprehensive data (region-wise segment analysis), with forecasts and estimates in "USD billion" for the period 2026-2030, as well as historical data from 2020-2024 for the following segments.
- Service
- Video streaming
- Digital content
- Audio streaming
- Type
- Paid
- Free
- Platform
- Mobile devices
- Desktops and laptops
- Gaming consoles
- Smart TVs
- Others
- Geography
- North America
- US
- Canada
- Mexico
- APAC
- China
- India
- Japan
- Europe
- UK
- Germany
- France
- South America
- Brazil
- Argentina
- Colombia
- Middle East and Africa
- Saudi Arabia
- Turkey
- South Africa
- Rest of World (ROW)
- North America
By Service Insights
The video streaming segment is estimated to witness significant growth during the forecast period.
The video streaming segment continues its dynamic expansion, driven by consumer demand for on-demand content across a multitude of devices.
Key to success is effective content entitlement systems and a robust service bundling strategy, which are increasingly vital in a competitive landscape.
Providers are leveraging AI-powered personalization to enhance user experience, with some platforms seeing a 15% uplift in engagement through tailored recommendations. This market is a focal point for media subscription platforms and OTT streaming technology.
As companies refine their recurring revenue models, the focus shifts to optimizing the subscriber lifecycle management and implementing sophisticated subscription-based billing.
Success hinges on a deep understanding of consumer preferences, a strong freemium to paid conversion pipeline, and investment in high-quality, exclusive content to differentiate within a crowded field of fitness subscription apps and music streaming platforms.
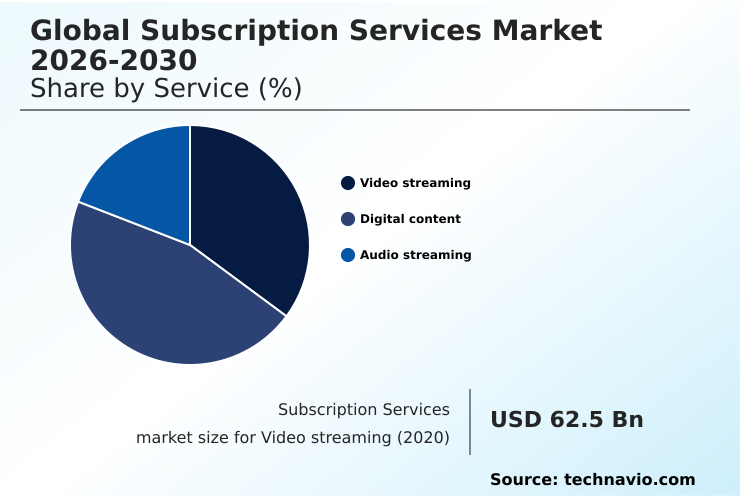
The Video streaming segment was valued at USD 127.4 billion in 2024 and showed a gradual increase during the forecast period.
Regional Analysis
North America is estimated to contribute 38.5% to the growth of the global market during the forecast period.Technavio’s analysts have elaborately explained the regional trends and drivers that shape the market during the forecast period.
See How Subscription Services Market Demand is Rising in North America Get Free Sample
The geographic landscape of the subscription services market is diverse, with North America representing a 38% share of the incremental growth opportunity. This maturity drives a focus on customer retention tactics and optimizing subscriber grace periods.
In contrast, the APAC region, including countries like India and China, is a high-growth frontier for meal kit subscription services, driven by rising disposable incomes and digitalization.
In Europe, stringent data regulations influence the deployment of metered billing and require robust revenue recognition standards. Companies in South America and the Middle East and Africa are increasingly adopting subscription e-commerce logistics to serve burgeoning online consumer bases.
Across all regions, from the UK to Japan, the use of automated renewal processing improves efficiency, with some providers reducing involuntary churn by over 5%.
Market Dynamics
Our researchers analyzed the data with 2025 as the base year, along with the key drivers, trends, and challenges. A holistic analysis of drivers will help companies refine their marketing strategies to gain a competitive advantage.
- Strategic success in the modern digital economy requires a mastery of the subscription services market. This involves more than just launching a product; it demands a comprehensive approach to optimizing subscription renewal rates through proactive engagement and value demonstration. The use of AI in subscription personalization is no longer a luxury but a core component for creating tailored experiences.
- Effectively managing subscription churn is critical, which involves deep analysis and strategic interventions. A key decision point is the subscription bundling vs aggregation strategy, where companies weigh the benefits of creating their own ecosystem against participating in a larger marketplace. The impact of 5G on streaming subscriptions is profound, enabling higher-quality content delivery and new interactive formats.
- Simultaneously, upholding data privacy in subscription models is crucial for maintaining customer trust. Businesses are intensely focused on reducing customer acquisition costs, often finding that retention-focused strategies are twice as effective as new customer campaigns. Scaling a subscription box business requires excellence in logistics and curation, while a B2B SaaS subscription must focus on delivering clear ROI.
- Firms are actively implementing usage-based billing and perfecting freemium model conversion strategies. Accurately calculating customer lifetime value informs long-term planning, while choosing a subscription billing platform is a foundational technology decision. Ensuring compliance with revenue recognition rules prevents financial restatements. Efforts in personalizing the subscriber journey and combatting subscription fatigue with value are ongoing.
- The role of cloud gaming in subscriptions is expanding, and many are exploring a subscription model for physical products. Finally, understanding subscription pricing elasticity analysis and building a creator economy subscription are advanced strategies for growth.
What are the key market drivers leading to the rise in the adoption of Subscription Services Industry?
- The increasing consumer demand for convenience and personalized experiences is a primary driver fueling the growth of the subscription services market.
- The primary driver for the subscription services market is the strategic shift toward predictable, recurring income streams and deeper customer relationships. Adopting a subscription-based business intelligence framework allows companies to improve revenue forecast accuracy by up to 30%.
- This stability is critical for SaaS subscription metrics and D2C subscription models alike. Technological advancements, particularly cloud-based billing platforms, have lowered entry barriers, enabling more businesses to implement paywall technology and manage prorated subscriptions efficiently.
- The demand for convenience is fueling the growth of automotive subscription services and curated subscription boxes.
- This operational model fosters a continuous feedback loop, supporting a product-led growth strategy where user data directly informs service enhancements and retention efforts, leading to a 15% average increase in customer satisfaction scores.
What are the market trends shaping the Subscription Services Industry?
- Hyper-personalization, powered by artificial intelligence and machine learning, is an emerging trend within the subscription services market. This approach enables companies to deliver highly tailored and individualized customer experiences.
- Key trends are reshaping the subscription services market, with a focus on delivering hyper-personalized experiences. The use of sophisticated churn prediction algorithms is becoming standard, allowing businesses to proactively retain customers by identifying churn risk with over 80% accuracy.
- There is also a move toward flexible consumption, with API-driven subscription logic enabling more complex usage-based pricing models and multi-tier subscription plans. This is particularly evident in B2B subscription services and enterprise subscription billing.
- Service bundling strategy remains a popular approach to increase customer lifetime value, a metric that has improved by up to 25% for companies that successfully bundle complementary services. Furthermore, the rise of creator economy platforms and niche subscription markets is driving innovation in digital publishing subscriptions and other specialized content offerings.
What challenges does the Subscription Services Industry face during its growth?
- Subscription fatigue and customer churn represent a significant challenge impacting the sustainable growth of the subscription services industry.
- A significant challenge facing the subscription services market is escalating subscription fatigue, with some consumer segments reporting churn rates over 40% due to cost and management overload. This intensifies the need for effective dunning management and flexible trial management to convert users without causing friction.
- Intensifying competition across sectors, from ad-supported streaming tiers to software as a service (SaaS), puts pressure on pricing and necessitates a strong focus on customer lifetime value (CLV). Data privacy concerns are also a major restraint; complying with regulations while using data for personalization requires a delicate balance.
- Failure to protect user data can erode trust and lead to abandonment rates increasing by 50% or more. Addressing voluntary vs involuntary churn and managing subscription fatigue indicators are now critical operational priorities for all subscription businesses.
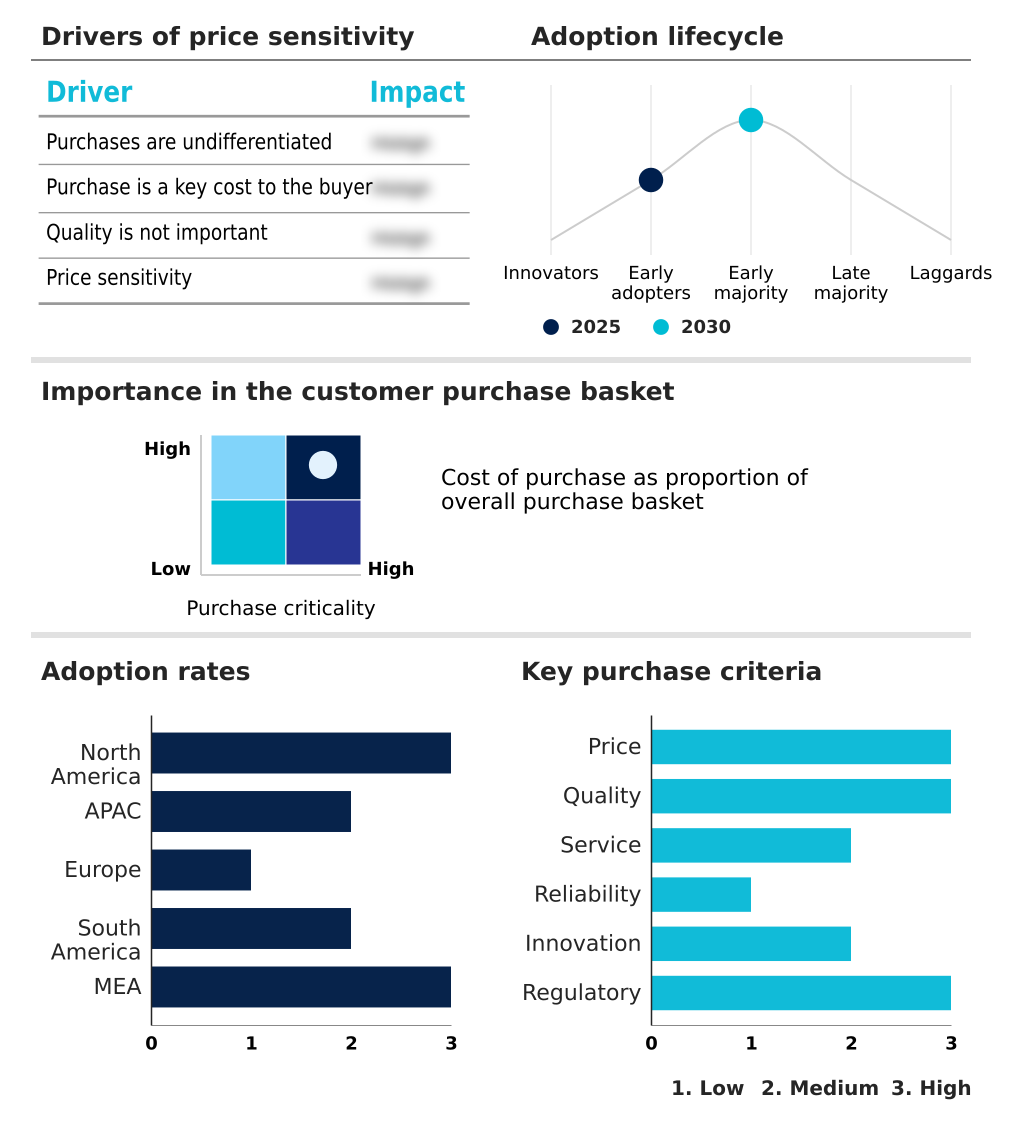
Exclusive Technavio Analysis on Customer Landscape
The subscription services market forecasting report includes the adoption lifecycle of the market, covering from the innovator’s stage to the laggard’s stage. It focuses on adoption rates in different regions based on penetration. Furthermore, the subscription services market report also includes key purchase criteria and drivers of price sensitivity to help companies evaluate and develop their market growth analysis strategies.
Customer Landscape of Subscription Services Industry
Competitive Landscape
Companies are implementing various strategies, such as strategic alliances, subscription services market forecast, partnerships, mergers and acquisitions, geographical expansion, and product/service launches, to enhance their presence in the industry.
Amazon.com Inc. - Key offerings are integrated subscription services that bundle digital media with e-commerce benefits, driving recurring revenue and customer engagement across multiple business segments.
The industry research and growth report includes detailed analyses of the competitive landscape of the market and information about key companies, including:
- Amazon.com Inc.
- Apple Inc.
- Baidu Inc.
- Boomplay
- Deezer SA
- Discovery Inc.
- Entertainment Network India Ltd.
- Eros Digital FZE
- Hulu LLC
- Lions Gate Entertainment Corp.
- MAX
- Netflix Inc.
- Pandora Media Inc.
- Paramount
- Peacock TV LLC
- Spotify Technology SA
- Tencent Holdings Ltd.
- The Walt Disney Co.
- TIDAL Music AS
- XANDRIE SA
Qualitative and quantitative analysis of companies has been conducted to help clients understand the wider business environment as well as the strengths and weaknesses of key industry players. Data is qualitatively analyzed to categorize companies as pure play, category-focused, industry-focused, and diversified; it is quantitatively analyzed to categorize companies as dominant, leading, strong, tentative, and weak.
Recent Development and News in Subscription services market
- In August, 2024, Keto Krate launched a new subscription box service delivering a monthly selection of keto-friendly snacks to its subscribers.
- In September, 2024, the streaming service Shudder was launched, specializing in horror movies and TV shows to cater to a niche audience of horror fans.
- In February, 2025, Verizon announced a new bundled offering that combines its 5G home internet service with a subscription to both Netflix and Max.
- In March, 2025, Netflix announced further enhancements to its recommendation algorithm, which now incorporates more nuanced data points to provide more accurate and relevant suggestions.
Dive into Technavio’s robust research methodology, blending expert interviews, extensive data synthesis, and validated models for unparalleled Subscription Services Market insights. See full methodology.
| Market Scope | |
|---|---|
| Page number | 296 |
| Base year | 2025 |
| Historic period | 2020-2024 |
| Forecast period | 2026-2030 |
| Growth momentum & CAGR | Accelerate at a CAGR of 17.8% |
| Market growth 2026-2030 | USD 463.2 billion |
| Market structure | Fragmented |
| YoY growth 2025-2026(%) | 16.6% |
| Key countries | US, Canada, Mexico, China, India, Japan, South Korea, Australia, Indonesia, UK, Germany, France, Italy, Spain, The Netherlands, Brazil, Argentina, Colombia, Saudi Arabia, Turkey, South Africa, UAE and Egypt |
| Competitive landscape | Leading Companies, Market Positioning of Companies, Competitive Strategies, and Industry Risks |
Research Analyst Overview
- The subscription services market operates on sophisticated recurring revenue models that extend far beyond simple billing. The entire subscriber lifecycle management process, from acquisition to retention, is under intense analytical scrutiny.
- Leading firms employ churn prediction algorithms to proactively address at-risk accounts, coupled with automated dunning management and flexible subscriber grace periods to minimize involuntary churn, with some achieving a 20% reduction in such losses. Central to this is the technology stack, including cloud-based billing platforms that enable complex usage-based pricing models and metered billing.
- Strategic decisions in the boardroom now revolve around AI-powered personalization and its impact on product-led growth. This requires seamless payment gateway integration and API-driven subscription logic for pause and resume functionality. As businesses scale, managing multi-tier subscription plans with various coupon and discount engines becomes essential. The operational backbone includes subscription box fulfillment, content entitlement systems, and trial management.
- Ultimately, success is measured through subscription analytics dashboards tracking key metrics like subscriber acquisition cost (SAC), customer lifetime value (CLV), MRR, and ARR, all while ensuring compliance with evolving revenue recognition standards and generating detailed subscription-level reporting.
What are the Key Data Covered in this Subscription Services Market Research and Growth Report?
-
What is the expected growth of the Subscription Services Market between 2026 and 2030?
-
USD 463.2 billion, at a CAGR of 17.8%
-
-
What segmentation does the market report cover?
-
The report is segmented by Service (Video streaming, Digital content, and Audio streaming), Type (Paid, and Free), Platform (Mobile devices, Desktops and laptops, Gaming consoles, Smart TVs, and Others) and Geography (North America, APAC, Europe, South America, Middle East and Africa)
-
-
Which regions are analyzed in the report?
-
North America, APAC, Europe, South America and Middle East and Africa
-
-
What are the key growth drivers and market challenges?
-
Increasing demand for convenience and personalization, Subscription fatigue and churn
-
-
Who are the major players in the Subscription Services Market?
-
Amazon.com Inc., Apple Inc., Baidu Inc., Boomplay, Deezer SA, Discovery Inc., Entertainment Network India Ltd., Eros Digital FZE, Hulu LLC, Lions Gate Entertainment Corp., MAX, Netflix Inc., Pandora Media Inc., Paramount, Peacock TV LLC, Spotify Technology SA, Tencent Holdings Ltd., The Walt Disney Co., TIDAL Music AS and XANDRIE SA
-
Market Research Insights
- The subscription services market is defined by rapid evolution and intense competition, where success hinges on sophisticated operational strategies. Effective customer retention strategies are paramount, as firms leveraging advanced analytics report up to a 15% higher retention rate compared to their peers.
- The adoption of specialized subscription management platforms is critical for scaling operations, with many B2B subscription services achieving a 90% reduction in billing errors through automation. This dynamic environment sees a convergence of SaaS subscription metrics with D2C subscription models, as businesses across sectors from media subscription platforms to gaming subscription services adopt these frameworks.
- As the market matures, optimizing the customer journey through data-driven insights and flexible offerings will separate the leaders from the laggards.
We can help! Our analysts can customize this subscription services market research report to meet your requirements.
 RIA -
RIA - 
