Defense IT Spending Market Size 2025-2029
The defense IT spending market size is valued to increase by USD 26.01 billion, at a CAGR of 4.7% from 2024 to 2029. Development of autonomous systems will drive the defense it spending market.
Major Market Trends & Insights
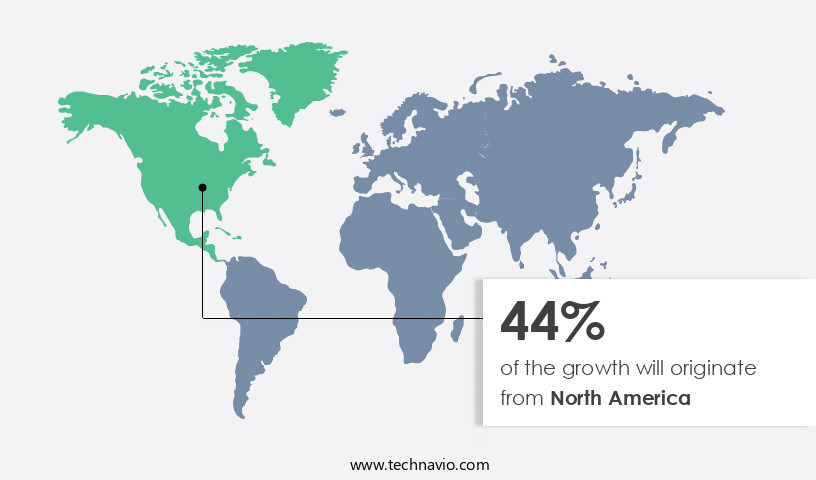
- North America dominated the market and accounted for a 44% growth during the forecast period.
- By Type - Service segment was valued at USD 33.88 billion in 2023
- By Application - Cyber security segment accounted for the largest market revenue share in 2023
Market Size & Forecast
- Market Opportunities: USD 49.98 billion
- Market Future Opportunities: USD 26.01 billion
- CAGR from 2024 to 2029 : 4.7%
Market Summary
- The market represents a significant investment in advanced technologies that fortify national security infrastructure. According to recent data, this market is projected to surpass USD1 trillion by 2025, fueled by the increasing adoption of autonomous systems, artificial intelligence (AI), and machine learning (ML) in defense applications. These technologies enable enhanced situational awareness, improved decision-making, and automated response capabilities, making them indispensable in defense contexts. However, the market also faces challenges, including ensuring digital sovereignty and addressing the ethical implications of advanced technologies in military applications. Digital sovereignty, or the ability to control and protect digital assets, becomes increasingly important as defense systems become more interconnected and reliant on third-party providers.
- Furthermore, the ethical implications of AI and ML in defense contexts, such as the potential for autonomous weapons, necessitate ongoing dialogue and regulation. Despite these challenges, the market's evolution continues to be driven by the need for advanced technologies to maintain a technological edge and protect national security interests. As defense organizations continue to invest in these technologies, they must navigate the complex landscape of digital sovereignty and ethical considerations to ensure their long-term success.
What will be the Size of the Defense IT Spending Market during the forecast period?

Get Key Insights on Market Forecast (PDF) Request Free Sample
How is the Defense IT Spending Market Segmented ?
The defense it spending industry research report provides comprehensive data (region-wise segment analysis), with forecasts and estimates in "USD billion" for the period 2025-2029, as well as historical data from 2019-2023 for the following segments.
- Type
- Service
- Software
- Hardware
- Application
- Cyber security
- IT infrastructure
- Logistic and asset management
- Others
- Force
- Defense forces
- Civilian forces
- Deployment Type
- On-Premises
- Cloud-Based
- Geography
- North America
- US
- Mexico
- Europe
- France
- Germany
- Italy
- Spain
- UK
- Middle East and Africa
- UAE
- APAC
- Australia
- China
- India
- Japan
- South Korea
- South America
- Brazil
- Rest of World (ROW)
- North America
By Type Insights
The service segment is estimated to witness significant growth during the forecast period.
The market is a dynamic and ever-evolving landscape, with defense organizations worldwide investing significantly in various IT services to ensure mission critical systems remain secure and optimized. According to recent reports, The market is projected to reach a value of USD120.3 billion by 2026, growing at a CAGR of 5.1% during the forecast period. Key service segments in this market include contract negotiation, program management office, acquisition processes, compliance frameworks, and business continuity. Defense firms prioritize threat intelligence platforms and incident response planning to enhance cybersecurity infrastructure and mitigate risks. Cloud computing adoption, IT budget allocation, and hardware procurement lifecycle are essential aspects of resource optimization.
Moreover, the integration of devsecops implementation, data analytics platforms, and system upgrades enables better performance benchmarking and cost-benefit analysis. IT modernization initiatives, including digital transformation, technology refresh cycles, and supply chain security, are crucial for enterprise resource planning and system integration services. Risk assessment methodologies, disaster recovery, capacity planning, and cyber resilience strategies are integral components of maintaining information assurance. Network security protocols, software defined networking, artificial intelligence defense, and system upgrades ensure cybersecurity infrastructure remains robust and adaptive. In conclusion, the market encompasses a wide range of services that cater to the unique needs of defense organizations. From consulting services and systems integration to compliance frameworks and cybersecurity infrastructure, these investments are essential for maintaining mission-critical systems and ensuring operational readiness.

The Service segment was valued at USD 33.88 billion in 2019 and showed a gradual increase during the forecast period.

Regional Analysis
North America is estimated to contribute 44% to the growth of the global market during the forecast period.Technavio's analysts have elaborately explained the regional trends and drivers that shape the market during the forecast period.
See How Defense IT Spending Market Demand is Rising in North America Request Free Sample
The market in North America encompasses the investments made by defense organizations and agencies in IT products and services within the region. With the presence of significant defense entities like the United States Department of Defense (DoD), this market holds substantial significance. The primary driver for defense IT spending is the escalating demand for advanced technologies to counteract escalating security threats.
The North American market experiences growth due to the increasing implementation of cloud computing, big data analytics, artificial intelligence, and cybersecurity solutions. Defense organizations' modernization initiatives and the necessity for efficient and effective decision-making tools further fuel the market expansion during the forecast period.
Market Dynamics
Our researchers analyzed the data with 2024 as the base year, along with the key drivers, trends, and challenges. A holistic analysis of drivers will help companies refine their marketing strategies to gain a competitive advantage.
The market is experiencing significant growth as governments and military organizations worldwide invest in modernizing their IT infrastructure to enhance security and operational efficiency. One of the key areas of focus is defense IT spending on cloud migration, enabling agility and cost savings through the use of cloud services. AI-driven cybersecurity threat detection is another priority, as organizations seek to improve their ability to identify and respond to cyber threats in real-time. DevSecOps implementation is also a critical aspect of defense IT spending, ensuring that security is integrated into the development process from the outset. Improving IT system performance metrics and optimizing infrastructure costs are ongoing concerns, with data center consolidation strategies and network security protocol implementation playing key roles. Effective cybersecurity risk assessment is essential for defense organizations, and supply chain risk management is increasingly recognized as a critical component of cybersecurity strategy. Defense IT budget allocation processes are undergoing transformation to ensure effective use of resources, with zero trust security architecture and cybersecurity awareness training programs becoming standard. Evaluating cloud service providers and implementing IT governance frameworks are crucial steps in ensuring IT operational efficiency and security. Defense IT system integration challenges continue to be a significant hurdle, requiring careful planning and execution. Big data analytics for defense applications and software-defined networking deployments are also driving innovation in the market. Overall, the focus on enhancing cybersecurity incident response and improving IT governance is driving significant growth in the market.

What are the key market drivers leading to the rise in the adoption of Defense IT Spending Industry?
- The development of autonomous systems serves as the primary catalyst for market growth.
- The market experiences significant momentum due to the integration of autonomous systems. Autonomous systems, characterized by their ability to perform functions independently, encompass autonomous weaponry, unmanned ground vehicles (UGVs), unmanned aerial vehicles (UAVs), and surveillance systems. Defense organizations worldwide recognize the potential benefits of these systems, which include operational efficiency, risk reduction, heightened situational awareness, and enhanced accuracy and precision in military operations.
- Consequently, a substantial portion of IT budgets is being dedicated to the development and implementation of autonomous systems, underpinning the market's continuous evolution.
What are the market trends shaping the Defense IT Spending Industry?
- The adoption of artificial intelligence (AI) and machine learning (ML) is becoming increasingly mandated in the market trend. These advanced technologies are set to reshape industries and enhance business operations.
- The market is experiencing a significant surge in the adoption of artificial intelligence (AI) and machine learning (ML) technologies. These innovations are increasingly recognized by governments and defense organizations as essential tools for bolstering military capabilities, optimizing decision-making processes, and safeguarding national security. One of the primary drivers of this trend is the development of autonomous systems, such as robotic systems, unmanned vehicles, and drones. By employing AI and ML algorithms, these autonomous systems can execute critical military tasks without human intervention. They excel in target detection, surveillance, and reconnaissance, as well as combat operations.
- Furthermore, AI and ML are instrumental in enhancing situational awareness, enabling real-time threat analysis, and improving overall operational efficiency. Another factor fueling the adoption of AI and ML in defense IT spending is the potential to streamline complex processes and reduce human error. These technologies can analyze vast amounts of data quickly and accurately, providing valuable insights for strategic planning and tactical operations. Moreover, AI and ML can assist in predictive maintenance, ensuring that defense equipment remains operational and effective. In conclusion, the market is witnessing a continuous evolution as AI and ML technologies become increasingly integrated into military operations.
- The potential benefits of these innovations are vast, ranging from autonomous systems and enhanced situational awareness to improved operational efficiency and reduced human error. As defense organizations worldwide embrace these technologies, the future of military capabilities and national security is poised for significant advancements.
What challenges does the Defense IT Spending Industry face during its growth?
- Digital sovereignty issues pose a significant challenge to the growth of the industry, as companies navigate the complexities of data ownership, security, and regulation in the digital age.
- The integration of advanced technologies like augmented reality in defense systems necessitates stringent data security measures due to the sensitivity of military information. The challenge of maintaining digital sovereignty arises when international defense IT spending involves frequent cross-border data transfers, with foreign technology providers supplying essential IT systems and infrastructure. This dependency can compromise digital sovereignty by limiting ownership and control over critical military capabilities. To address this issue, investing in domestic defense IT capabilities is crucial, but it requires substantial time and financial resources. According to recent trends, there is a significant shift towards indigenous IT solutions in defense sectors worldwide.
- For instance, the adoption of cloud technologies within defense organizations has increased by over 20% in the last two years. This trend underscores the importance of localizing IT infrastructure to ensure data security and sovereignty. Simultaneously, collaborations between governments and domestic tech companies are on the rise, fostering innovation and capability development within national borders.
Exclusive Technavio Analysis on Customer Landscape
The defense it spending market forecasting report includes the adoption lifecycle of the market, covering from the innovator's stage to the laggard's stage. It focuses on adoption rates in different regions based on penetration. Furthermore, the defense it spending market report also includes key purchase criteria and drivers of price sensitivity to help companies evaluate and develop their market growth analysis strategies.

Customer Landscape of Defense IT Spending Industry
Competitive Landscape
Companies are implementing various strategies, such as strategic alliances, defense it spending market forecast, partnerships, mergers and acquisitions, geographical expansion, and product/service launches, to enhance their presence in the industry.
Accenture - This company specializes in defense IT services, focusing on improving military personnel's analytics capabilities and increasing the utilization of digital applications within the defense sector. By leveraging advanced technologies, they enable more effective and efficient decision-making in national security environments.
The industry research and growth report includes detailed analyses of the competitive landscape of the market and information about key companies, including:
- Accenture
- BAE Systems
- Boeing
- CACI International
- Dell Technologies
- General Dynamics
- IBM
- Leidos
- Lockheed Martin
- Microsoft
- Northrop Grumman
- Palantir Technologies
- Raytheon Technologies
- SAIC
- Salesforce
- SAP
- Thales Group
- Amazon Web Services
- Cisco Systems
- L3Harris Technologies
Qualitative and quantitative analysis of companies has been conducted to help clients understand the wider business environment as well as the strengths and weaknesses of key industry players. Data is qualitatively analyzed to categorize companies as pure play, category-focused, industry-focused, and diversified; it is quantitatively analyzed to categorize companies as dominant, leading, strong, tentative, and weak.
Recent Development and News in Defense IT Spending Market
- In January 2024, IBM and Microsoft announced a strategic partnership to offer joint solutions for the defense sector, integrating IBM's Red Hat OpenShift and Microsoft's Azure for secure hybrid cloud environments (IBM Press Release, 2024).
- In March 2024, Palo Alto Networks acquired the cybersecurity firm, Evident.Io, to strengthen its cloud-native security offerings, marking a significant investment in the defense IT security segment (Palo Alto Networks Press Release, 2024).
- In April 2025, Amazon Web Services (AWS) secured a USD1 billion contract from the U.S. Department of Defense to provide cloud services, marking a major milestone in the adoption of cloud computing in defense IT infrastructure (Reuters, 2025).
- In May 2025, Raytheon Technologies and Microsoft announced a collaboration to develop an advanced data analytics platform for the defense sector, aiming to improve situational awareness and operational efficiency (Raytheon Technologies Press Release, 2025). These developments underscore the growing importance of cloud computing, strategic partnerships, and advanced technologies in the market.
Dive into Technavio's robust research methodology, blending expert interviews, extensive data synthesis, and validated models for unparalleled Defense IT Spending Market insights. See full methodology.
|
Market Scope |
|
|
Report Coverage |
Details |
|
Page number |
206 |
|
Base year |
2024 |
|
Historic period |
2019-2023 |
|
Forecast period |
2025-2029 |
|
Growth momentum & CAGR |
Accelerate at a CAGR of 4.7% |
|
Market growth 2025-2029 |
USD 26.01 billion |
|
Market structure |
Fragmented |
|
YoY growth 2024-2025(%) |
4.4 |
|
Key countries |
US, China, Germany, Japan, UK, Australia, India, France, Brazil, UAE, Rest of World (ROW), Saudi Arabia, France, South Korea, Mexico, Italy, and Spain |
|
Competitive landscape |
Leading Companies, Market Positioning of Companies, Competitive Strategies, and Industry Risks |
Research Analyst Overview
- The market continues to evolve, driven by the ever-evolving threat landscape and the need for advanced technology solutions. Threat intelligence platforms play a crucial role in identifying and mitigating potential risks, while contract negotiation and program management offices ensure efficient resource allocation and compliance with various frameworks. Business continuity and disaster recovery plans are essential components of any IT strategy, with capacity planning and data center optimization key to ensuring mission-critical systems remain operational. Cloud computing adoption and software-defined networking are transforming the way organizations approach IT infrastructure, leading to significant cost savings and increased agility.
- Acquisition processes and IT modernization initiatives are ongoing priorities, with cybersecurity infrastructure and risk assessment methodologies critical to protecting sensitive data. DevSecOps implementation and incident response planning are also essential components of a robust IT strategy, with security information events and IT budget allocation key to maintaining a strong cybersecurity posture. Big data management and data analytics platforms are increasingly important for gaining insights and making informed decisions, while resource optimization and system integration services help organizations maximize the value of their IT investments. Cyber resilience strategies and system upgrades are also crucial for maintaining a strong IT infrastructure in the face of evolving threats.
- According to industry reports, the market is expected to grow by over 5% annually in the coming years, driven by the ongoing adoption of advanced technologies and the need for enhanced cybersecurity solutions. For instance, a large defense contractor reported a 15% increase in sales due to the implementation of a new threat intelligence platform and IT modernization initiatives.
What are the Key Data Covered in this Defense IT Spending Market Research and Growth Report?
-
What is the expected growth of the Defense IT Spending Market between 2025 and 2029?
-
USD 26.01 billion, at a CAGR of 4.7%
-
-
What segmentation does the market report cover?
-
The report is segmented by Type (Service, Software, and Hardware), Application (Cyber security, IT infrastructure, Logistic and asset management, and Others), Geography (North America, APAC, Europe, Middle East and Africa, and South America), Force (Defense forces and Civilian forces), and Deployment Type (On-Premises and Cloud-Based)
-
-
Which regions are analyzed in the report?
-
North America, APAC, Europe, Middle East and Africa, and South America
-
-
What are the key growth drivers and market challenges?
-
Development of autonomous systems, Issues related to digital sovereignty
-
-
Who are the major players in the Defense IT Spending Market?
-
Accenture, BAE Systems, Boeing, CACI International, Dell Technologies, General Dynamics, IBM, Leidos, Lockheed Martin, Microsoft, Northrop Grumman, Palantir Technologies, Raytheon Technologies, SAIC, Salesforce, SAP, Thales Group, Amazon Web Services, Cisco Systems, and L3Harris Technologies
-
Market Research Insights
- The market is a continually evolving landscape, encompassing various areas such as compliance audits, database security, penetration testing, software assurance, and zero trust architecture, among others. According to recent reports, the market for IT governance frameworks and strategic planning is projected to grow by 5% annually over the next five years. For instance, a leading organization in the financial sector reported a 10% increase in sales due to the implementation of advanced automation technologies and improved vulnerability management. This growth is driven by the increasing demand for enhanced security posture, including cloud security, IT governance, and system monitoring tools.
- Additionally, the adoption of cost reduction strategies, operational efficiency, and resource allocation are key factors fueling the market's expansion. Data governance, risk mitigation, and identity access management are also critical components, with data encryption methods and hardware upgrades playing essential roles in securing sensitive information.
We can help! Our analysts can customize this defense it spending market research report to meet your requirements.