Low Calorie Snacks Market Analysis North America, Europe, APAC, South America, Middle East and Africa - US, China, Germany, UK, Japan - Size and Forecast 2024-2028

Low Calorie Snacks Market Analysis North America, Europe, APAC, South America, Middle East and Africa - US, China, Germany, UK, Japan - Size and Forecast 2024-2028

Published: Aug 2024 158 Pages SKU: IRTNTR73690

Market Overview at a Glance

$3.50 B
Market Opportunity
4.5%
CAGR
4.23
YoY growth 2023-2024(%)

Low Calorie Snacks Market Size 2024-2028 

The low calorie snacks market size is forecast to increase by USD 3.5 billion at a CAGR of 4.5% between 2023 and 2028.

  • The market is experiencing significant growth due to shifting consumer preferences towards healthier options. The trend towards healthy snacking is on the rise, with consumers increasingly opting for low calorie alternatives to traditional high-calorie snacks such as ice cream, cakes, pastries, and muffins. This shift is driven in part by concerns over obesity and other health issues. Additionally, the availability of alternative low calorie snack options, such as fruits and vegetables, is contributing to the market's growth. However, the use of artificial preservatives in many low calorie snacks may be a challenge for some consumers, who prefer natural and organic options. Regenerative agriculture, which focuses on sustainable farming practices, is gaining popularity and may provide opportunities for companies to differentiate themselves in the market. New Cultures, a leading provider of plant-based snacks, is one company that is capitalizing on this trend by offering a range of low calorie, natural, and organic snack options to consumers.

What will be the Size of the Market During the Forecast Period?

Low Calorie Snacks Market Size

 Request Free Sample

  • The snack industry in the United States has witnessed a significant shift towards healthier options in response to the growing awareness of dietary needs and health concerns. The demand for low calorie snacks has risen, particularly among consumers following gluten-free, vegan, organic, and plant-based diets due to their association with various health benefits. Ancient grains, such as quinoa, amaranth, and teff, have gained popularity as innovative healthy snack options due to their high nutritional value and low calorie count. These grains are rich in fiber, protein, and essential minerals, making them an ideal choice for individuals with diabetes, heart disease, or hypertension.
  • Superfoods, including chia seeds, goji berries, and nuts, have also emerged as popular low calorie snack options. These functional ingredients offer numerous health benefits, such as improved digestion, enhanced energy levels, and a boosted immune system. Probiotics, another functional ingredient, have gained traction as they support gut health and aid in digestion. The trend towards plant-based diets and veganism has further fueled the demand for low-calorie snacks. Nuts and seeds, which are naturally vegan and gluten-free, have become staple snack items. Grain-free alternatives, such as rice cakes and corn chips, have also gained popularity among consumers looking to reduce their calorie intake.

How is this market segmented and which is the largest segment?

The market research report provides comprehensive data (region-wise segment analysis), with forecasts and estimates in "USD million" for the period 2024-2028, as well as historical data from 2018-2022 for the following segments.

  • Distribution Channel
    • Offline distribution
    • Online distribution
  • Product
    • Sweet snacks
    • Savory snacks
  • Geography
    • North America
      • US
    • Europe
      • Germany
      • UK
    • APAC
      • China
      • Japan
    • South America
    • Middle East and Africa

By Distribution Channel Insights

  • The offline distribution segment is estimated to witness significant growth during the forecast period.

The market for innovative, low calorie snacks continues to gain traction as consumers seek healthier options. Ancient grains, superfoods, plant-based proteins, functional ingredients, probiotics, and adaptogens are popular trends in this sector. Supermarkets and hypermarkets serve as the primary distribution channels for these snacks in the offline segment. The expansion of the organized retail industry in the country has contributed significantly to the growth of low calorie snack sales. Supermarkets and hypermarkets offer ample shelf space and storage capacity, enabling a wide range of low calorie snack companies to showcase their products. Consumers appreciate the convenience of finding a diverse selection of products under one roof, making these large retail stores a preferred choice. Additionally, bulk purchases at these stores often result in discounts and free products, further encouraging sales.

Low Calorie Snacks Market Size

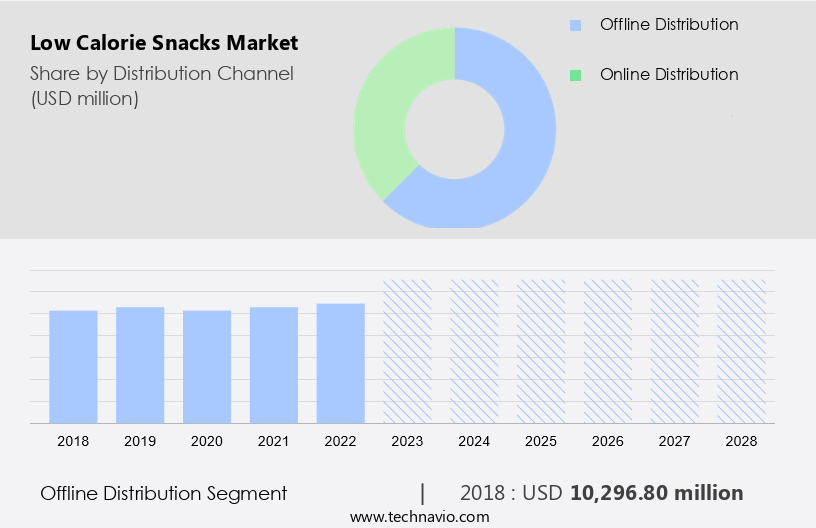
Get a glance at the market report of share of various segments Request Free Sample

The offline distribution segment was valued at USD 10.29 billion in 2018 and showed a gradual increase during the forecast period.
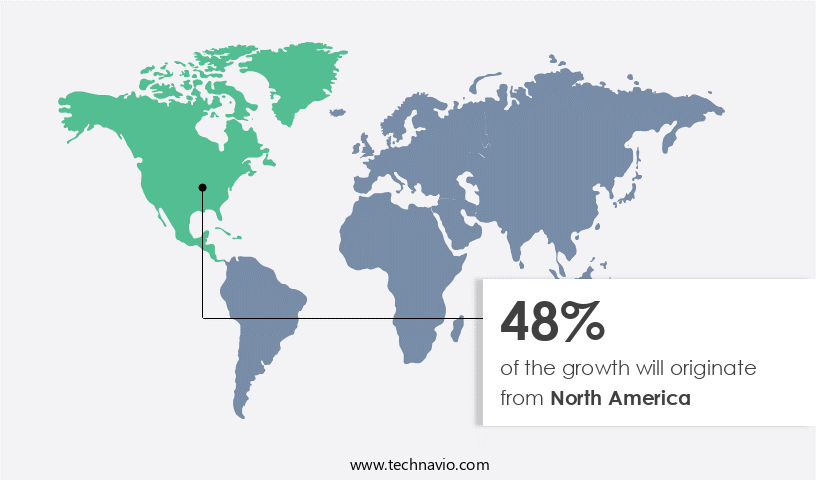
Regional Analysis

  • North America is estimated to contribute 48% to the growth of the global market during the forecast period.

Technavio's analysts have elaborately explained the regional trends and drivers that shape the market during the forecast period.

Low Calorie Snacks Market Share by Geography

For more insights on the market share of various regions Request Free Sample

The North American region dominates The market due to several factors, including an increasing number of dual-income households, rising disposable income, and the presence of numerous fast-food chains. The United States is the largest market in North America, with consumers frequently eating out and seeking convenient, on-the-go snack options. Additionally, Mexico exhibits significant growth potential due to its expanding millennial population, evolving consumer lifestyles, and increasing number of retail outlets. Protein intake is a crucial consideration for many consumers in the market. As a result, gluten-free and organic snacks, which often contain high protein content, are gaining popularity.

Furthermore, premium products, such as protein bars and chips, are increasingly being sought after in both conventional and hypermarket retailers. Moreover, there is a growing trend towards environmentally friendly food production and packaging, which is driving demand for sustainable snack options.

Market Dynamics

Our researchers analyzed the data with 2023 as the base year, along with the key drivers, trends, and challenges. A holistic analysis of drivers will help companies refine their marketing strategies to gain a competitive advantage.

What are the key market drivers leading to the rise in the adoption of Low Calorie Snacks Market?

Changing consumer tastes and preferences is the key driver of the market.

  • The market is driven by consumer demand for flavorful and natural options. Innovation in the creation of savory snacks, such as corn puffs and pea pops, is essential for market players to retain existing customers and attract new ones. Consumers, particularly the younger demographic, are always seeking novelty and are increasingly interested in trying new low calorie snacks. To meet this demand, manufacturers expand their product lines, introduce new items, and launch new brands. The market's longevity hinges on continuous product development and innovation, and the global low calorie snacks industry is no exception. In the market, the supply chain for low calorie snacks involves various stages from sourcing raw materials to packaging and distribution.
  • Packaging types for these snacks vary, with an increasing trend towards eco-friendly and reusable options. Business-to-consumer (B2C) sales, specialty stores, and online platforms are the primary channels for low calorie snack distribution. Malls and other retail establishments also offer a significant presence for these products. Monitor and analyze website performance using tools like Google Analytics to identify areas for improvement.

What are the market trends shaping the low-calorie snack market?

The rising trend of healthy snacking is the upcoming trend in the market.

  • The disposable income of individuals has witnessed significant growth both in developed and developing economies. This trend is not exclusive to the US, as the Organization for Economic Co-operation and Development (OECD) states that household disposable income has risen in all member countries since 2021.
  • Factors contributing to this growth include the rise in dual household income, per capita income, and a strong employment market. As disposable income increases, consumers' purchasing power expands, leading to potential growth in spending in various sectors, including the animal-free dairy snacks market.

What challenges does Low Calorie Snacks Market face during the growth?

Availability of other substitutes is a key challenge affecting the market growth.

  • Consumers' preferences for snacks that offer more energy and nutrition have led to an increasing demand for high calorie options. However, for individuals with medical conditions or those struggling with malnutrition, high calorie snacks are a necessity. Even fitness enthusiasts, such as weightlifters, incorporate high calorie, nutrient-dense snacks into their diets to build muscle or enhance endurance. For those who find it challenging to consume enough calories without feeling overly full, snacking on calorie-rich options between meals is an effective solution.
  • Daily caloric intake needs to exceed energy expenditure for weight gain. Low calorie snacks, such as ice cream, cakes, pastries, and muffins, while popular, may not provide the necessary nutrients and calories for optimal health. The shift towards healthier, more sustainable food production methods, like regenerative agriculture, may influence the snack market in the future.

Exclusive Customer Landscape

The market forecasting report includes the adoption lifecycle of the market, covering from the innovator's stage to the laggard's stage. It focuses on adoption rates in different regions based on penetration. Furthermore, the market report also includes key purchase criteria and drivers of price sensitivity to help companies evaluate and develop their market growth analysis strategies.
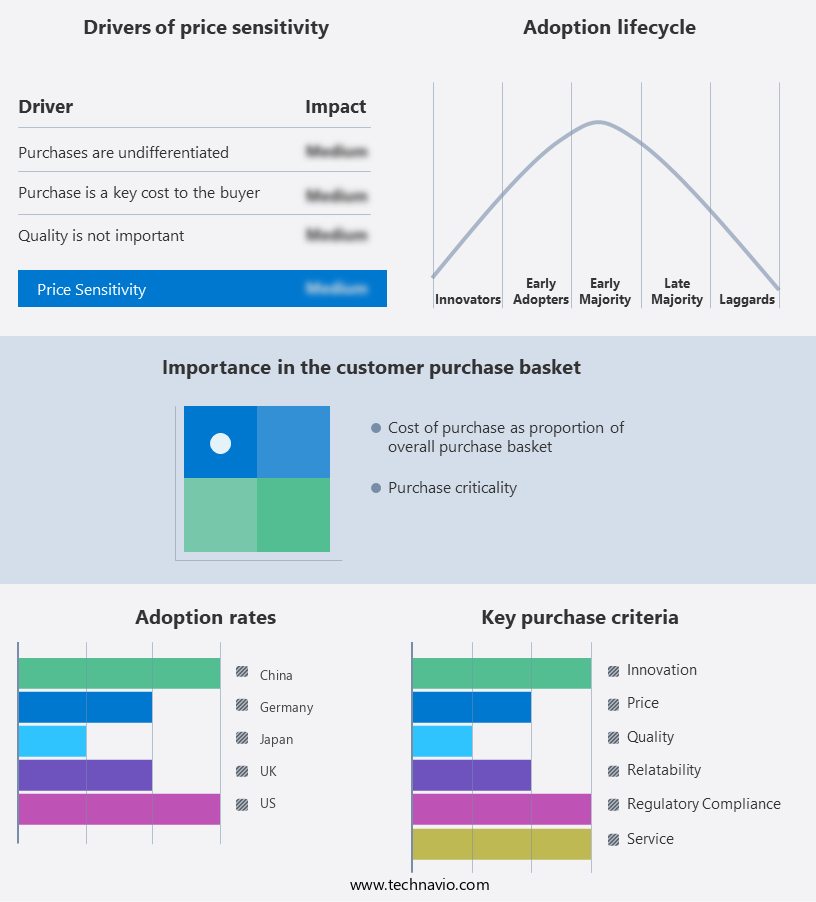
Low Calorie Snacks Market Share by Geography

 Customer Landscape

Key Companies & Market Insights

Companies are implementing various strategies, such as strategic alliances, market forecast , partnerships, mergers and acquisitions, geographical expansion, and product/service launches, to enhance their presence in the market.

The market research and growth report includes detailed analyses of the competitive landscape of the market and information about key companies, including:

  • Ajinomoto Co. Inc.
  • Archer Daniels Midland Co.
  • Beneo GmbH
  • Bernard Food Industries
  • Calbee Inc.
  • Cargill Inc.
  • Conagra Brands Inc.
  • Danone SA
  • Dole plc
  • General Mills Inc.
  • Ingredion Inc.
  • Mondelez International Inc.
  • Nestle SA
  • PepsiCo Inc.
  • Roast Way Foods
  • The Hain Celestial Group Inc.
  • Tyson Foods Inc.
  • Warrell Corp.

Qualitative and quantitative analysis of companies has been conducted to help clients understand the wider business environment as well as the strengths and weaknesses of key market players. Data is qualitatively analyzed to categorize companies as pure play, category-focused, industry-focused, and diversified; it is quantitatively analyzed to categorize companies as dominant, leading, strong, tentative, and weak.

Research Analyst Overview

The market is witnessing significant growth due to the increasing awareness and adoption of healthy eating habits. With a focus on diets such as gluten-free, vegan, organic, and plant-based, consumers are seeking innovative healthy snack options. Ancient grains, superfoods, and plant-based proteins are popular choices for those following these dietary trends. Functional ingredients like probiotics, adaptogens, and power ingredients are also gaining popularity for their health benefits. The pandemic has led to a shift in food habits, with an increase in home cooking and online sales. Food companies are responding by offering low calorie snacks in various packaged forms, including fruits, nuts, seeds, and baked goods.

Furthermore, these snacks are free from artificial additives, preservatives, and allergens, making them suitable for individuals with specific dietary requirements. The market is diverse, with offerings ranging from sweet snacks like ice cream, cakes, and pastries to savory options like muffins and grain-free alternatives. Premium products made from artisanal and specialty bakery items are also gaining traction. Consumers are increasingly conscious of the environmental impact of their food choices, leading to a preference for environment-friendly food and supply chain practices. The market for low calorie snacks is expected to continue growing as consumers prioritize their health and well-being.

Market Scope

Report Coverage

Details

Page number

158

Base year

2023

Historic period

2018-2022

Forecast period

2024-2028

Growth momentum & CAGR

Accelerate at a CAGR of 4.5%

Market Growth 2024-2028

USD 3.50 billion

Market structure

Fragmented

YoY growth 2023-2024(%)

4.23

Key countries

US, China, Germany, UK, and Japan

Competitive landscape

Leading Companies, Market Positioning of Companies, Competitive Strategies, and Industry Risks

Request Free Sample

What are the Key Data Covered in this Market Research and Growth Report?

  • CAGR of the market during the forecast period
  • Detailed information on factors that will drive the market growth and forecasting between 2024 and 2028
  • Precise estimation of the size of the market  and its contribution of the market in focus to the parent market
  • Accurate predictions about upcoming market growth and trends and changes in consumer behaviour
  • Growth of the market across North America, Europe, APAC, South America, and Middle East and Africa
  • Thorough analysis of the market's competitive landscape and detailed information about companies
  • Comprehensive analysis of factors that will challenge the growth of market companies

We can help! Our analysts can customize this market research report to meet your requirements. Get in touch

1 Executive Summary

  • 1.1 Market overview
    • Executive Summary - Chart on Market Overview
    • Executive Summary - Data Table on Market Overview
    • Executive Summary - Chart on Global Market Characteristics
    • Executive Summary - Chart on Market by Geography
    • Executive Summary - Chart on Market Segmentation by Distribution Channel
    • Executive Summary - Chart on Market Segmentation by Product
    • Executive Summary - Chart on Incremental Growth
    • Executive Summary - Data Table on Incremental Growth
    • Executive Summary - Chart on Company Market Positioning

2 Market Landscape

  • 2.1 Market ecosystem
    • Parent Market
    • Data Table on - Parent Market
  • 2.2 Market characteristics
    • Market characteristics analysis
  • 2.3 Value chain analysis
    • Value Chain Analysis

3 Market Sizing

  • 3.1 Market definition
    • Offerings of companies included in the market definition
  • 3.2 Market segment analysis
    • Market segments
  • 3.3 Market size 2023
    • 3.4 Market outlook: Forecast for 2023-2028
      • Chart on Global - Market size and forecast 2023-2028 ($ million)
      • Data Table on Global - Market size and forecast 2023-2028 ($ million)
      • Chart on Global Market: Year-over-year growth 2023-2028 (%)
      • Data Table on Global Market: Year-over-year growth 2023-2028 (%)

    4 Historic Market Size

    • 4.1 Global Low Calorie Snacks Market 2018 - 2022
      • Historic Market Size - Data Table on Global Low Calorie Snacks Market 2018 - 2022 ($ million)
    • 4.2 Distribution Channel segment analysis 2018 - 2022
      • Historic Market Size - Distribution Channel Segment 2018 - 2022 ($ million)
    • 4.3 Product segment analysis 2018 - 2022
      • Historic Market Size - Product Segment 2018 - 2022 ($ million)
    • 4.4 Geography segment analysis 2018 - 2022
      • Historic Market Size - Geography Segment 2018 - 2022 ($ million)
    • 4.5 Country segment analysis 2018 - 2022
      • Historic Market Size - Country Segment 2018 - 2022 ($ million)

    5 Five Forces Analysis

    • 5.1 Five forces summary
      • Five forces analysis - Comparison between 2023 and 2028
    • 5.2 Bargaining power of buyers
      • Bargaining power of buyers - Impact of key factors 2023 and 2028
    • 5.3 Bargaining power of suppliers
      • Bargaining power of suppliers - Impact of key factors in 2023 and 2028
    • 5.4 Threat of new entrants
      • Threat of new entrants - Impact of key factors in 2023 and 2028
    • 5.5 Threat of substitutes
      • Threat of substitutes - Impact of key factors in 2023 and 2028
    • 5.6 Threat of rivalry
      • Threat of rivalry - Impact of key factors in 2023 and 2028
    • 5.7 Market condition
      • Chart on Market condition - Five forces 2023 and 2028

    6 Market Segmentation by Distribution Channel

    • 6.1 Market segments
      • Chart on Distribution Channel - Market share 2023-2028 (%)
      • Data Table on Distribution Channel - Market share 2023-2028 (%)
    • 6.2 Comparison by Distribution Channel
      • Chart on Comparison by Distribution Channel
      • Data Table on Comparison by Distribution Channel
    • 6.3 Offline distribution - Market size and forecast 2023-2028
      • Chart on Offline distribution - Market size and forecast 2023-2028 ($ million)
      • Data Table on Offline distribution - Market size and forecast 2023-2028 ($ million)
      • Chart on Offline distribution - Year-over-year growth 2023-2028 (%)
      • Data Table on Offline distribution - Year-over-year growth 2023-2028 (%)
    • 6.4 Online distribution - Market size and forecast 2023-2028
      • Chart on Online distribution - Market size and forecast 2023-2028 ($ million)
      • Data Table on Online distribution - Market size and forecast 2023-2028 ($ million)
      • Chart on Online distribution - Year-over-year growth 2023-2028 (%)
      • Data Table on Online distribution - Year-over-year growth 2023-2028 (%)
    • 6.5 Market opportunity by Distribution Channel
      • Market opportunity by Distribution Channel ($ million)
      • Data Table on Market opportunity by Distribution Channel ($ million)

    7 Market Segmentation by Product

    • 7.1 Market segments
      • Chart on Product - Market share 2023-2028 (%)
      • Data Table on Product - Market share 2023-2028 (%)
    • 7.2 Comparison by Product
      • Chart on Comparison by Product
      • Data Table on Comparison by Product
    • 7.3 Sweet snacks - Market size and forecast 2023-2028
      • Chart on Sweet snacks - Market size and forecast 2023-2028 ($ million)
      • Data Table on Sweet snacks - Market size and forecast 2023-2028 ($ million)
      • Chart on Sweet snacks - Year-over-year growth 2023-2028 (%)
      • Data Table on Sweet snacks - Year-over-year growth 2023-2028 (%)
    • 7.4 Savory snacks - Market size and forecast 2023-2028
      • Chart on Savory snacks - Market size and forecast 2023-2028 ($ million)
      • Data Table on Savory snacks - Market size and forecast 2023-2028 ($ million)
      • Chart on Savory snacks - Year-over-year growth 2023-2028 (%)
      • Data Table on Savory snacks - Year-over-year growth 2023-2028 (%)
    • 7.5 Market opportunity by Product
      • Market opportunity by Product ($ million)
      • Data Table on Market opportunity by Product ($ million)

    8 Customer Landscape

    • 8.1 Customer landscape overview
      • Analysis of price sensitivity, lifecycle, customer purchase basket, adoption rates, and purchase criteria

    9 Geographic Landscape

    • 9.1 Geographic segmentation
      • Chart on Market share by geography 2023-2028 (%)
      • Data Table on Market share by geography 2023-2028 (%)
    • 9.2 Geographic comparison
      • Chart on Geographic comparison
      • Data Table on Geographic comparison
    • 9.3 North America - Market size and forecast 2023-2028
      • Chart on North America - Market size and forecast 2023-2028 ($ million)
      • Data Table on North America - Market size and forecast 2023-2028 ($ million)
      • Chart on North America - Year-over-year growth 2023-2028 (%)
      • Data Table on North America - Year-over-year growth 2023-2028 (%)
    • 9.4 Europe - Market size and forecast 2023-2028
      • Chart on Europe - Market size and forecast 2023-2028 ($ million)
      • Data Table on Europe - Market size and forecast 2023-2028 ($ million)
      • Chart on Europe - Year-over-year growth 2023-2028 (%)
      • Data Table on Europe - Year-over-year growth 2023-2028 (%)
    • 9.5 APAC - Market size and forecast 2023-2028
      • Chart on APAC - Market size and forecast 2023-2028 ($ million)
      • Data Table on APAC - Market size and forecast 2023-2028 ($ million)
      • Chart on APAC - Year-over-year growth 2023-2028 (%)
      • Data Table on APAC - Year-over-year growth 2023-2028 (%)
    • 9.6 South America - Market size and forecast 2023-2028
      • Chart on South America - Market size and forecast 2023-2028 ($ million)
      • Data Table on South America - Market size and forecast 2023-2028 ($ million)
      • Chart on South America - Year-over-year growth 2023-2028 (%)
      • Data Table on South America - Year-over-year growth 2023-2028 (%)
    • 9.7 Middle East and Africa - Market size and forecast 2023-2028
      • Chart on Middle East and Africa - Market size and forecast 2023-2028 ($ million)
      • Data Table on Middle East and Africa - Market size and forecast 2023-2028 ($ million)
      • Chart on Middle East and Africa - Year-over-year growth 2023-2028 (%)
      • Data Table on Middle East and Africa - Year-over-year growth 2023-2028 (%)
    • 9.8 US - Market size and forecast 2023-2028
      • Chart on US - Market size and forecast 2023-2028 ($ million)
      • Data Table on US - Market size and forecast 2023-2028 ($ million)
      • Chart on US - Year-over-year growth 2023-2028 (%)
      • Data Table on US - Year-over-year growth 2023-2028 (%)
    • 9.9 China - Market size and forecast 2023-2028
      • Chart on China - Market size and forecast 2023-2028 ($ million)
      • Data Table on China - Market size and forecast 2023-2028 ($ million)
      • Chart on China - Year-over-year growth 2023-2028 (%)
      • Data Table on China - Year-over-year growth 2023-2028 (%)
    • 9.10 Germany - Market size and forecast 2023-2028
      • Chart on Germany - Market size and forecast 2023-2028 ($ million)
      • Data Table on Germany - Market size and forecast 2023-2028 ($ million)
      • Chart on Germany - Year-over-year growth 2023-2028 (%)
      • Data Table on Germany - Year-over-year growth 2023-2028 (%)
    • 9.11 UK - Market size and forecast 2023-2028
      • Chart on UK - Market size and forecast 2023-2028 ($ million)
      • Data Table on UK - Market size and forecast 2023-2028 ($ million)
      • Chart on UK - Year-over-year growth 2023-2028 (%)
      • Data Table on UK - Year-over-year growth 2023-2028 (%)
    • 9.12 Japan - Market size and forecast 2023-2028
      • Chart on Japan - Market size and forecast 2023-2028 ($ million)
      • Data Table on Japan - Market size and forecast 2023-2028 ($ million)
      • Chart on Japan - Year-over-year growth 2023-2028 (%)
      • Data Table on Japan - Year-over-year growth 2023-2028 (%)
    • 9.13 Market opportunity by geography
      • Market opportunity by geography ($ million)
      • Data Tables on Market opportunity by geography ($ million)

    10 Drivers, Challenges, and Opportunity/Restraints

    • 10.1 Market drivers
      • 10.2 Market challenges
        • 10.3 Impact of drivers and challenges
          • Impact of drivers and challenges in 2023 and 2028
        • 10.4 Market opportunities/restraints

          11 Competitive Landscape

          • 11.1 Overview
            • 11.2 Competitive Landscape
              • Overview on criticality of inputs and factors of differentiation
            • 11.3 Landscape disruption
              • Overview on factors of disruption
            • 11.4 Industry risks
              • Impact of key risks on business

            12 Competitive Analysis

            • 12.1 Companies profiled
              • Companies covered
            • 12.2 Market positioning of companies
              • Matrix on companies position and classification
            • 12.3 Calbee Inc.
              • Calbee Inc. - Overview
              • Calbee Inc. - Product / Service
              • Calbee Inc. - Key offerings
            • 12.4 Conagra Brands Inc.
              • Conagra Brands Inc. - Overview
              • Conagra Brands Inc. - Business segments
              • Conagra Brands Inc. - Key news
              • Conagra Brands Inc. - Key offerings
              • Conagra Brands Inc. - Segment focus
            • 12.5 Danone SA
              • Danone SA - Overview
              • Danone SA - Business segments
              • Danone SA - Key news
              • Danone SA - Key offerings
              • Danone SA - Segment focus
            • 12.6 Dole plc
              • Dole plc - Overview
              • Dole plc - Business segments
              • Dole plc - Key offerings
              • Dole plc - Segment focus
            • 12.7 General Mills Inc.
              • General Mills Inc. - Overview
              • General Mills Inc. - Business segments
              • General Mills Inc. - Key news
              • General Mills Inc. - Key offerings
              • General Mills Inc. - Segment focus
            • 12.8 Mondelez International Inc.
              • Mondelez International Inc. - Overview
              • Mondelez International Inc. - Business segments
              • Mondelez International Inc. - Key news
              • Mondelez International Inc. - Key offerings
              • Mondelez International Inc. - Segment focus
            • 12.9 Nestle SA
              • Nestle SA - Overview
              • Nestle SA - Business segments
              • Nestle SA - Key news
              • Nestle SA - Key offerings
              • Nestle SA - Segment focus
            • 12.10 PepsiCo Inc.
              • PepsiCo Inc. - Overview
              • PepsiCo Inc. - Business segments
              • PepsiCo Inc. - Key news
              • PepsiCo Inc. - Key offerings
              • PepsiCo Inc. - Segment focus
            • 12.11 The Hain Celestial Group Inc.
              • The Hain Celestial Group Inc. - Overview
              • The Hain Celestial Group Inc. - Business segments
              • The Hain Celestial Group Inc. - Key news
              • The Hain Celestial Group Inc. - Key offerings
              • The Hain Celestial Group Inc. - Segment focus
            • 12.12 Tyson Foods Inc.
              • Tyson Foods Inc. - Overview
              • Tyson Foods Inc. - Business segments
              • Tyson Foods Inc. - Key news
              • Tyson Foods Inc. - Key offerings
              • Tyson Foods Inc. - Segment focus

            13 Appendix

            • 13.1 Scope of the report
              • 13.2 Inclusions and exclusions checklist
                • Inclusions checklist
                • Exclusions checklist
              • 13.3 Currency conversion rates for US$
                • Currency conversion rates for US$
              • 13.4 Research methodology
                • Research methodology
              • 13.5 Data procurement
                • Information sources
              • 13.6 Data validation
                • Data validation
              • 13.7 Validation techniques employed for market sizing
                • Validation techniques employed for market sizing
              • 13.8 Data synthesis
                • Data synthesis
              • 13.9 360 degree market analysis
                • 360 degree market analysis
              • 13.10 List of abbreviations
                • List of abbreviations

              Research Methodology

              Technavio presents a detailed picture of the market by way of study, synthesis, and summation of data from multiple sources. The analysts have presented the various facets of the market with a particular focus on identifying the key industry influencers. The data thus presented is comprehensive, reliable, and the result of extensive research, both primary and secondary.

              INFORMATION SOURCES

              Primary sources

              • Manufacturers and suppliers
              • Channel partners
              • Industry experts
              • Strategic decision makers

              Secondary sources

              • Industry journals and periodicals
              • Government data
              • Financial reports of key industry players
              • Historical data
              • Press releases

              DATA ANALYSIS

              Data Synthesis

              • Collation of data
              • Estimation of key figures
              • Analysis of derived insights

              Data Validation

              • Triangulation with data models
              • Reference against proprietary databases
              • Corroboration with industry experts

              REPORT WRITING

              Qualitative

              • Market drivers
              • Market challenges
              • Market trends
              • Five forces analysis

              Quantitative

              • Market size and forecast
              • Market segmentation
              • Geographical insights
              • Competitive landscape

              Interested in this report?

              Get your sample now to see our research methodology and insights!

              Download Now

              Frequently Asked Questions

              Low Calorie Snacks market growth will increase by $ 3500 mn during 2024-2028.

              The Low Calorie Snacks market is expected to grow at a CAGR of 4.5% during 2024-2028.

              Low Calorie Snacks market is segmented by Distribution Channel( Offline distribution, Online distribution) Product( Sweet snacks, Savory snacks)

              Ajinomoto Co. Inc., Archer Daniels Midland Co., Beneo GmbH, Bernard Food Industries, Calbee Inc., Cargill Inc., Conagra Brands Inc., Danone SA, Dole plc, General Mills Inc., Ingredion Inc., Mondelez International Inc., Nestle SA, PepsiCo Inc., Roast Way Foods, The Hain Celestial Group Inc., Tyson Foods Inc., Warrell Corp. are a few of the key vendors in the Low Calorie Snacks market.

              North America will register the highest growth rate of 48% among the other regions. Therefore, the Low Calorie Snacks market in North America is expected to garner significant business opportunities for the vendors during the forecast period.

              US, China, Germany, UK, Japan

              • Changing consumer tastes and preferencesLow calorie savory snacks rely heavily on flavor and source. Continued innovation focused on innovative and intriguing low calorie savory snacks like corn puffs and pea pops will aid key players in retaining loyal consumers while also drawing a new audience. Consumer taste for processed snacks is the driving factor this market.
              • such as low calorie snacks is the driving factor this market.
              • is changing as consumers is the driving factor this market.
              • particularly the youth is the driving factor this market.
              • are keen to try new things and are constantly on the lookout for new items. Manufacturers try to accommodate new items by extending their brands is the driving factor this market.
              • developing new products is the driving factor this market.
              • and launching new brands. Any markets long-term viability depends on continuous product development and innovation is the driving factor this market.
              • and the global low calorie snacks market is no exception. As a result is the driving factor this market.
              • low calorie snack manufacturers are concentrating on launching a variety of snacks with different flavors and ingredients. In addition is the driving factor this market.
              • producers are focusing more on expanding production in response to growing interest in unique styles is the driving factor this market.
              • local products is the driving factor this market.
              • and artisanal flavors. The manufacturers are also aware of the cultural influences of numerous countries and regions. As a result is the driving factor this market.
              • international brands tailor their offerings to suit local preferences is the driving factor this market.
              • which is the driving factor this market.
              • in turn is the driving factor this market.
              • is boosting the growth of the global low calorie snacks market during the forecast period.  is the driving factor this market.

              The Low Calorie Snacks market vendors should focus on grabbing business opportunities from the Offline distribution segment as it accounted for the largest market share in the base year.
              RIA - Research AI Assistant
              Ask RIA