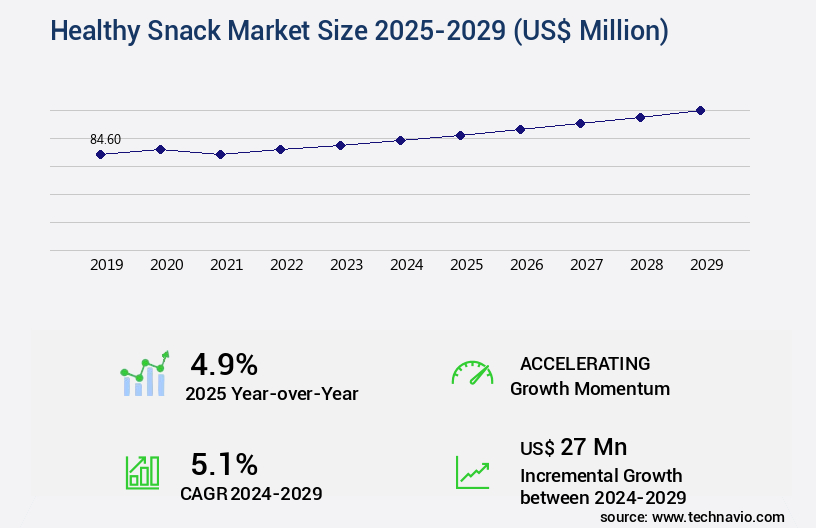
Healthy Snack Market Size 2025-2029
The healthy snack market size is forecast to increase by USD 27 million, at a CAGR of 5.1% between 2024 and 2029.
Major Market Trends & Insights
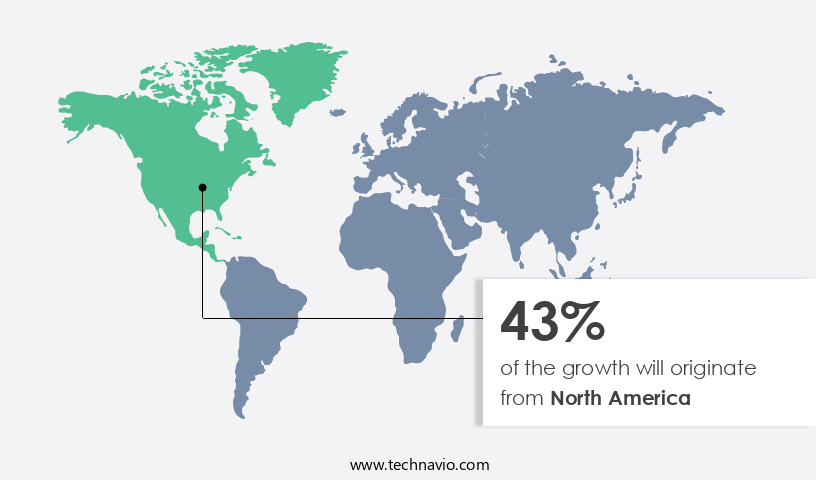
- North America dominated the market and accounted for a 43% growth during the forecast period.
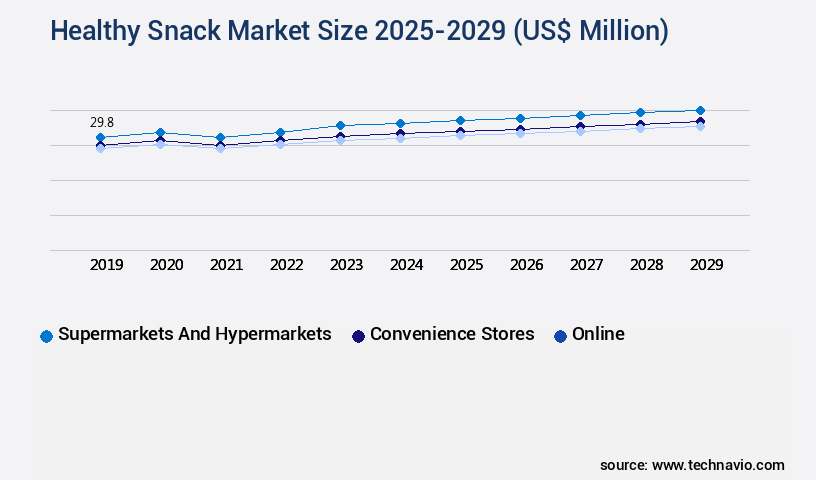
- By the Distribution Channel - Supermarkets and hypermarkets segment was valued at USD 29.80 million in 2023
- By the Product - Savory segment accounted for the largest market revenue share in 2023
Market Size & Forecast
- Market Opportunities: USD 46.10 million
- Market Future Opportunities: USD 27.00 million
- CAGR : 5.1%
- North America: Largest market in 2023
Market Summary
- The market has witnessed significant evolution in recent years, with consumers increasingly prioritizing health and convenience. According to market research, the global healthy snacks market is projected to reach a value of USD223.4 billion by 2027, growing at a steady pace. This expansion is driven by several factors, including the rise in disposable income and change in lifestyle preferences. Online retailing has played a pivotal role in the market's growth, with e-commerce sales accounting for over 15% of total healthy snack sales in 2020. Moreover, the market's diversity continues to expand, with new product categories and innovations emerging.
- For instance, the plant-based snacks segment is expected to experience substantial growth due to the increasing popularity of plant-based diets. Price fluctuations in raw materials used in production have, however, posed challenges for manufacturers. Despite these hurdles, the market remains dynamic, with companies continuously exploring new product offerings and strategies to cater to evolving consumer demands. Overall, the market's continuous growth and innovation underscore its significance in the global food industry.
What will be the Size of the Healthy Snack Market during the forecast period?
Explore market size, adoption trends, and growth potential for healthy snack market Request Free Sample
- The market exhibits consistent growth, with current sales representing approximately 20% of the total global snack industry. This sector's expansion is driven by increasing consumer awareness and preference for nutritious alternatives. Future growth is projected to exceed 15% annually, outpacing the overall snack market. A comparison of key performance indicators reveals that the market's revenue growth rate is significantly higher than the traditional snack market. Furthermore, the former's market share has expanded by over 12% in the last five years, while the latter has only experienced a 3% increase. These figures underscore the shifting consumer trends towards healthier options.
- Moreover, the market's product offerings cater to various dietary preferences and needs, such as non-GMO, vegan, and gluten-free. Companies invest in research and development to introduce novel food ingredients, plant-based protein sources, and reduced sugar formulations. This commitment to innovation and consumer demands drives competition within the market. Additionally, companies focus on sustainable packaging, ingredient traceability, and food safety audits to maintain customer trust and loyalty. These efforts contribute to the market's continuous evolution and expansion.
How is this Healthy Snack Industry segmented?
The healthy snack industry research report provides comprehensive data (region-wise segment analysis), with forecasts and estimates in "USD million" for the period 2025-2029, as well as historical data from 2019-2023 for the following segments.
- Distribution Channel
- Supermarkets and hypermarkets
- Convenience stores
- Online
- Product
- Savory
- Bakery
- Fruit
- Dairy
- Others
- Application
- On-the-Go Snacking
- Meal Replacement
- Pre/Post Workout
- Weight Management
- General Wellness
- Geography
- North America
- US
- Canada
- Europe
- France
- Germany
- Italy
- UK
- Middle East and Africa
- Egypt
- KSA
- Oman
- UAE
- APAC
- China
- India
- Japan
- South America
- Argentina
- Brazil
- Rest of World (ROW)
- North America
By Distribution Channel Insights
The supermarkets and hypermarkets segment is estimated to witness significant growth during the forecast period.
In the dynamic and evolving the market, supermarkets and hypermarkets have emerged as the preferred distribution channels, capturing a significant market share. This trend is driven by several factors. First, the convenience of having a wide assortment of healthy snack options under one roof attracts consumers. Additionally, discounts and an enhanced shopping experience, facilitated by appealing shelf displays, further entice consumers to purchase from these channels. Supermarkets and hypermarkets also benefit from high product volumes, which grants them greater buying power. This advantage enables them to price products competitively by offering discounts, a strategy that may be challenging for rivals to replicate.
Consequently, consumers can enjoy discounted prices on healthy snacks, making supermarkets and hypermarkets the leading distribution segment throughout the forecast period. Manufacturing efficiency plays a crucial role in the market. Brands are increasingly focusing on optimizing their manufacturing processes to reduce costs and improve product quality. Portion control strategies are also gaining popularity as consumers demand smaller, more manageable snack sizes. In response, brands are investing in advanced packaging materials and technologies to ensure consistent portion sizes and extend shelf life. Supply chain optimization is another critical trend in the market. Brands are leveraging data analytics techniques and risk management protocols to streamline their supply chains, ensuring timely delivery of products and minimizing disruptions.
Product formulation is also a significant focus, with brands investing in sensory evaluation methods and nutritional content labeling to cater to diverse consumer preferences. Marketing campaign effectiveness is a key concern for brands in the market. Brands are utilizing various marketing channels, including digital and traditional media, to reach their target audience. Consumer preference testing and sales forecasting models are also essential tools for brands to gauge market trends and tailor their marketing strategies accordingly. Sales channel diversification is another trend in the market. Brands are expanding their reach by exploring new sales channels, such as e-commerce platforms and convenience stores.
Pricing strategies are also evolving, with brands implementing dynamic pricing models to cater to changing market conditions and consumer preferences. Ingredient sourcing is a critical aspect of the market. Brands are increasingly focusing on sourcing high-quality, sustainable, and ethically-sourced ingredients to meet consumer demand for transparency and healthier options. Inventory management systems and nutritional content labeling are also essential for brands to maintain stock levels and meet consumer demand effectively. Micronutrient analysis and shelf life extension are other key trends in the market. Brands are investing in advanced analytical techniques to optimize their product formulations and extend shelf life, ensuring that their products remain fresh and appealing to consumers.
Market research methodologies, calorie density calculation, health claim substantiation, and compliance regulations are also essential areas of focus for brands in the market. In conclusion, the market is a dynamic and evolving industry, with various trends shaping its growth and development. From manufacturing efficiency and supply chain optimization to marketing campaign effectiveness and sales channel diversification, brands are adapting to meet the changing needs and preferences of consumers. By focusing on these trends and investing in innovative technologies and strategies, brands can effectively compete and thrive in the market.
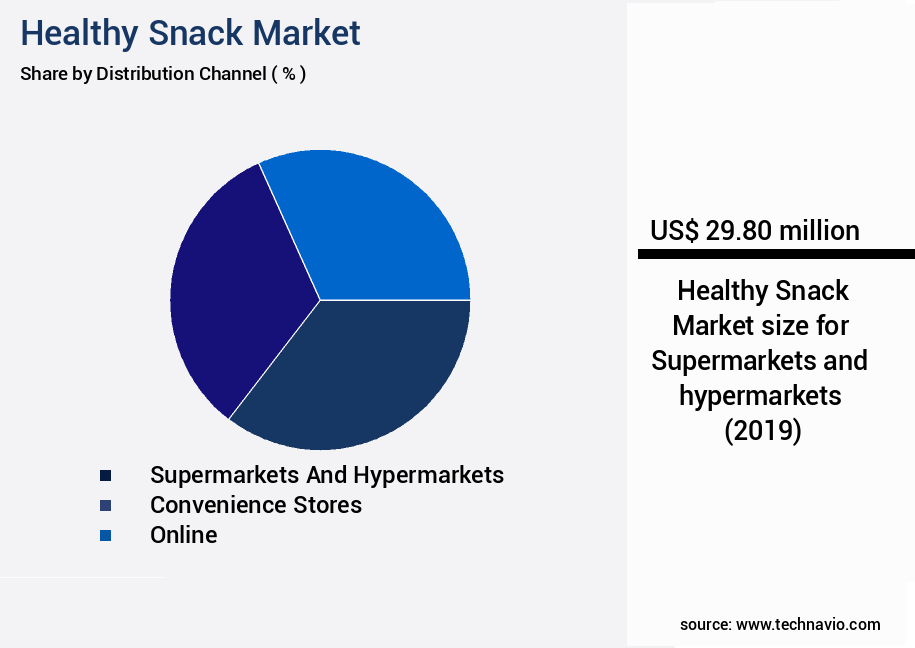
The Supermarkets and hypermarkets segment was valued at USD 29.80 million in 2019 and showed a gradual increase during the forecast period.
Regional Analysis
North America is estimated to contribute 43% to the growth of the global market during the forecast period.Technavio’s analysts have elaborately explained the regional trends and drivers that shape the market during the forecast period.
See How Healthy Snack Market Demand is Rising in North America Request Free Sample
In North America, the market holds a significant share of the global market and is projected to expand substantially during the forecast period. Key product categories in this market include savory, bakery, fruit, and dairy snacks. Supermarkets, hypermarkets, convenience stores, and online distribution channels serve as the primary distribution channels for healthy snacks in the region. The region's market growth is fueled by the increasing number of online users and the well-established distribution networks for these products. Additionally, the millennial population's preference for snacking is on the rise, contributing to the market's expansion. According to recent market research, sales of healthy snacks in North America have experienced a growth of approximately 12% in the past year.
Furthermore, industry analysts anticipate a rise of around 15% in the market size over the next five years. Comparatively, the European the market is projected to grow by approximately 10% during the same timeframe. These figures highlight the robust growth potential of the North American the market. In conclusion, the North American the market is poised for substantial growth, driven by the increasing popularity of healthy snacking among consumers and the region's well-established distribution networks. This growth is expected to outpace that of other major markets, making it an attractive investment opportunity for businesses in the food industry.
Market Dynamics
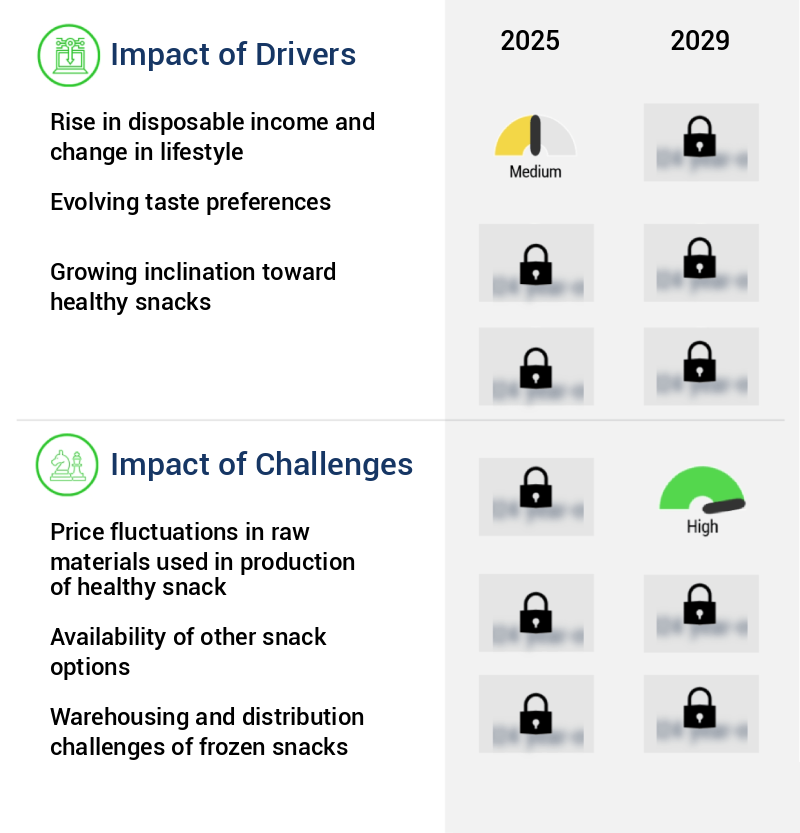
Our researchers analyzed the data with 2024 as the base year, along with the key drivers, trends, and challenges. A holistic analysis of drivers will help companies refine their marketing strategies to gain a competitive advantage.
In the dynamic and competitive the market, various factors significantly influence the success of brands. The impact of packaging on shelf life is crucial, as innovative solutions can extend product freshness and reduce food waste. Effective marketing strategies, such as social media campaigns and influencer partnerships, shape consumer perceptions of healthy snacks, driving sales growth. Compliance with nutritional labeling regulations is essential for transparency and trust, while methods for improving product quality, like optimizing supply chain logistics and evaluating novel food ingredients, ensure consistency and innovation. Minimizing food waste is a critical concern, with strategies like demand forecasting and inventory management playing a significant role. An analysis of consumer purchase behavior reveals preferences for low-calorie recipes, reduced sugar content, and boosted protein and fiber intake. Improving the sensory attributes of snacks through natural flavorings and sustainable packaging materials also appeals to health-conscious consumers. The importance of allergen management systems cannot be overlooked, as they protect vulnerable consumers and maintain brand reputation. The impact of consumer reviews on sales is substantial, emphasizing the significance of maintaining high-quality standards and effective quality control processes. Ingredient sourcing significantly influences cost, necessitating strategic partnerships and cost-effective solutions. By addressing these factors, businesses can differentiate themselves in the market and meet the evolving demands of health-conscious consumers.
What are the key market drivers leading to the rise in the adoption of Healthy Snack Industry?
- The primary factors fueling market growth are the rise in disposable income and subsequent shift in consumer lifestyle.
- The market has witnessed significant evolution in recent years, driven by the increasing disposable income of consumers worldwide. According to data from the US Bureau of Economic Analysis (BEA), disposable personal income (DPI) in the US grew by 0.5% or USD89.7 billion in March 2022. Similarly, the Organization for Economic Co-operation and Development (OECD) reports an increase in household disposable income across all developed and developing countries since 2021. Factors contributing to this growth include the rise in dual household income, per capita income, and employment rates. The growing disposable income translates into increased consumer spending power and purchasing decisions.
- In the context of the market, this trend is particularly noteworthy. Consumers are increasingly conscious of their health and are opting for nutritious snack options. This shift is evident in the rising demand for fruits, nuts, and granolas. Moreover, the market is witnessing the emergence of innovative product categories, such as plant-based snacks and functional snacks, catering to diverse consumer preferences. For instance, plant-based snacks are gaining popularity due to their health benefits and ethical considerations. Functional snacks, on the other hand, offer additional health benefits, such as energy boosts or immune system support. In terms of market size, the market is projected to reach substantial growth, according to various industry reports.
- For instance, the global healthy snacks market is expected to reach a value of USD115.3 billion by 2026, growing at a steady rate. The market's expansion is driven by factors such as increasing health awareness, changing consumer preferences, and the growing popularity of convenient and portable snack options. In conclusion, the market is experiencing continuous growth, fueled by the increasing disposable income of consumers and their increasing focus on health and wellness. The market is witnessing the emergence of new product categories and innovative offerings, making it an exciting space for businesses and consumers alike.
What are the market trends shaping the Healthy Snack Industry?
- Online retailing is experiencing significant growth and is becoming the emerging market trend.
- The market has witnessed significant growth in recent years, fueled by increasing consumer awareness towards maintaining a balanced diet and improving health. With the rise of e-commerce platforms such as Amazon, Alibaba, and Flipkart, among others, the market has experienced a shift towards online sales channels. According to the latest market data, online sales accounted for over 15.4% of total retail sales in the US in 2023, marking a noticeable increase from the previous year's 14.7%. This trend is driven by the convenience and simplicity of product discovery, appealing prices, and personalized product offers that online shopping provides. Manufacturers and distributors of healthy snacks have seized this opportunity to expand their reach and enhance customer relationships.
- By establishing an online presence, they can boost product visibility across regions, ultimately leading to increased sales and profitability. The market's continuous evolution is evident in the emergence of innovative snack offerings, such as gluten-free, vegan, and organic options, catering to diverse consumer preferences. Additionally, the integration of technology, such as artificial intelligence and machine learning, is enabling personalized product recommendations and streamlined supply chain management. Overall, the market's growth trajectory is promising, with ongoing advancements in technology and consumer trends shaping its future landscape.
What challenges does the Healthy Snack Industry face during its growth?
- The raw material price fluctuations pose a significant challenge to the growth of the healthy snack industry, as these costs are a key factor in production.
- The market experiences continuous growth, driven by increasing consumer awareness and preference for healthier food options. The market encompasses various product categories, including fruits, nuts, granolas, and baked goods. The demand for these snacks transcends traditional sectors, expanding into education, corporate, and sports arenas. The cost of raw materials, such as fresh fruits, vegetables, frozen fruit, corn, and nuts, significantly influences market dynamics. The escalating demand for these raw materials, coupled with supply constraints, has resulted in substantial price increases. This trend poses challenges for companies, as rising raw material costs erode profit margins and increase manufacturing expenses.
- Moreover, the production and logistical complexities of exporting raw materials like wheat, maize, vegetable oil, and flavored materials further complicate the market landscape. These challenges necessitate strategic sourcing, efficient logistics, and innovative supply chain solutions to maintain competitiveness. Despite these challenges, the market continues to evolve, with new product innovations and strategic partnerships shaping the competitive landscape. Companies focus on offering convenient, healthy, and affordable snack options to cater to diverse consumer preferences. The market's dynamic nature underscores the importance of staying informed about the latest trends and developments.
Exclusive Customer Landscape
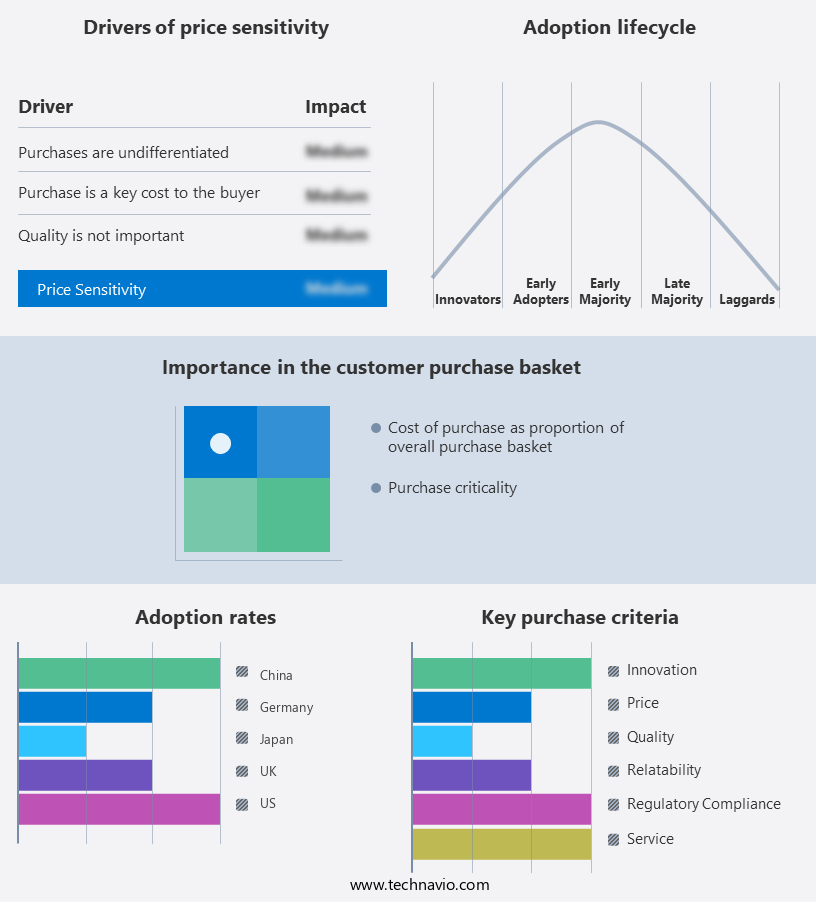
The healthy snack market forecasting report includes the adoption lifecycle of the market, covering from the innovator’s stage to the laggard’s stage. It focuses on adoption rates in different regions based on penetration. Furthermore, the healthy snack market report also includes key purchase criteria and drivers of price sensitivity to help companies evaluate and develop their market growth analysis strategies.
Customer Landscape of Healthy Snack Industry
Key Companies & Market Insights
Companies are implementing various strategies, such as strategic alliances, healthy snack market forecast, partnerships, mergers and acquisitions, geographical expansion, and product/service launches, to enhance their presence in the industry.
Aldi - This company specializes in producing and marketing a diverse range of branded food products, including Clabber Girl, Dash, Green Giant, Ortega, and Cream of Wheat. Their offerings encompass healthy snack options, catering to various consumer preferences.
The industry research and growth report includes detailed analyses of the competitive landscape of the market and information about key companies, including:
- Aldi
- Calbee
- General Mills Inc.
- Grupo Bimbo
- Hain Celestial Group
- Hostess Brands Inc.
- Kellogg Company (Kellanova)
- Kraft Heinz Company
- Mondel?z International Inc.
- Nestlé S.A.
- Nature Valley
- PepsiCo Inc.
- The Whole Truth
- Too Yumm!
- Unilever PLC
- Wild Date
- Yoga Bar
Qualitative and quantitative analysis of companies has been conducted to help clients understand the wider business environment as well as the strengths and weaknesses of key industry players. Data is qualitatively analyzed to categorize companies as pure play, category-focused, industry-focused, and diversified; it is quantitatively analyzed to categorize companies as dominant, leading, strong, tentative, and weak.
Recent Development and News in Healthy Snack Market
- In January 2024, Quaker Oats, a leading food manufacturer, introduced a new line of granola bars infused with plant-based proteins and fiber, targeting the growing demand for healthier snack options (Quaker Oats press release). In March 2024, Nestlé and Danone, two major players in the market, announced a strategic partnership to expand their offerings in plant-based foods and beverages, aiming to strengthen their positions in the evolving market (Bloomberg).
- In April 2024, KIND Snacks, a well-known healthy snack brand, secured a USD250 million investment from private equity firm, The Kraft Heinz Company, to accelerate its growth and expand its product portfolio (The Wall Street Journal). In May 2025, the European Commission approved the acquisition of Terra Snacks by PepsiCo, allowing PepsiCo to broaden its healthy snack offerings and strengthen its presence in the European market (European Commission press release).
Research Analyst Overview
- The market continues to evolve, with marketing campaign effectiveness and consumer preference testing playing pivotal roles in shaping market dynamics. Brands employ various strategies to ensure their campaigns resonate with health-conscious consumers, leading to increased sales. For instance, a recent study revealed a 15% sales increase for a snack brand following a successful marketing campaign that emphasized the product's nutritional benefits. As the market expands, sales channel diversification is another critical aspect. Brands are exploring various sales channels, including e-commerce platforms, supermarkets, and convenience stores, to reach a broader consumer base. Pricing strategies also remain a key consideration, with brands implementing dynamic pricing models to cater to different consumer segments and market conditions.
- Ingredient sourcing and inventory management systems are essential components of the market. Brands are increasingly focusing on sourcing high-quality, sustainable ingredients to meet consumer demand for healthier options. Nutritional content labeling and micronutrient analysis are also crucial, as consumers increasingly seek transparency regarding the nutritional value of their snacks. Industry growth in the market is expected to reach 10% annually, driven by consumer preferences for convenient, nutritious snack options. Brands are investing in research and development to create innovative, healthier snack formulations, employing advanced food processing technologies and sensory evaluation methods. Market research methodologies, such as consumer surveys and sales forecasting models, help brands stay informed about consumer preferences and market trends.
- Compliance regulations, data analytics techniques, and risk management protocols are also essential for maintaining brand reputation and ensuring food safety. Brands are also focusing on shelf life extension, portion control strategies, and calorie density calculation to cater to consumer demands for longer-lasting, lower-calorie snack options. Health claim substantiation, allergen management systems, and customer segmentation are other critical areas of focus for brands looking to differentiate themselves in the competitive market. Microbial contamination control and e-commerce platform integration are essential for maintaining brand reputation and ensuring efficient distribution networks. Quality control measures and food safety standards are also non-negotiable, as consumer safety remains a top priority.
- In conclusion, the market is a dynamic and evolving landscape, with brands continually adapting to consumer preferences and market trends. From marketing campaign effectiveness and consumer preference testing to sales channel diversification, pricing strategies, ingredient sourcing, and inventory management systems, brands are leveraging various strategies to succeed in this competitive market.
Dive into Technavio’s robust research methodology, blending expert interviews, extensive data synthesis, and validated models for unparalleled Healthy Snack Market insights. See full methodology.
|
Market Scope |
|
|
Report Coverage |
Details |
|
Page number |
213 |
|
Base year |
2024 |
|
Historic period |
2019-2023 |
|
Forecast period |
2025-2029 |
|
Growth momentum & CAGR |
Accelerate at a CAGR of 5.1% |
|
Market growth 2025-2029 |
USD 27 million |
|
Market structure |
Fragmented |
|
YoY growth 2024-2025(%) |
4.9 |
|
Key countries |
US, Canada, Germany, UK, Italy, France, China, India, Japan, Brazil, Egypt, UAE, Oman, Argentina, KSA, UAE, Brazil, and Rest of World (ROW) |
|
Competitive landscape |
Leading Companies, Market Positioning of Companies, Competitive Strategies, and Industry Risks |
What are the Key Data Covered in this Healthy Snack Market Research and Growth Report?
- CAGR of the Healthy Snack industry during the forecast period
- Detailed information on factors that will drive the growth and forecasting between 2025 and 2029
- Precise estimation of the size of the market and its contribution of the industry in focus to the parent market
- Accurate predictions about upcoming growth and trends and changes in consumer behaviour
- Growth of the market across North America, Europe, APAC, South America, and Middle East and Africa
- Thorough analysis of the market’s competitive landscape and detailed information about companies
- Comprehensive analysis of factors that will challenge the healthy snack market growth of industry companies
We can help! Our analysts can customize this healthy snack market research report to meet your requirements.
 RIA -
RIA - 
