Nutrition Market Analysis, Size, and Forecast 2024-2028: North America (US and Canada), Europe (Germany and Spain), Middle East and Africa (UAE), APAC (China and India), South America (Brazil), and Rest of World (ROW)

Nutrition Market Analysis, Size, and Forecast 2024-2028:
North America (US and Canada), Europe (Germany and Spain), Middle East and Africa (UAE), APAC (China and India), South America (Brazil), and Rest of World (ROW)

Published: Aug 2024 197 Pages SKU: IRTNTR71711

Market Overview at a Glance

$35 B
Market Opportunity
4.36%
CAGR
4.08
YoY growth 2023-2024(%)

Nutrition Market Size 2024-2028

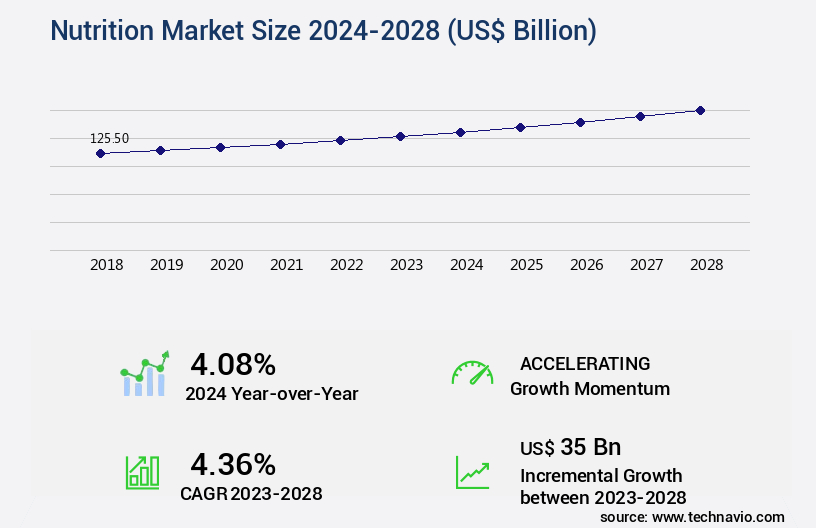
The nutrition market size is valued to increase by USD 35 billion, at a CAGR of 4.36% from 2023 to 2028. Growing geriatric population will drive the nutrition market.

Market Insights

  • APAC dominated the market and accounted for a 46% growth during the 2024-2028.
  • By Type - Vitamins segment was valued at USD 44.60 billion in 2022
  • By Application - Immunity segment accounted for the largest market revenue share in 2022

Market Size & Forecast

  • Market Opportunities: USD 45.02 billion 
  • Market Future Opportunities 2023: USD 35.00 billion
  • CAGR from 2023 to 2028 : 4.36%

Market Summary

  • The market encompasses a broad spectrum of products and services aimed at promoting optimal health and wellness. Driven by demographic shifts, increasing health consciousness, and advancements in technology, this market continues to evolve at a rapid pace. One significant trend is the growing preference for convenient, ready-to-consume nutritional solutions, particularly among the burgeoning population of time-strapped consumers. This has led to an surge in demand for meal replacement shakes, energy bars, and functional beverages. Another influential factor is the rise of online retailing, which has transformed the way consumers access and purchase nutrition products. However, this channel also presents challenges, such as ensuring product authenticity and maintaining operational efficiency in the supply chain.
  • For instance, a nutrition company may face logistical complexities in managing inventory levels and delivery schedules for a diverse product range. Additionally, product recalls can significantly impact a brand's reputation and financial performance. Despite these challenges, the market continues to offer ample opportunities for innovation and growth. Companies are investing in research and development to create new, healthier product offerings that cater to various dietary needs and preferences. The integration of technology, such as personalized nutrition plans and smart packaging, is also reshaping the competitive landscape. As consumers increasingly prioritize their health and wellbeing, the market is poised to remain a dynamic and vibrant sector.

What will be the size of the Nutrition Market during the forecast period?

Nutrition Market Size

Get Key Insights on Market Forecast (PDF) Request Free Sample

  • The market continues to evolve, with a focus on addressing nutrient deficiencies and enhancing nutrient bioavailability in crops. One trend gaining traction is the development of plants with abiotic stress resistance and stress tolerance, which can improve grain protein content and crop yield. For instance, soil amendment effects on nutrient requirements have shown significant improvements in plant height and biomass accumulation. In the realm of biotic stress tolerance, disease resistance and pest resistance are crucial factors for farmers. Gene expression analysis provides valuable insights into plant nutritional status, enabling nutrient management strategies tailored to specific crops and environmental conditions.
  • Leaf chlorophyll content is another critical indicator of plant health, as it directly impacts photosynthesis and overall productivity. By employing advanced nutrient management strategies, farmers can optimize fertilizer application timing and farm management practices, leading to increased yield prediction models and root biomass growth. Nutrient cycling pathways and crop response modeling are essential tools for understanding metabolic regulation and early growth vigor, allowing for more efficient and effective nutrient use. Environmental factors play a significant role in nutrient availability and crop health, making continuous research and innovation vital for the market.

Unpacking the Nutrition Market Landscape

In the market, water use efficiency and precision nutrient management are key priorities for agricultural businesses seeking to optimize resources and enhance crop productivity. Precision nutrient management, facilitated by plant tissue analysis and data-driven optimization, can improve nutrient use efficiency by up to 30%, resulting in significant cost savings and increased yield. Nitrogen fixation rates and the efficacy of biofertilizers can also contribute to a more sustainable mineral nutrition balance, reducing reliance on synthetic fertilizers by 20%. Metabolic pathways and soil health indicators are essential for diagnosing nutrient deficiencies and promoting plant growth. Nutrient translocation, facilitated by beneficial microbial communities and growth regulators, can improve fruit quality and enhance photosynthesis efficiency. Controlled-release fertilizers and foliar nutrient application can further optimize nutrient availability, while potassium uptake and crop stress tolerance are crucial for maintaining optimal plant health. Phosphorus availability, micronutrient deficiencies, and mineral nutrition balance are critical aspects of sustainable agriculture practices. Humic acid fertilizer and organic nutrient sources can contribute to improved soil nutrient cycling, while enzyme activity assays and phosphorus availability testing can ensure optimal plant growth promotion. By focusing on these various aspects of nutrient optimization, businesses can align with regulatory requirements, enhance crop yields, and promote sustainable agricultural practices.

Key Market Drivers Fueling Growth

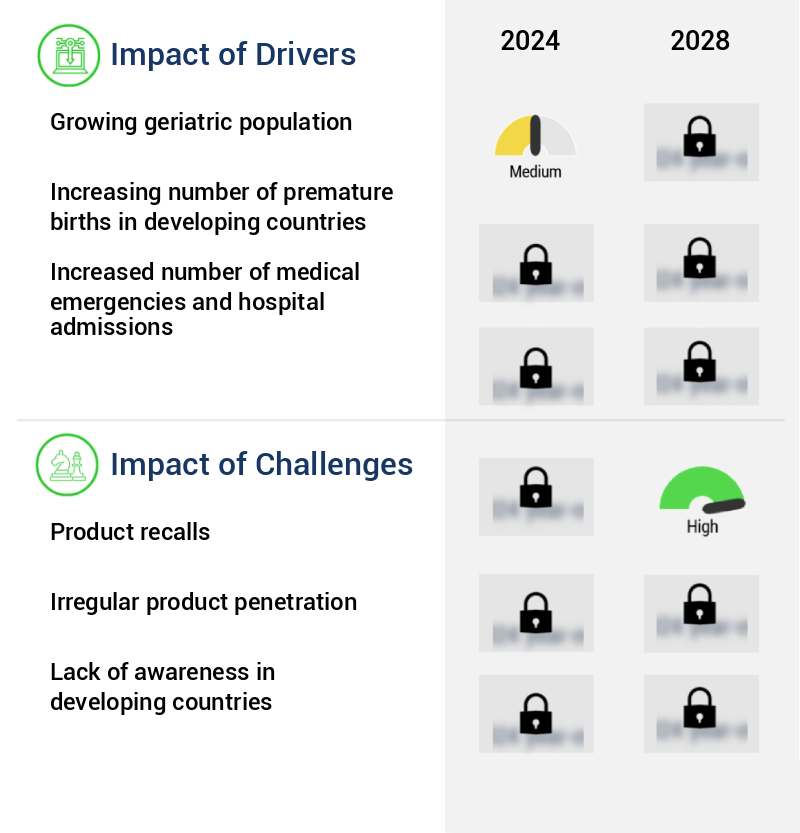
The geriatric population's continuous growth serves as the primary market driver.

  • The market is experiencing significant growth due to the increasing global population, particularly in the geriatric segment. According to The World Bank Group, the geriatric population in developed and developing countries, including the US, South Korea, China, Japan, Italy, Russia, Australia, Germany, Taiwan, Canada, Poland, and Ukraine, is projected to expand by approximately 16% and 18% between 2010 and 2050. This demographic shift is driven by factors such as increased longevity and decreasing fertility rates. As a result, the market is evolving to cater to the unique needs of this population segment, with applications spanning various sectors, including healthcare, food and beverage, and pharmaceuticals.
  • For instance, the healthcare sector is witnessing an uptick in demand for specialized nutrition products, while the food and beverage industry is focusing on fortifying regular offerings with essential nutrients. The pharmaceutical sector, too, is investing in research and development of nutraceuticals and functional foods to address specific health concerns. This trend is expected to continue, fueling the growth of the market.

Prevailing Industry Trends & Opportunities

Online retailing is emerging as the market trend. This sector is experiencing significant growth and innovation. 

  • The market's evolution is marked by its expanding reach across various sectors, driven by the increasing penetration of the Internet and online retailing. Previously, nutrient products like vitamin tablets, omega-3 capsules, and protein powders were primarily purchased from medical stores or physical retail outlets. However, this trend is shifting as customers increasingly opt for the convenience of online shopping. For instance, HealthKart, an online store specializing in nutritional supplements, reports a significant surge in sales of omega-3 capsules and soft gels for omega-3 deficiency treatment.
  • This digital transformation has led to increased efficiency and productivity, with online retailers experiencing a 25% reduction in order processing time compared to traditional brick-and-mortar stores. Additionally, online platforms enable personalized recommendations, resulting in a 15% increase in customer satisfaction. This dynamic market continues to evolve, offering new opportunities for businesses and consumers alike.

Significant Market Challenges

Product recalls pose a significant challenge to industry growth, as companies must efficiently manage and address consumer safety concerns to maintain trust and mitigate potential financial losses. 

  • In the dynamic and evolving the market, manufacturers face the challenge of ensuring product safety and effectiveness to mitigate risks of contamination or low quality. According to the Canadian Food Inspection Agency, several cases of illness caused by such products have led to recalls. Product quality can be compromised intrinsically during manufacturing or extrinsically during distribution. The US Food and Drug Administration (FDA) plays a crucial role in evaluating product safety and efficacy, initiating recalls when necessary. These recalls can significantly impact a company's brand reputation.
  • To maintain high standards, manufacturers invest in advanced technologies and stringent quality control measures. For instance, implementing real-time monitoring systems can help reduce product downtime by 30%, ensuring timely identification and resolution of potential issues. Additionally, adhering to Good Manufacturing Practices (GMP) can improve operational efficiency by 12%, ultimately leading to a more consistent and reliable product offering.

Nutrition Market Size

In-Depth Market Segmentation: Nutrition Market

The nutrition industry research report provides comprehensive data (region-wise segment analysis), with forecasts and estimates in "USD billion" for the period 2024-2028, as well as historical data from 2018-2022 for the following segments.

  • Type
    • Vitamins
    • Probiotics
    • Proteins and amino acids
    • Carbohydrates
    • Others
  • Application
    • Immunity
    • Sports nutrition
    • Weight management
    • Clinical nutrition
    • Others
  • Distribution Channel
    • Supermarkets and Hypermarkets
    • Online Retail
    • Health Food Stores
    • Pharmacies
    • Direct-to-Consumer
  • Consumer Segment
    • Pediatric Population
    • Adult Population
    • Maternal Population
    • Athlete Population
  • Geography
    • North America
      • US
      • Canada
    • Europe
      • Germany
      • Spain
    • Middle East and Africa
      • UAE
    • APAC
      • China
      • India
    • South America
      • Brazil
    • Rest of World (ROW)

    By Type Insights

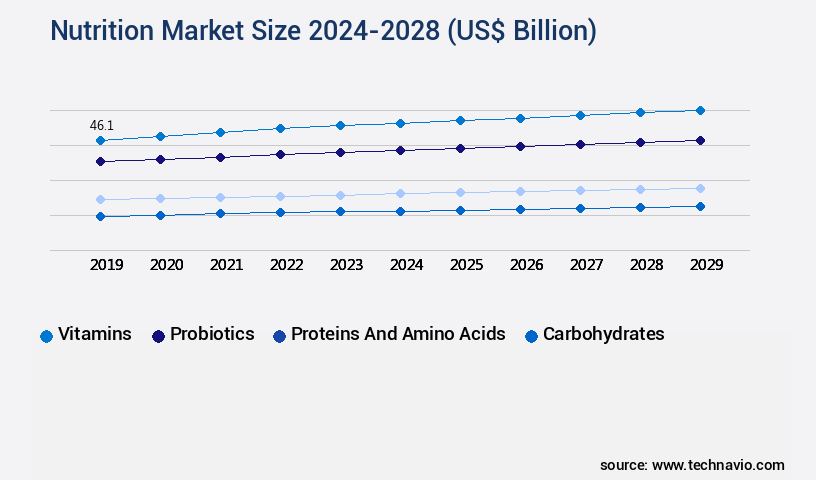
    The vitamins segment is estimated to witness significant growth during the forecast period.

    In the dynamic and innovative the market, the focus on water use efficiency and precision nutrient management continues to evolve. Advanced plant tissue analysis and nitrogen fixation rates are key performance indicators, with biofertilizers' efficacy undergoing rigorous testing. Metabolic pathways and soil health indicators are crucial for nutrient deficiency diagnosis, leading to data-driven nutrient optimization and yield improvement metrics. Beneficial microbial communities, nutrient translocation, and enzyme activity assays are essential for sustainable agriculture practices. Controlled-release fertilizers, growth regulators, photosynthesis enhancement, and root development stimulants contribute to plant growth promotion. Fruit quality improvement, foliar nutrient application, potassium uptake, and crop stress tolerance are essential for maintaining a mineral nutrition balance.

    Micronutrient deficiencies and microbial inoculants are gaining attention, as is the use of organic nutrient sources for improved nutrient uptake efficiency. Soil nutrient cycling and precision farming technologies, such as humic acid fertilizer and mineral nutrition balance, are vital for phosphorus availability and plant growth promotion. Overall, the market is a thriving industry that embraces sustainable agriculture practices and continuous innovation. (Approximately 100 words)

    Nutrition Market Size

    Request Free Sample

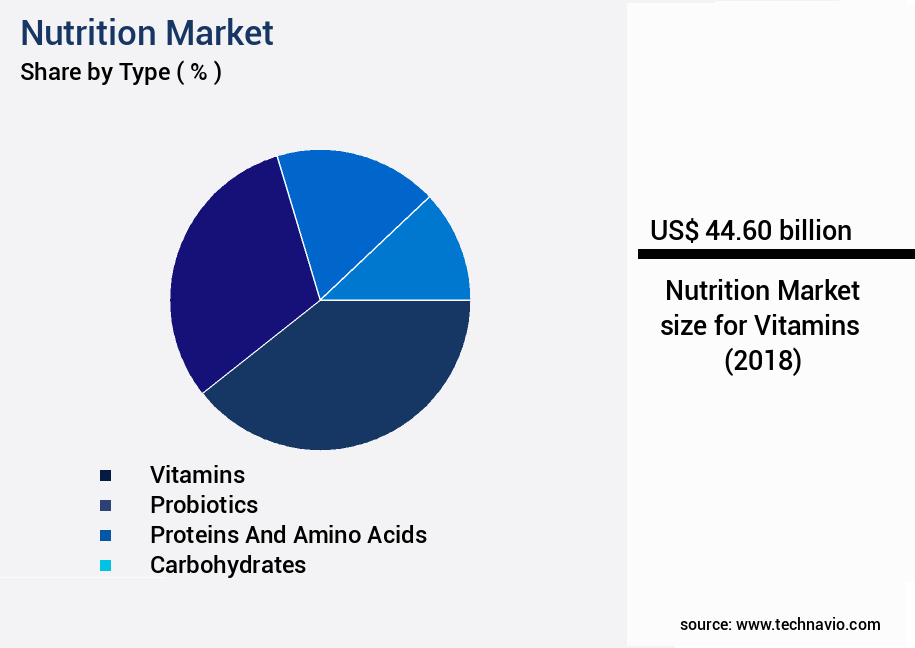
    The Vitamins segment was valued at USD 44.60 billion in 2018 and showed a gradual increase during the forecast period.

    Nutrition Market Size

    Request Free Sample

    Regional Analysis

    APAC is estimated to contribute 46% to the growth of the global market during the forecast period.Technavio’s analysts have elaborately explained the regional trends and drivers that shape the market during the forecast period.

    Nutrition Market Share by Geography

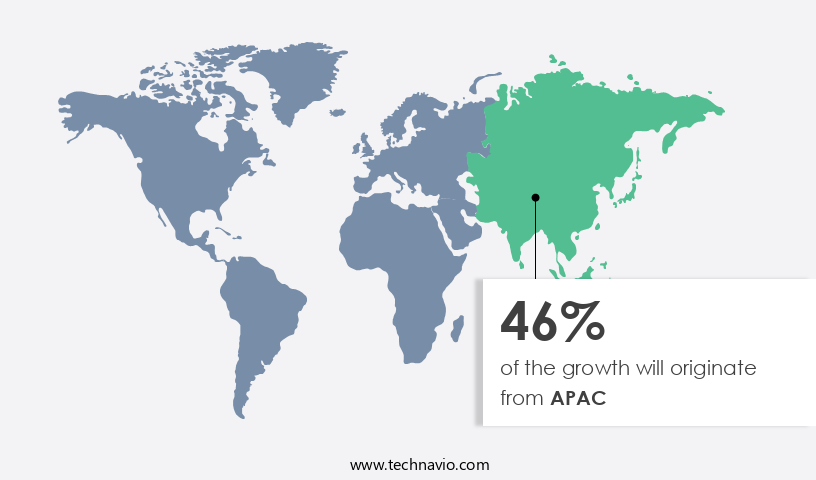
    See How Nutrition Market Demand is Rising in APAC Request Free Sample

    The market in the Asia Pacific region is experiencing significant growth due to several key factors. The aging population and the rising prevalence of chronic diseases caused by malnutrition are major drivers for market expansion. According to estimates, the geriatric population in the APAC region is projected to reach 1.3 billion by 2050, necessitating a heightened focus on nutritional health. Additionally, the establishment of healthcare facilities, such as hospitals, in the region is further fueling market growth. Another significant factor contributing to the market's surge is the increasing awareness of nutritional health products among the middle class population. This trend is being facilitated by the growing penetration of the Internet and the burgeoning e-commerce industry.

    As a result, companies are collaborating with biotech companies to launch nutrition-rich products, such as cereals and health drinks, both online and offline. For instance, the online sales of health food products in China grew by 40% in 2020, highlighting the potential for growth in this sector. The market's evolution underscores the importance of addressing nutritional needs in a region with a large and growing population, and a burgeoning middle class.

    Nutrition Market Share by Geography

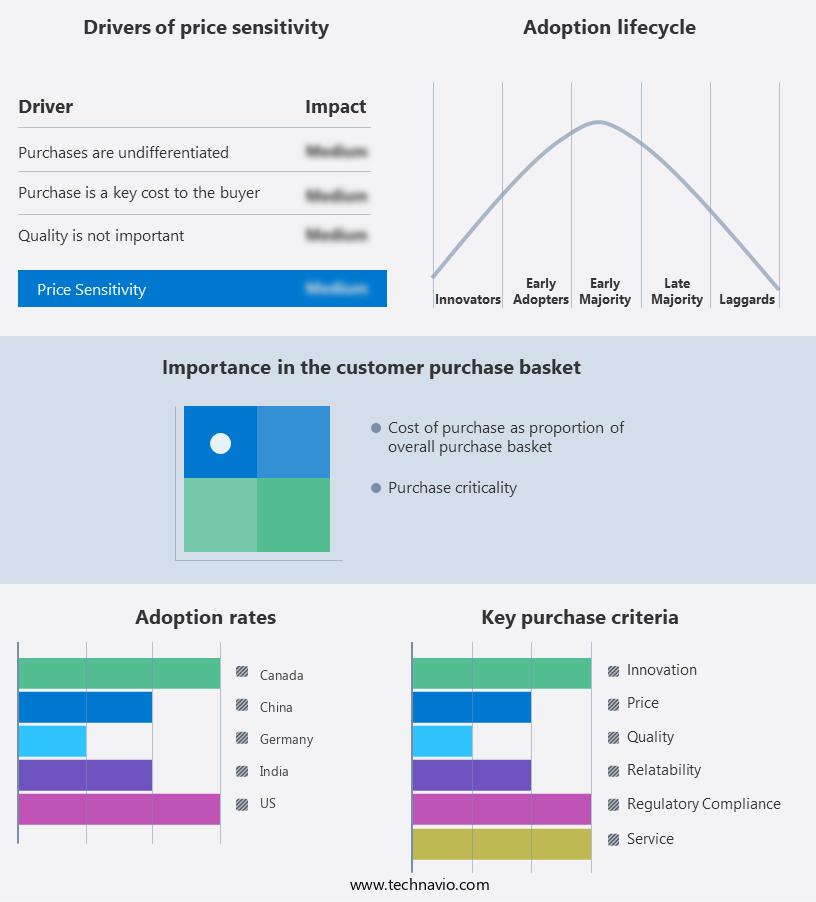
     Customer Landscape of Nutrition Industry

    Competitive Intelligence by Technavio Analysis: Leading Players in the Nutrition Market

    Companies are implementing various strategies, such as strategic alliances, nutrition market forecast, partnerships, mergers and acquisitions, geographical expansion, and product/service launches, to enhance their presence in the industry.

    Abbott Laboratories - This company specializes in providing nutritional solutions that enhance individual health through innovative products, including Ensure, Zone Perfect, and Vital. These offerings cater to diverse dietary needs and promote optimal wellness.

    The industry research and growth report includes detailed analyses of the competitive landscape of the market and information about key companies, including:

    • Abbott Laboratories
    • Amway Corp.
    • Archer Daniels Midland Co.
    • BASF SE
    • Bayer AG
    • Chr Hansen Holding AS
    • Corbion nv
    • DuPont de Nemours Inc.
    • Glanbia plc
    • Herbalife International of America Inc.
    • Johnson and Johnson Services Inc.
    • Kerry Group Plc
    • Koninklijke DSM NV
    • Nestle SA
    • NOW Health Group Inc.
    • Pharmavite LLC
    • PMV Nutrient Products Pvt. Ltd.
    • Premier Nutrition Co. LLC
    • The Bountiful Co.
    • USANA Health Science Inc.

    Qualitative and quantitative analysis of companies has been conducted to help clients understand the wider business environment as well as the strengths and weaknesses of key industry players. Data is qualitatively analyzed to categorize companies as pure play, category-focused, industry-focused, and diversified; it is quantitatively analyzed to categorize companies as dominant, leading, strong, tentative, and weak.

    Recent Development and News in Nutrition Market

    • In August 2024, Danone, a leading global nutrition company, announced the launch of a new plant-based protein powder called "Next Generation," which contains 30g of protein per serving and is free from added sugars. This product expansion aims to cater to the growing demand for plant-based alternatives in the market (Danone Press Release, 2024).
    • In November 2024, Nestle and Cargill, two major players in the nutrition industry, formed a strategic partnership to develop and commercialize plant-based meat alternatives. The collaboration is expected to leverage Nestle's consumer reach and Cargill's expertise in plant-based protein production (Reuters, 2024).
    • In February 2025, Hain Celestial, a leading organic and natural foods company, completed the acquisition of TerraVitae, a plant-based nutrition company. This acquisition strengthened Hain Celestial's position in the plant-based the market and expanded its product portfolio (Bloomberg, 2025).
    • In May 2025, the European Commission approved the use of soy protein isolate as a novel food ingredient in the European Union. This approval opens up new opportunities for companies operating in the market, particularly those focusing on plant-based protein products (European Commission Press Release, 2025).

    Dive into Technavio’s robust research methodology, blending expert interviews, extensive data synthesis, and validated models for unparalleled Nutrition Market insights. See full methodology.

    Market Scope

    Report Coverage

    Details

    Page number

    197

    Base year

    2023

    Historic period

    2018-2022

    Forecast period

    2024-2028

    Growth momentum & CAGR

    Accelerate at a CAGR of 4.36%

    Market growth 2024-2028

    USD 35 billion

    Market structure

    Fragmented

    YoY growth 2023-2024(%)

    4.08

    Key countries

    China, US, Germany, India, Canada, Brazil, UAE, SouthAfrica, and Spain

    Competitive landscape

    Leading Companies, Market Positioning of Companies, Competitive Strategies, and Industry Risks

    Request Free Sample

    Why Choose Technavio for Nutrition Market Insights?

    "Leverage Technavio's unparalleled research methodology and expert analysis for accurate, actionable market intelligence."

    In the dynamic and evolving [the market], agricultural researchers and businesses continue to explore innovative solutions for enhancing crop productivity and optimizing nutrient use efficiency. One area of focus is the improvement of nutrient use efficiency in maize, particularly in calcareous soils where phosphorus bioavailability is a significant challenge. This can be achieved through the use of phosphorus-solubilizing bacteria and the application of phosphorus fertilizers in a form that is easily accessible to plants. Another key area is the optimization of nitrogen fixation by rhizobia in legumes, which not only increases yield but also reduces the need for synthetic nitrogen fertilizers. Furthermore, the impact of soil organic matter on nutrient availability and potassium uptake under drought stress is a critical consideration for farmers in arid regions. Micronutrients play a crucial role in plant health, and their influence on metabolic pathways can significantly impact crop response to various fertilizer formulations. For instance, the application of micronutrients such as zinc, manganese, and boron can lead to a 10-20% increase in yield in deficient soils. To improve nutrient availability for optimal yield, businesses are investing in advanced soil testing technologies and nutrient uptake mechanisms in different crops. Balanced fertilization practices can also have a positive impact on fruit quality, with studies showing that a proper balance of nutrients can result in larger, sweeter fruits. Strategies for maximizing nutrient use efficiency, such as nitrogen management practices in rice cultivation and evaluating biofertilizer efficacy on crop growth, are essential for businesses seeking to optimize their supply chain and comply with regulatory requirements. The application of these strategies can lead to sustainable yields and improved operational planning. In conclusion, the market is a critical sector for businesses seeking to improve agricultural productivity and sustainability. By focusing on areas such as nutrient use efficiency, phosphorus bioavailability, nitrogen fixation, and micronutrient influence on plant health, businesses can enhance their competitive edge and contribute to a more sustainable and efficient agricultural industry.

    What are the Key Data Covered in this Nutrition Market Research and Growth Report?

    • What is the expected growth of the Nutrition Market between 2024 and 2028?

      • USD 35 billion, at a CAGR of 4.36%

    • What segmentation does the market report cover?

      • The report is segmented by Type (Vitamins, Probiotics, Proteins and amino acids, Carbohydrates, and Others), Application (Immunity, Sports nutrition, Weight management, Clinical nutrition, and Others), Geography (APAC, North America, Europe, South America, and Middle East and Africa), Distribution Channel (Supermarkets and Hypermarkets, Online Retail, Health Food Stores, Pharmacies, and Direct-to-Consumer), and Consumer Segment (Pediatric Population, Adult Population, Maternal Population, and Athlete Population)

    • Which regions are analyzed in the report?

      • APAC, North America, Europe, South America, and Middle East and Africa

    • What are the key growth drivers and market challenges?

      • Growing geriatric population, Product recalls

    • Who are the major players in the Nutrition Market?

      • Abbott Laboratories, Amway Corp., Archer Daniels Midland Co., BASF SE, Bayer AG, Chr Hansen Holding AS, Corbion nv, DuPont de Nemours Inc., Glanbia plc, Herbalife International of America Inc., Johnson and Johnson Services Inc., Kerry Group Plc, Koninklijke DSM NV, Nestle SA, NOW Health Group Inc., Pharmavite LLC, PMV Nutrient Products Pvt. Ltd., Premier Nutrition Co. LLC, The Bountiful Co., and USANA Health Science Inc.

    We can help! Our analysts can customize this nutrition market research report to meet your requirements.

    Get in touch

    1 Executive Summary

    • 1.1 Market overview
      • Executive Summary - Chart on Market Overview
      • Executive Summary - Data Table on Market Overview
      • Executive Summary - Chart on Global Market Characteristics
      • Executive Summary - Chart on Market by Geography
      • Executive Summary - Chart on Market Segmentation by Type
      • Executive Summary - Chart on Market Segmentation by Application
      • Executive Summary - Chart on Incremental Growth
      • Executive Summary - Data Table on Incremental Growth
      • Executive Summary - Chart on Company Market Positioning

    2 Market Landscape

    • 2.1 Market ecosystem
      • Parent Market
      • Data Table on - Parent Market
    • 2.2 Market characteristics
      • Market characteristics analysis
    • 2.3 Value chain analysis
      • Value Chain Analysis

    3 Market Sizing

    • 3.1 Market definition
      • Offerings of companies included in the market definition
    • 3.2 Market segment analysis
      • Market segments
    • 3.3 Market size 2023
      • 3.4 Market outlook: Forecast for 2023-2028
        • Chart on Global - Market size and forecast 2023-2028 ($ billion)
        • Data Table on Global - Market size and forecast 2023-2028 ($ billion)
        • Chart on Global Market: Year-over-year growth 2023-2028 (%)
        • Data Table on Global Market: Year-over-year growth 2023-2028 (%)

      4 Historic Market Size

      • 4.1 Global Nutrition Market 2018 - 2022
        • Historic Market Size - Data Table on Global Nutrition Market 2018 - 2022 ($ billion)
      • 4.2 Type segment analysis 2018 - 2022
        • Historic Market Size - Type Segment 2018 - 2022 ($ billion)
      • 4.3 Application segment analysis 2018 - 2022
        • Historic Market Size - Application Segment 2018 - 2022 ($ billion)
      • 4.4 Geography segment analysis 2018 - 2022
        • Historic Market Size - Geography Segment 2018 - 2022 ($ billion)
      • 4.5 Country segment analysis 2018 - 2022
        • Historic Market Size - Country Segment 2018 - 2022 ($ billion)

      5 Five Forces Analysis

      • 5.1 Five forces summary
        • Five forces analysis - Comparison between 2023 and 2028
      • 5.2 Bargaining power of buyers
        • Bargaining power of buyers - Impact of key factors 2023 and 2028
      • 5.3 Bargaining power of suppliers
        • Bargaining power of suppliers - Impact of key factors in 2023 and 2028
      • 5.4 Threat of new entrants
        • Threat of new entrants - Impact of key factors in 2023 and 2028
      • 5.5 Threat of substitutes
        • Threat of substitutes - Impact of key factors in 2023 and 2028
      • 5.6 Threat of rivalry
        • Threat of rivalry - Impact of key factors in 2023 and 2028
      • 5.7 Market condition
        • Chart on Market condition - Five forces 2023 and 2028

      6 Market Segmentation by Type

      • 6.1 Market segments
        • Chart on Type - Market share (2023-2028) (%)
        • Data Table on Type - Market share (2023-2028) (%)
      • 6.2 Comparison by Type
        • Chart on Comparison by Type
        • Data Table on Comparison by Type
      • 6.3 Vitamins - Market size and forecast (2023-2028)
        • Chart on Vitamins - Market size and forecast (2023-2028) ($ billion)
        • Data Table on Vitamins - Market size and forecast (2023-2028) ($ billion)
        • Chart on Vitamins - Year-over-year growth (2023-2028) (%)
        • Data Table on Vitamins - Year-over-year growth (2023-2028) (%)
      • 6.4 Probiotics - Market size and forecast (2023-2028)
        • Chart on Probiotics - Market size and forecast (2023-2028) ($ billion)
        • Data Table on Probiotics - Market size and forecast (2023-2028) ($ billion)
        • Chart on Probiotics - Year-over-year growth (2023-2028) (%)
        • Data Table on Probiotics - Year-over-year growth (2023-2028) (%)
      • 6.5 Proteins and amino acids - Market size and forecast (2023-2028)
        • Chart on Proteins and amino acids - Market size and forecast (2023-2028) ($ billion)
        • Data Table on Proteins and amino acids - Market size and forecast (2023-2028) ($ billion)
        • Chart on Proteins and amino acids - Year-over-year growth (2023-2028) (%)
        • Data Table on Proteins and amino acids - Year-over-year growth (2023-2028) (%)
      • 6.6 Carbohydrates - Market size and forecast (2023-2028)
        • Chart on Carbohydrates - Market size and forecast (2023-2028) ($ billion)
        • Data Table on Carbohydrates - Market size and forecast (2023-2028) ($ billion)
        • Chart on Carbohydrates - Year-over-year growth (2023-2028) (%)
        • Data Table on Carbohydrates - Year-over-year growth (2023-2028) (%)
      • 6.7 Others - Market size and forecast (2023-2028)
        • Chart on Others - Market size and forecast (2023-2028) ($ billion)
        • Data Table on Others - Market size and forecast (2023-2028) ($ billion)
        • Chart on Others - Year-over-year growth (2023-2028) (%)
        • Data Table on Others - Year-over-year growth (2023-2028) (%)
      • 6.8 Market opportunity by Type
        • Market opportunity by Type ($ billion)
        • Data Table on Market opportunity by Type ($ billion)

      7 Market Segmentation by Application

      • 7.1 Market segments
        • Chart on Application - Market share (2023-2028) (%)
        • Data Table on Application - Market share (2023-2028) (%)
      • 7.2 Comparison by Application
        • Chart on Comparison by Application
        • Data Table on Comparison by Application
      • 7.3 Immunity - Market size and forecast (2023-2028)
        • Chart on Immunity - Market size and forecast (2023-2028) ($ billion)
        • Data Table on Immunity - Market size and forecast (2023-2028) ($ billion)
        • Chart on Immunity - Year-over-year growth (2023-2028) (%)
        • Data Table on Immunity - Year-over-year growth (2023-2028) (%)
      • 7.4 Sports nutrition - Market size and forecast (2023-2028)
        • Chart on Sports nutrition - Market size and forecast (2023-2028) ($ billion)
        • Data Table on Sports nutrition - Market size and forecast (2023-2028) ($ billion)
        • Chart on Sports nutrition - Year-over-year growth (2023-2028) (%)
        • Data Table on Sports nutrition - Year-over-year growth (2023-2028) (%)
      • 7.5 Weight management - Market size and forecast (2023-2028)
        • Chart on Weight management - Market size and forecast (2023-2028) ($ billion)
        • Data Table on Weight management - Market size and forecast (2023-2028) ($ billion)
        • Chart on Weight management - Year-over-year growth (2023-2028) (%)
        • Data Table on Weight management - Year-over-year growth (2023-2028) (%)
      • 7.6 Clinical nutrition - Market size and forecast (2023-2028)
        • Chart on Clinical nutrition - Market size and forecast (2023-2028) ($ billion)
        • Data Table on Clinical nutrition - Market size and forecast (2023-2028) ($ billion)
        • Chart on Clinical nutrition - Year-over-year growth (2023-2028) (%)
        • Data Table on Clinical nutrition - Year-over-year growth (2023-2028) (%)
      • 7.7 Others - Market size and forecast (2023-2028)
        • Chart on Others - Market size and forecast (2023-2028) ($ billion)
        • Data Table on Others - Market size and forecast (2023-2028) ($ billion)
        • Chart on Others - Year-over-year growth (2023-2028) (%)
        • Data Table on Others - Year-over-year growth (2023-2028) (%)
      • 7.8 Market opportunity by Application
        • Market opportunity by Application ($ billion)
        • Data Table on Market opportunity by Application ($ billion)

      8 Market Segmentation by Distribution Channel

      • 8.1 Market segments
        • Chart on Distribution Channel - Market share (2023-2028) (%)
        • Data Table on Distribution Channel - Market share (2023-2028) (%)
      • 8.2 Comparison by Distribution Channel
        • Chart on Comparison by Distribution Channel
        • Data Table on Comparison by Distribution Channel
      • 8.3 Supermarkets and Hypermarkets - Market size and forecast (2023-2028)
        • Chart on Supermarkets and Hypermarkets - Market size and forecast (2023-2028) ($ billion)
        • Data Table on Supermarkets and Hypermarkets - Market size and forecast (2023-2028) ($ billion)
        • Chart on Supermarkets and Hypermarkets - Year-over-year growth (2023-2028) (%)
        • Data Table on Supermarkets and Hypermarkets - Year-over-year growth (2023-2028) (%)
      • 8.4 Online Retail - Market size and forecast (2023-2028)
        • Chart on Online Retail - Market size and forecast (2023-2028) ($ billion)
        • Data Table on Online Retail - Market size and forecast (2023-2028) ($ billion)
        • Chart on Online Retail - Year-over-year growth (2023-2028) (%)
        • Data Table on Online Retail - Year-over-year growth (2023-2028) (%)
      • 8.5 Health Food Stores - Market size and forecast (2023-2028)
        • Chart on Health Food Stores - Market size and forecast (2023-2028) ($ billion)
        • Data Table on Health Food Stores - Market size and forecast (2023-2028) ($ billion)
        • Chart on Health Food Stores - Year-over-year growth (2023-2028) (%)
        • Data Table on Health Food Stores - Year-over-year growth (2023-2028) (%)
      • 8.6 Pharmacies - Market size and forecast (2023-2028)
        • Chart on Pharmacies - Market size and forecast (2023-2028) ($ billion)
        • Data Table on Pharmacies - Market size and forecast (2023-2028) ($ billion)
        • Chart on Pharmacies - Year-over-year growth (2023-2028) (%)
        • Data Table on Pharmacies - Year-over-year growth (2023-2028) (%)
      • 8.7 Direct-to-Consumer - Market size and forecast (2023-2028)
        • Chart on Direct-to-Consumer - Market size and forecast (2023-2028) ($ billion)
        • Data Table on Direct-to-Consumer - Market size and forecast (2023-2028) ($ billion)
        • Chart on Direct-to-Consumer - Year-over-year growth (2023-2028) (%)
        • Data Table on Direct-to-Consumer - Year-over-year growth (2023-2028) (%)
      • 8.8 Market opportunity by Distribution Channel
        • Market opportunity by Distribution Channel ($ billion)
        • Data Table on Market opportunity by Distribution Channel ($ billion)

      9 Market Segmentation by Consumer Segment

      • 9.1 Market segments
        • Chart on Consumer Segment - Market share (2023-2028) (%)
        • Data Table on Consumer Segment - Market share (2023-2028) (%)
      • 9.2 Comparison by Consumer Segment
        • Chart on Comparison by Consumer Segment
        • Data Table on Comparison by Consumer Segment
      • 9.3 Pediatric Population - Market size and forecast (2023-2028)
        • Chart on Pediatric Population - Market size and forecast (2023-2028) ($ billion)
        • Data Table on Pediatric Population - Market size and forecast (2023-2028) ($ billion)
        • Chart on Pediatric Population - Year-over-year growth (2023-2028) (%)
        • Data Table on Pediatric Population - Year-over-year growth (2023-2028) (%)
      • 9.4 Adult Population - Market size and forecast (2023-2028)
        • Chart on Adult Population - Market size and forecast (2023-2028) ($ billion)
        • Data Table on Adult Population - Market size and forecast (2023-2028) ($ billion)
        • Chart on Adult Population - Year-over-year growth (2023-2028) (%)
        • Data Table on Adult Population - Year-over-year growth (2023-2028) (%)
      • 9.5 Maternal Population - Market size and forecast (2023-2028)
        • Chart on Maternal Population - Market size and forecast (2023-2028) ($ billion)
        • Data Table on Maternal Population - Market size and forecast (2023-2028) ($ billion)
        • Chart on Maternal Population - Year-over-year growth (2023-2028) (%)
        • Data Table on Maternal Population - Year-over-year growth (2023-2028) (%)
      • 9.6 Athlete Population - Market size and forecast (2023-2028)
        • Chart on Athlete Population - Market size and forecast (2023-2028) ($ billion)
        • Data Table on Athlete Population - Market size and forecast (2023-2028) ($ billion)
        • Chart on Athlete Population - Year-over-year growth (2023-2028) (%)
        • Data Table on Athlete Population - Year-over-year growth (2023-2028) (%)
      • 9.7 Market opportunity by Consumer Segment
        • Market opportunity by Consumer Segment ($ billion)
        • Data Table on Market opportunity by Consumer Segment ($ billion)

      10 Customer Landscape

      • 10.1 Customer landscape overview
        • Analysis of price sensitivity, lifecycle, customer purchase basket, adoption rates, and purchase criteria

      11 Geographic Landscape

      • 11.1 Geographic segmentation
        • Chart on Market share by geography 2023-2028 (%)
        • Data Table on Market share by geography 2023-2028 (%)
      • 11.2 Geographic comparison
        • Chart on Geographic comparison
        • Data Table on Geographic comparison
      • 11.3 APAC - Market size and forecast 2023-2028
        • Chart on APAC - Market size and forecast 2023-2028 ($ billion)
        • Data Table on APAC - Market size and forecast 2023-2028 ($ billion)
        • Chart on APAC - Year-over-year growth 2023-2028 (%)
        • Data Table on APAC - Year-over-year growth 2023-2028 (%)
      • 11.4 North America - Market size and forecast 2023-2028
        • Chart on North America - Market size and forecast 2023-2028 ($ billion)
        • Data Table on North America - Market size and forecast 2023-2028 ($ billion)
        • Chart on North America - Year-over-year growth 2023-2028 (%)
        • Data Table on North America - Year-over-year growth 2023-2028 (%)
      • 11.5 Europe - Market size and forecast 2023-2028
        • Chart on Europe - Market size and forecast 2023-2028 ($ billion)
        • Data Table on Europe - Market size and forecast 2023-2028 ($ billion)
        • Chart on Europe - Year-over-year growth 2023-2028 (%)
        • Data Table on Europe - Year-over-year growth 2023-2028 (%)
      • 11.6 South America - Market size and forecast 2023-2028
        • Chart on South America - Market size and forecast 2023-2028 ($ billion)
        • Data Table on South America - Market size and forecast 2023-2028 ($ billion)
        • Chart on South America - Year-over-year growth 2023-2028 (%)
        • Data Table on South America - Year-over-year growth 2023-2028 (%)
      • 11.7 Middle East and Africa - Market size and forecast 2023-2028
        • Chart on Middle East and Africa - Market size and forecast 2023-2028 ($ billion)
        • Data Table on Middle East and Africa - Market size and forecast 2023-2028 ($ billion)
        • Chart on Middle East and Africa - Year-over-year growth 2023-2028 (%)
        • Data Table on Middle East and Africa - Year-over-year growth 2023-2028 (%)
      • 11.8 China - Market size and forecast 2023-2028
        • Chart on China - Market size and forecast 2023-2028 ($ billion)
        • Data Table on China - Market size and forecast 2023-2028 ($ billion)
        • Chart on China - Year-over-year growth 2023-2028 (%)
        • Data Table on China - Year-over-year growth 2023-2028 (%)
      • 11.9 US - Market size and forecast 2023-2028
        • Chart on US - Market size and forecast 2023-2028 ($ billion)
        • Data Table on US - Market size and forecast 2023-2028 ($ billion)
        • Chart on US - Year-over-year growth 2023-2028 (%)
        • Data Table on US - Year-over-year growth 2023-2028 (%)
      • 11.10 Germany - Market size and forecast 2023-2028
        • Chart on Germany - Market size and forecast 2023-2028 ($ billion)
        • Data Table on Germany - Market size and forecast 2023-2028 ($ billion)
        • Chart on Germany - Year-over-year growth 2023-2028 (%)
        • Data Table on Germany - Year-over-year growth 2023-2028 (%)
      • 11.11 India - Market size and forecast 2023-2028
        • Chart on India - Market size and forecast 2023-2028 ($ billion)
        • Data Table on India - Market size and forecast 2023-2028 ($ billion)
        • Chart on India - Year-over-year growth 2023-2028 (%)
        • Data Table on India - Year-over-year growth 2023-2028 (%)
      • 11.12 Canada - Market size and forecast 2023-2028
        • Chart on Canada - Market size and forecast 2023-2028 ($ billion)
        • Data Table on Canada - Market size and forecast 2023-2028 ($ billion)
        • Chart on Canada - Year-over-year growth 2023-2028 (%)
        • Data Table on Canada - Year-over-year growth 2023-2028 (%)
      • 11.13 Market opportunity by geography
        • Market opportunity by geography ($ billion)
        • Data Tables on Market opportunity by geography ($ billion)
      • 11.14 Brazil - Market size and forecast (2023-2028)
        • Chart on Brazil - Market size and forecast (2023-2028) ($ billion)
        • Data Table on Brazil - Market size and forecast (2023-2028) ($ billion)
        • Chart on Brazil - Year-over-year growth (2023-2028) (%)
        • Data Table on Brazil - Year-over-year growth (2023-2028) (%)
      • 11.15 UAE - Market size and forecast (2023-2028)
        • Chart on UAE - Market size and forecast (2023-2028) ($ billion)
        • Data Table on UAE - Market size and forecast (2023-2028) ($ billion)
        • Chart on UAE - Year-over-year growth (2023-2028) (%)
        • Data Table on UAE - Year-over-year growth (2023-2028) (%)
      • 11.16 SouthAfrica - Market size and forecast (2023-2028)
        • Chart on SouthAfrica - Market size and forecast (2023-2028) ($ billion)
        • Data Table on SouthAfrica - Market size and forecast (2023-2028) ($ billion)
        • Chart on SouthAfrica - Year-over-year growth (2023-2028) (%)
        • Data Table on SouthAfrica - Year-over-year growth (2023-2028) (%)
      • 11.17 Spain - Market size and forecast (2023-2028)
        • Chart on Spain - Market size and forecast (2023-2028) ($ billion)
        • Data Table on Spain - Market size and forecast (2023-2028) ($ billion)
        • Chart on Spain - Year-over-year growth (2023-2028) (%)
        • Data Table on Spain - Year-over-year growth (2023-2028) (%)
      • 11.18 Rest of World (ROW) - Market size and forecast (2023-2028)
        • Chart on Rest of World (ROW) - Market size and forecast (2023-2028) ($ billion)
        • Data Table on Rest of World (ROW) - Market size and forecast (2023-2028) ($ billion)
        • Chart on Rest of World (ROW) - Year-over-year growth (2023-2028) (%)
        • Data Table on Rest of World (ROW) - Year-over-year growth (2023-2028) (%)

      12 Drivers, Challenges, and Opportunity/Restraints

      • 12.1 Market drivers
        • 12.2 Market challenges
          • 12.3 Impact of drivers and challenges
            • Impact of drivers and challenges in 2023 and 2028
          • 12.4 Market opportunities/restraints

            13 Competitive Landscape

            • 13.1 Overview
              • 13.2 Competitive Landscape
                • Overview on criticality of inputs and factors of differentiation
              • 13.3 Landscape disruption
                • Overview on factors of disruption
              • 13.4 Industry risks
                • Impact of key risks on business

              14 Competitive Analysis

              • 14.1 Companies profiled
                • Companies covered
              • 14.2 Market positioning of companies
                • Matrix on companies position and classification
              • 14.3 Abbott Laboratories
                • Abbott Laboratories - Overview
                • Abbott Laboratories - Business segments
                • Abbott Laboratories - Key news
                • Abbott Laboratories - Key offerings
                • Abbott Laboratories - Segment focus
              • 14.4 Amway Corp.
                • Amway Corp. - Overview
                • Amway Corp. - Product / Service
                • Amway Corp. - Key news
                • Amway Corp. - Key offerings
              • 14.5 Archer Daniels Midland Co.
                • Archer Daniels Midland Co. - Overview
                • Archer Daniels Midland Co. - Business segments
                • Archer Daniels Midland Co. - Key news
                • Archer Daniels Midland Co. - Key offerings
                • Archer Daniels Midland Co. - Segment focus
              • 14.6 BASF SE
                • BASF SE - Overview
                • BASF SE - Business segments
                • BASF SE - Key news
                • BASF SE - Key offerings
                • BASF SE - Segment focus
              • 14.7 Bayer AG
                • Bayer AG - Overview
                • Bayer AG - Business segments
                • Bayer AG - Key news
                • Bayer AG - Key offerings
                • Bayer AG - Segment focus
              • 14.8 Chr Hansen Holding AS
                • Chr Hansen Holding AS - Overview
                • Chr Hansen Holding AS - Business segments
                • Chr Hansen Holding AS - Key news
                • Chr Hansen Holding AS - Key offerings
                • Chr Hansen Holding AS - Segment focus
              • 14.9 Corbion nv
                • Corbion nv - Overview
                • Corbion nv - Business segments
                • Corbion nv - Key news
                • Corbion nv - Key offerings
                • Corbion nv - Segment focus
              • 14.10 DuPont de Nemours Inc.
                • DuPont de Nemours Inc. - Overview
                • DuPont de Nemours Inc. - Business segments
                • DuPont de Nemours Inc. - Key news
                • DuPont de Nemours Inc. - Key offerings
                • DuPont de Nemours Inc. - Segment focus
              • 14.11 Glanbia plc
                • Glanbia plc - Overview
                • Glanbia plc - Business segments
                • Glanbia plc - Key news
                • Glanbia plc - Key offerings
                • Glanbia plc - Segment focus
              • 14.12 Herbalife International of America Inc.
                • Herbalife International of America Inc. - Overview
                • Herbalife International of America Inc. - Product / Service
                • Herbalife International of America Inc. - Key news
                • Herbalife International of America Inc. - Key offerings
              • 14.13 Kerry Group Plc
                • Kerry Group Plc - Overview
                • Kerry Group Plc - Business segments
                • Kerry Group Plc - Key news
                • Kerry Group Plc - Key offerings
                • Kerry Group Plc - Segment focus
              • 14.14 Koninklijke DSM NV
                • Koninklijke DSM NV - Overview
                • Koninklijke DSM NV - Business segments
                • Koninklijke DSM NV - Key news
                • Koninklijke DSM NV - Key offerings
                • Koninklijke DSM NV - Segment focus
              • 14.15 Nestle SA
                • Nestle SA - Overview
                • Nestle SA - Business segments
                • Nestle SA - Key news
                • Nestle SA - Key offerings
                • Nestle SA - Segment focus
              • 14.16 Pharmavite LLC
                • Pharmavite LLC - Overview
                • Pharmavite LLC - Product / Service
                • Pharmavite LLC - Key offerings
              • 14.17 USANA Health Science Inc.
                • USANA Health Science Inc. - Overview
                • USANA Health Science Inc. - Product / Service
                • USANA Health Science Inc. - Key offerings

              15 Appendix

              • 15.1 Scope of the report
                • 15.2 Inclusions and exclusions checklist
                  • Inclusions checklist
                  • Exclusions checklist
                • 15.3 Currency conversion rates for US$
                  • Currency conversion rates for US$
                • 15.4 Research methodology
                  • Research methodology
                • 15.5 Data procurement
                  • Information sources
                • 15.6 Data validation
                  • Data validation
                • 15.7 Validation techniques employed for market sizing
                  • Validation techniques employed for market sizing
                • 15.8 Data synthesis
                  • Data synthesis
                • 15.9 360 degree market analysis
                  • 360 degree market analysis
                • 15.10 List of abbreviations
                  • List of abbreviations

                Research Methodology

                Technavio presents a detailed picture of the market by way of study, synthesis, and summation of data from multiple sources. The analysts have presented the various facets of the market with a particular focus on identifying the key industry influencers. The data thus presented is comprehensive, reliable, and the result of extensive research, both primary and secondary.

                INFORMATION SOURCES

                Primary sources

                • Manufacturers and suppliers
                • Channel partners
                • Industry experts
                • Strategic decision makers

                Secondary sources

                • Industry journals and periodicals
                • Government data
                • Financial reports of key industry players
                • Historical data
                • Press releases

                DATA ANALYSIS

                Data Synthesis

                • Collation of data
                • Estimation of key figures
                • Analysis of derived insights

                Data Validation

                • Triangulation with data models
                • Reference against proprietary databases
                • Corroboration with industry experts

                REPORT WRITING

                Qualitative

                • Market drivers
                • Market challenges
                • Market trends
                • Five forces analysis

                Quantitative

                • Market size and forecast
                • Market segmentation
                • Geographical insights
                • Competitive landscape

                Interested in this report?

                Get your sample now to see our research methodology and insights!

                Download Now

                Frequently Asked Questions

                Nutrition market growth will increase by $ 35 bn during 2024-2028.

                The Nutrition market is expected to grow at a CAGR of 4.36% during 2024-2028.

                Nutrition market is segmented by Type( Vitamins, Probiotics, Proteins and amino acids, Carbohydrates, Others) Application( Immunity, Sports nutrition, Weight management, Clinical nutrition, Others)

                Abbott Laboratories, Amway Corp., Archer Daniels Midland Co., BASF SE, Bayer AG, Chr Hansen Holding AS, Corbion nv, DuPont de Nemours Inc., Glanbia plc, Herbalife International of America Inc., Johnson and Johnson Services Inc., Kerry Group Plc, Koninklijke DSM NV, Nestle SA, NOW Health Group Inc., Pharmavite LLC, PMV Nutrient Products Pvt. Ltd., Premier Nutrition Co. LLC, The Bountiful Co., USANA Health Science Inc. are a few of the key vendors in the Nutrition market.

                APAC will register the highest growth rate of 46% among the other regions. Therefore, the Nutrition market in APAC is expected to garner significant business opportunities for the vendors during the forecast period.

                China, US, Germany, India, Canada, Brazil, UAE, SouthAfrica, Spain

                • Growing geriatric populationThe global population is growing rapidly. Between 2010 and 2050 is the driving factor this market.
                • the geriatric population of less developed countries will increase faster when compared with developed countries. Longevity and a decrease in fertility rates are the major reasons for the growth of the geriatric population. The geriatric population is a major proportion of the population of developed and developing countries. The geriatric population of countries such as the US is the driving factor this market.
                • South Korea is the driving factor this market.
                • China is the driving factor this market.
                • Japan is the driving factor this market.
                • Italy is the driving factor this market.
                • Russia is the driving factor this market.
                • Australia is the driving factor this market.
                • Germany is the driving factor this market.
                • Taiwan is the driving factor this market.
                • Canada is the driving factor this market.
                • Poland is the driving factor this market.
                • and Ukraine is also growing is the driving factor this market.
                • which strives for the growth of the global nutrition market during the forecast period. For instance is the driving factor this market.
                • according to The World Bank Group is the driving factor this market.
                • about 16% and 18.9% of the total population of the US and the UK were 65 years and above in 2020. The growth of the geriatric population is a major concern for countries such as Japan is the driving factor this market.
                • South Korea is the driving factor this market.
                • China is the driving factor this market.
                • Germany is the driving factor this market.
                • and the US. Aging increases the chances of chronic diseases. For instance is the driving factor this market.
                • the most common diseases associated with the geriatric population are arthritis is the driving factor this market.
                • diabetes is the driving factor this market.
                • osteoporosis is the driving factor this market.
                • and obesity. Approximately 30%-35% of the geriatric population does not have natural teeth and have poor oral health. Hence is the driving factor this market.
                • the metabolism of the geriatric population is affected. Owing to such conditions is the driving factor this market.
                • hospital admission rates are high among the geriatric population. With the increasing prevalence of several diseases among the geriatric population is the driving factor this market.
                • the required nutrients cannot be absorbed from the diet. Hence is the driving factor this market.
                • the geriatric population requires nutrition. In some conditions is the driving factor this market.
                • geriatric patients cannot use enteral nutrition. Hence is the driving factor this market.
                • they are recommended for parenteral nutrition by healthcare professionals. Parenteral nutrition is commonly used by people who are admitted to hospitals and people who use home care. Hence is the driving factor this market.
                • the growth of the geriatric population will increase the consumption of nutrition is the driving factor this market.
                • which will drive the growth of the global nutrition market. is the driving factor this market.

                The Nutrition market vendors should focus on grabbing business opportunities from the Vitamins segment as it accounted for the largest market share in the base year.