Next Generation 3D Display Market Analysis APAC, North America, Europe, Middle East and Africa, South America - US, China, South Korea, Germany, UK - Size and Forecast 2024-2028

Next Generation 3D Display Market Analysis APAC, North America, Europe, Middle East and Africa, South America - US, China, South Korea, Germany, UK - Size and Forecast 2024-2028

Published: Jun 2024 182 Pages SKU: IRTNTR72456

Market Overview at a Glance

$1.05 B
Market Opportunity
18.52%
CAGR
15.17
YoY growth 2023-2024(%)

Next Generation 3D Display Market Size 2024-2028

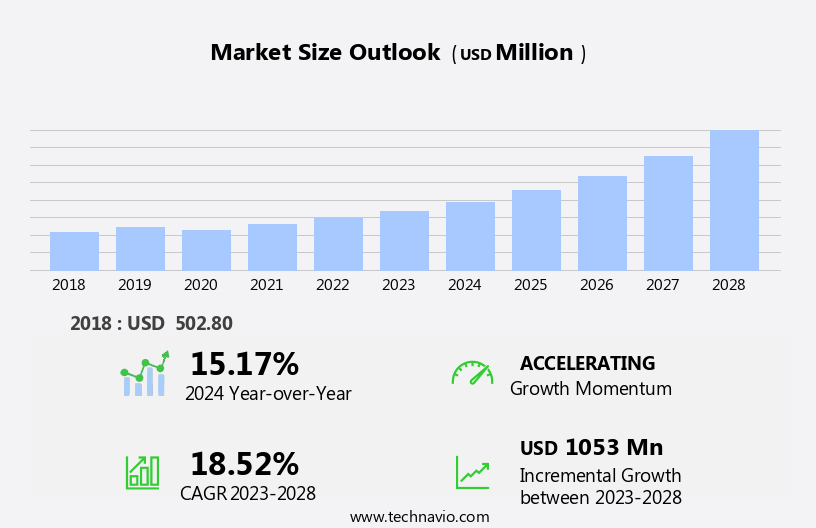
The next generation 3d display market size is forecast to increase by USD 1.05 billion at a CAGR of 18.52% between 2023 and 2028.

  • The market is experiencing significant growth, driven by the increasing adoption of virtual reality (VR) technology in gaming and entertainment. This immersive technology offers a more engaging user experience, making it an attractive option for consumers. Additionally, the healthcare industry is witnessing an upward trend In the utilization of 3D displays for medical imaging and surgical planning, enhancing diagnostic accuracy and improving patient outcomes. However, the high cost associated with producing and implementing 3D displays remains a challenge for market growth. Despite this, the potential benefits of 3D displays in various industries, including education, advertising, and engineering, are expected to fuel market expansion.
  • In summary, the 3D display market is poised for growth due to the increasing popularity of VR technology and its applications in various sectors, the expanding usage In the medical industry, and the potential for enhanced user experience. However, the high cost of production and implementation remains a significant challenge that needs to be addressed.
  • What will be the Size of the Next Generation 3D Display Market During the Forecast Period?

    Next Generation 3D Display Market Size

     Request Free Sample

  • The market is experiencing significant growth due to advancements in 3D technology and increasing demand for immersive home entertainment and industrial automation applications. Smart TVs and PC gaming industries are leading the charge, with high-definition graphics and visual comfort becoming key differentiators for electronic devices. The market is also being driven by the deployment of 5G networks, enabling faster data transfer and smoother 3D experiences. The gaming and industrial sectors are expected to dominate the market, with the middleclass population and rising disposable income fueling demand. 3D technology is also gaining traction in VR and AR applications, as well as in niche markets like NFTs and projectors.
  • Panel manufacturing companies like LCD, LED, and OLED are investing heavily in research and development to meet the growing demand for advanced 3D displays. However, health-related issues and the need for industry standards are potential challenges that must be addressed to ensure the widespread adoption of next-generation 3D displays.
  • How is this Next Generation 3D Display Industry segmented and which is the largest segment?

    The next generation 3d display industry research report provides comprehensive data (region-wise segment analysis), with forecasts and estimates in "USD million" for the period 2024-2028, as well as historical data from 2018-2022 for the following segments.
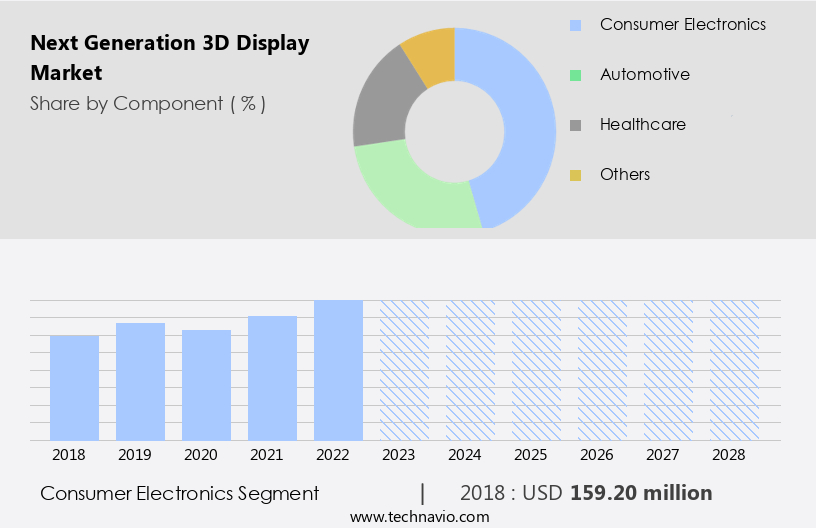
    • Component
      • Consumer electronics
      • Automotive
      • Healthcare
      • Others
    • Product
      • Stereoscopic display
      • Volumetric display
      • HMD
      • Others
    • Geography
      • APAC
        • China
        • South Korea
      • North America
        • US
      • Europe
        • Germany
        • UK
      • Middle East and Africa
        • South America

        By Component Insights

        • The consumer electronics segment is estimated to witness significant growth during the forecast period.

        The 3D display market encompasses a range of consumer electronics, including 3D projectors, gaming consoles, holographic displays, smartphones, tablets, personal computers, and TVs. These devices require intricate and advanced electronics and technology to ensure seamless 3D functionality. The emergence of augmented reality (AR) and virtual reality (VR) technology, based on binocular vision display and light field display, is driving the future growth of holographic displays. This presents significant opportunities for next-generation 3D displays In the consumer electronics sector. For instance, Facebook entered the VR market with the release of the Oculus Go and Quest, a standalone and tethered headset, respectively.

        The advancement of 5G deployment, industrial automation, and high-definition graphics in various industries further boosts the demand for superior image quality and response time in 3D displays. Key applications include PC gaming, VR, 3D movies, animations, and video games. As disposable income increases and standards of living rise, the consumer base for these advanced electronic devices expands, particularly among the middleclass population. Key players In the industry include Ericsson, HMS Networks, and Samsung Electronics, among others. 3D technology continues to revolutionize consumer electronics, offering immersive experiences in home entertainment, gaming industries, and digital photo frames, among others.

        Next Generation 3D Display Market Size

        Get a glance at the  Next Generation 3D Display Industry report of share of various segments Request Free Sample

        The Consumer electronics segment was valued at USD 159.20 billion in 2018 and showed a gradual increase during the forecast period.

        Regional Analysis

        • North America is estimated to contribute 37% to the growth of the global market during the forecast period.

        Technavio’s analysts have elaborately explained the regional trends and drivers that shape the market during the forecast period.

        Next Generation 3D Display Market Share by Geography

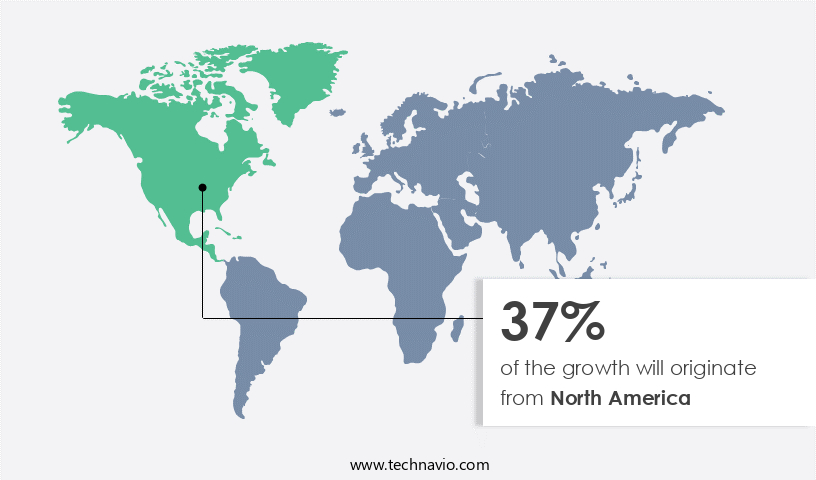
        For more insights on the market share of various regions, Request Free Sample

        The Asia Pacific (APAC) region, with advanced consumer electronics industries in countries like China, Taiwan, and South Korea, is expected to lead the market by 2023. The region's well-established electronics supply chain will continue to fuel market growth. APAC is a significant hub for consumer electronics manufacturers, producing TVs, smartphones, tablets, and wearables. The expansion of this industry will increase demand for advanced electronic devices, propelling the market forward. Key applications include 8K television, visual comfort for smart TVs, industrial automation, PC gaming, VR, and 3D displays for consumer devices like monitors, TVs, digital photo frames, notebook computers, and projectors.

        Industries like healthcare, digital cinema, and HMD displays are also adopting 3D technology. Companies like Samsung Electronics, ZTE, Nubia, Acer, Asus, and Ericsson are investing in 3D displays, driven by consumer demand and 5G deployment. The market will be shaped by high-definition graphics, response time, and image quality, with technologies like Micro OLED, stereoscopic displays, DLP, PDP, and LED panels. The gaming industries, home entertainment, and electronic devices will benefit from these advancements, as will the middle class population with increasing disposable income. Standards of living and digitalization will further influence market growth. Keywords: the market, Asia Pacific, consumer electronics, 8K television, visual comfort, smart TV, industrial automation, PC gaming, VR, 3D displays, digital cinema screens, HMD display, Micro OLED, stereoscopic displays, DLP, PDP, LED panels, image quality, response time, Samsung Electronics, ZTE, Nubia, Acer, Asus, Ericsson.

        Market Dynamics

        Our  researchers analyzed the data with 2023 as the base year, along with the key drivers, trends, and challenges. A holistic analysis of drivers will help companies refine their marketing strategies to gain a competitive advantage.

        What are the key market drivers leading to the rise In the adoption of Next Generation 3D Display Industry?

        Increasing advent of VR in gaming is the key driver of the market.

      • The market is experiencing significant growth due to the increasing adoption of Virtual Reality (VR) technology in various industries. Companies like Samsung Electronics are investing heavily in panel manufacturing for 8K television sets, enhancing visual comfort for consumers with high-definition graphics and 3D technology. In the consumer electronics sector, smart TVs, monitors, digital photo frames, and notebook computers are integrating 3D displays, catering to the middleclass population's rising disposable income and standards of living. Industrial automation sectors, including HMS Networks and others, are implementing 3D displays for improved image quality and response time In their operations. In the gaming industries, 3D displays are gaining popularity for PC gaming and VR applications, with companies like ZTE, Nubia, Acer, and Asus introducing innovative 3D displays for their products.
      • Moreover, the 5G deployment is expected to accelerate the growth of the market, enabling seamless connectivity and faster data transfer for 3D content. Companies like Ericsson are developing advanced 3D displays, such as the ELF-SR2, for digital cinema screens, projectors, and HMD displays. Health-related issues, such as eye strain and fatigue, are driving the demand for 3D displays with autostereoscopic technology, which eliminates the need for glasses. Technologies like DLP, PDP, and LED panels are being used to develop 3D displays with superior image quality, faster response time, and lower power consumption. Furthermore, the 3D displays market is witnessing growth in sectors like academics, movies, animations, and video games, as they offer an immersive experience for users.
      • Companies like Motorola are introducing 4K OLED and LCD displays with 3D technology In their devices, such as the Edge 40. In conclusion, the market is witnessing significant growth due to the increasing adoption of VR technology, rising disposable income, and the need for improved visual comfort and immersive experiences in various industries. Companies are investing in advanced 3D display technologies, such as autostereoscopic displays, to cater to the evolving demands of consumers and industries.
      • What are the market trends shaping the Next Generation 3D Display Industry?

        Increasing usage of 3D display in medical industry is the upcoming market trend.

      • The market is experiencing significant growth due to advancements in technology and increasing demand for immersive visual experiences. Samsung Electronics, a leading player in consumer electronics, is investing heavily in panel manufacturing for 8K television sets with 3D displays, enhancing visual comfort for viewers. Smart TVs from brands like ZTE, Nubia, Acer, and Asus are integrating 3D technology, offering innovative solutions for home entertainment and PC gaming. The 5G deployment is fueling the adoption of 3D displays in industrial automation and VR applications, with companies like HMS Networks and Ericsson leading the charge. High-definition graphics and health-related issues are driving the need for 3D displays in digital photo frames, notebook computers, and monitors.
      • 3D displays are revolutionizing industries, from gaming industries to academics and movies, with advancements in autostereoscopic technology, such as DLP, PDP, LED panels, and Micro OLED. Image quality and response time are critical factors In the selection of these displays, with HMD displays and stereoscopic displays gaining popularity. As disposable income increases and standards of living rise, the demand for 4K and 3D displays is expected to grow. NFTs and digital cinema screens are also adopting 3D technology, offering new opportunities for content creators and consumers alike. The future of 3D displays is bright, with continuous innovation and advancements in technology driving the market forward.
      • What challenges does the Next Generation 3D Display Industry face during its growth?

        High cost associated with 3D displays is a key challenge affecting the industry growth.

      • The market is experiencing growth driven by advancements in technology and increasing demand for immersive viewing experiences. Samsung Electronics, along with other industry leaders, is at the forefront of panel manufacturing for 3D displays, which are being integrated into various consumer electronics, including 8K televisions, smart TVs, digital photo frames, notebook computers, and monitors. The adoption of 5G deployment is also fueling the market, enabling faster data transfer for high-definition graphics and real-time interaction in applications such as industrial automation, PC gaming, VR, and movies. Despite these market drivers, the high cost of next generation 3D display devices remains a significant barrier to entry for many consumers.
      • The expensive price point of 3D game consoles, ranging from USD200 to USD400, and 3D projectors, priced between USD1,000 and USD10,000, makes it difficult for individuals with lower disposable incomes to access these technologies. Moreover, the cost extends beyond the display itself, with the need to purchase new 3D-compatible games or software and the high maintenance and repair costs associated with the more complex technology. Key applications for next generation 3D displays include gaming industries, home entertainment, and electronic devices. The use of autostereoscopic technology, such as DLP, PDP, LED panels, and Micro OLED, enables high image quality and fast response times.
      • Additionally, HMD displays, stereoscopic displays, and digital cinema screens offer unique viewing experiences for academics, movies, animations, and video games. Companies like ZTE, Nubia pad 3D, Acer, Asus, Ericsson, and Motorola are investing in research and development to bring down the cost and improve the accessibility of next generation 3D displays. However, health-related issues, such as eye strain and headaches, are a concern for some consumers. The high definition technology, while impressive, can also contribute to these issues, making it essential for manufacturers to address these concerns through innovative design and technology solutions. As the market evolves, it is expected that standards of living and consumer preferences will continue to drive the adoption of next generation 3D displays, with NFTs and other emerging trends potentially opening up new opportunities for growth.
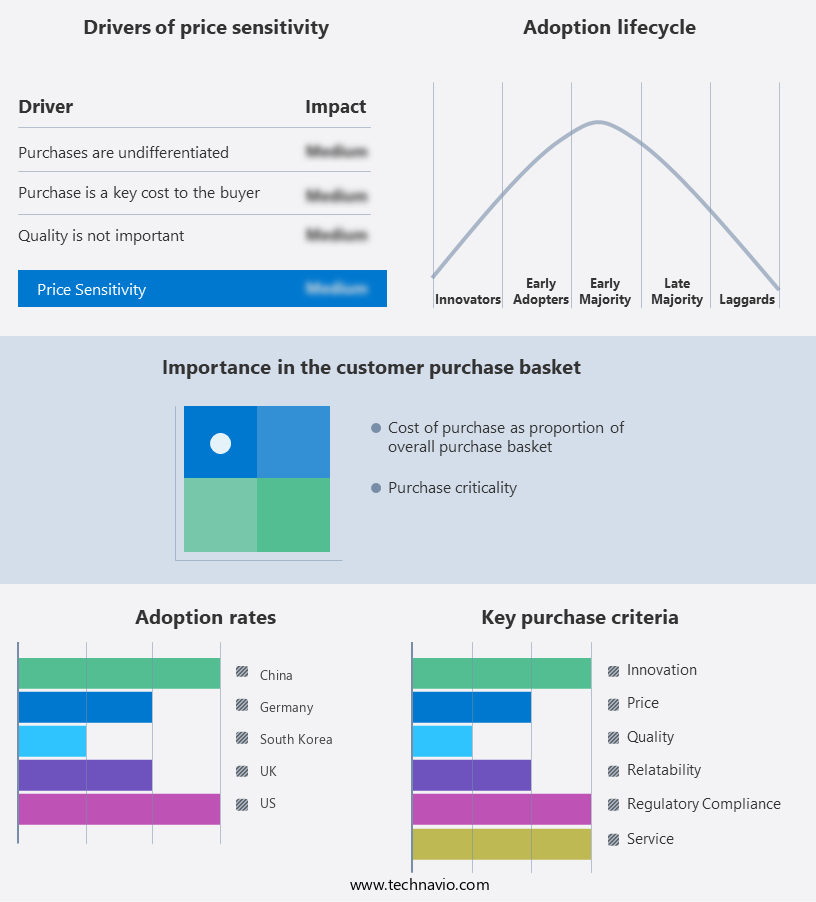
      • Exclusive Customer Landscape

        The next generation 3d display market forecasting report includes the adoption lifecycle of the market, covering from the innovator’s stage to the laggard’s stage. It focuses on adoption rates in different regions based on penetration. Furthermore, the next generation 3d display market report also includes key purchase criteria and drivers of price sensitivity to help companies evaluate and develop their market growth analysis strategies.

        Next Generation 3D Display Market Share by Geography

         Customer Landscape

        Key Companies & Market Insights

        Companies are implementing various strategies, such as strategic alliances, next generation 3d display market forecast, partnerships, mergers and acquisitions, geographical expansion, and product/service launches, to enhance their presence In the industry.

        Alphabet Inc. - Google LLC, a subsidiary of the tech conglomerate, spearheads the market with advanced technology and innovation. This cutting-edge display solution offers enhanced depth perception and visual experience, setting new standards In the industry. With a focus on delivering superior image quality and immersive viewing, the company's 3D display technology is poised to revolutionize various sectors, including gaming, healthcare, education, and entertainment. The technology's ability to create lifelike images and provide a more engaging user experience positions it as a game-changer In the digital world.

        The industry research and growth report includes detailed analyses of the competitive landscape of the market and information about key companies, including:

        • Alphabet Inc.
        • AUO Corp.
        • Avalon Holographics Inc.
        • Avegant Corp.
        • Continental AG
        • CREAL SA
        • Dimenco BV
        • FoVI3D
        • Holografika Kft.
        • LG Electronics Inc.
        • Looking Glass Factory Inc.
        • NVIDIA Corp.
        • Ostendo Technologies Inc.
        • Panasonic Holdings Corp.
        • Robert Bosch GmbH
        • Samsung Electronics Co. Ltd.
        • SeeReal Technologies SA
        • Sharp Corp.
        • Toshiba Corp.
        • VividQ Ltd.

        Qualitative and quantitative analysis of companies has been conducted to help clients understand the wider business environment as well as the strengths and weaknesses of key industry players. Data is qualitatively analyzed to categorize companies as pure play, category-focused, industry-focused, and diversified; it is quantitatively analyzed to categorize companies as dominant, leading, strong, tentative, and weak.

        Research Analyst Overview

        The market is experiencing significant growth as technology advances and consumer demand for immersive visual experiences increases. This market encompasses various applications, including consumer electronics, industrial automation, digital photo frames, notebook computers, and more. The 3D display industry is driven by several factors. Firstly, the gaming industries are a major contributor to the market's growth, as gamers seek more realistic and engaging experiences. Additionally, home entertainment is another significant application, with 3D TVs and monitors offering a more cinematic experience for movies and animations. The technology behind 3D displays has evolved significantly over the years. Autostereoscopic technology, which allows for 3D viewing without the need for special glasses, is becoming increasingly popular.

        This technology is used in various displays, such as smartphones, tablets, and monitors. Another technology gaining traction is holographic and micro-OLED displays. These displays offer high definition graphics and image quality, making them suitable for various applications, including digital cinema screens and VR headsets. Moreover, the 3D display market is being influenced by the ongoing digital transformation and the increasing adoption of 5G networks. The deployment of 5G networks is expected to accelerate the growth of the 3D display market, as it enables faster data transfer and lower latency, enhancing the user experience. The market for 3D displays is also being driven by the growing middleclass population and increasing disposable income.

        As standards of living improve, consumers are willing to invest in high-end electronic devices, including 3D displays. The 3D display market is a dynamic and competitive landscape. Companies are investing heavily in research and development to innovate and differentiate themselves. The market is expected to continue growing, driven by technological advancements and increasing consumer demand for immersive visual experiences. In conclusion, the market is poised for significant growth, driven by various applications, technological advancements, and increasing consumer demand. The market is expected to continue evolving, offering innovative and immersive visual experiences for various industries and applications.

        Market Scope

        Report Coverage

        Details

        Page number

        182

        Base year

        2023

        Historic period

        2018-2022

        Forecast period

        2024-2028

        Growth momentum & CAGR

        Accelerate at a CAGR of 18.52%

        Market growth 2024-2028

        USD 1053 million

        Market structure

        Fragmented

        YoY growth 2023-2024(%)

        15.17

        Key countries

        US, China, South Korea, Germany, and UK

        Competitive landscape

        Leading Companies, Market Positioning of Companies, Competitive Strategies, and Industry Risks

        Request Free Sample

        What are the Key Data Covered in this Next Generation 3D Display Market Research and Growth Report?

        • CAGR of the Next Generation 3D Display industry during the forecast period
        • Detailed information on factors that will drive the growth and forecasting between 2024 and 2028
        • Precise estimation of the size of the market and its contribution of the industry in focus to the parent market
        • Accurate predictions about upcoming growth and trends and changes in consumer behaviour
        • Growth of the market across APAC, North America, Europe, Middle East and Africa, and South America
        • Thorough analysis of the market’s competitive landscape and detailed information about companies
        • Comprehensive analysis of factors that will challenge the next generation 3d display market growth of industry companies

        We can help! Our analysts can customize this next generation 3d display market research report to meet your requirements.

        Get in touch


        1 Executive Summary

        • 1.1 Market overview
          • Executive Summary - Chart on Market Overview
          • Executive Summary - Data Table on Market Overview
          • Executive Summary - Chart on Global Market Characteristics
          • Executive Summary - Chart on Market by Geography
          • Executive Summary - Chart on Market Segmentation by Component
          • Executive Summary - Chart on Market Segmentation by Product
          • Executive Summary - Chart on Incremental Growth
          • Executive Summary - Data Table on Incremental Growth
          • Executive Summary - Chart on Company Market Positioning

        2 Market Landscape

        • 2.1 Market ecosystem
          • Parent Market
          • Data Table on - Parent Market
        • 2.2 Market characteristics
          • Market characteristics analysis
        • 2.3 Value chain analysis
          • Value Chain Analysis

        3 Market Sizing

        • 3.1 Market definition
          • Offerings of companies included in the market definition
        • 3.2 Market segment analysis
          • Market segments
        • 3.3 Market size 2023
          • 3.4 Market outlook: Forecast for 2023-2028
            • Chart on Global - Market size and forecast 2023-2028 ($ million)
            • Data Table on Global - Market size and forecast 2023-2028 ($ million)
            • Chart on Global Market: Year-over-year growth 2023-2028 (%)
            • Data Table on Global Market: Year-over-year growth 2023-2028 (%)

          4 Historic Market Size

          • 4.1 Global Next Generation 3D Display Market 2018 - 2022
            • Historic Market Size - Data Table on Global Next Generation 3D Display Market 2018 - 2022 ($ million)
          • 4.2 Component segment analysis 2018 - 2022
            • Historic Market Size - Component Segment 2018 - 2022 ($ million)
          • 4.3 Product segment analysis 2018 - 2022
            • Historic Market Size - Product Segment 2018 - 2022 ($ million)
          • 4.4 Geography segment analysis 2018 - 2022
            • Historic Market Size - Geography Segment 2018 - 2022 ($ million)
          • 4.5 Country segment analysis 2018 - 2022
            • Historic Market Size - Country Segment 2018 - 2022 ($ million)

          5 Five Forces Analysis

          • 5.1 Five forces summary
            • Five forces analysis - Comparison between 2023 and 2028
          • 5.2 Bargaining power of buyers
            • Bargaining power of buyers - Impact of key factors 2023 and 2028
          • 5.3 Bargaining power of suppliers
            • Bargaining power of suppliers - Impact of key factors in 2023 and 2028
          • 5.4 Threat of new entrants
            • Threat of new entrants - Impact of key factors in 2023 and 2028
          • 5.5 Threat of substitutes
            • Threat of substitutes - Impact of key factors in 2023 and 2028
          • 5.6 Threat of rivalry
            • Threat of rivalry - Impact of key factors in 2023 and 2028
          • 5.7 Market condition
            • Chart on Market condition - Five forces 2023 and 2028

          6 Market Segmentation by Component

          • 6.1 Market segments
            • Chart on Component - Market share 2023-2028 (%)
            • Data Table on Component - Market share 2023-2028 (%)
          • 6.2 Comparison by Component
            • Chart on Comparison by Component
            • Data Table on Comparison by Component
          • 6.3 Consumer electronics - Market size and forecast 2023-2028
            • Chart on Consumer electronics - Market size and forecast 2023-2028 ($ million)
            • Data Table on Consumer electronics - Market size and forecast 2023-2028 ($ million)
            • Chart on Consumer electronics - Year-over-year growth 2023-2028 (%)
            • Data Table on Consumer electronics - Year-over-year growth 2023-2028 (%)
          • 6.4 Automotive - Market size and forecast 2023-2028
            • Chart on Automotive - Market size and forecast 2023-2028 ($ million)
            • Data Table on Automotive - Market size and forecast 2023-2028 ($ million)
            • Chart on Automotive - Year-over-year growth 2023-2028 (%)
            • Data Table on Automotive - Year-over-year growth 2023-2028 (%)
          • 6.5 Healthcare - Market size and forecast 2023-2028
            • Chart on Healthcare - Market size and forecast 2023-2028 ($ million)
            • Data Table on Healthcare - Market size and forecast 2023-2028 ($ million)
            • Chart on Healthcare - Year-over-year growth 2023-2028 (%)
            • Data Table on Healthcare - Year-over-year growth 2023-2028 (%)
          • 6.6 Others - Market size and forecast 2023-2028
            • Chart on Others - Market size and forecast 2023-2028 ($ million)
            • Data Table on Others - Market size and forecast 2023-2028 ($ million)
            • Chart on Others - Year-over-year growth 2023-2028 (%)
            • Data Table on Others - Year-over-year growth 2023-2028 (%)
          • 6.7 Market opportunity by Component
            • Market opportunity by Component ($ million)
            • Data Table on Market opportunity by Component ($ million)

          7 Market Segmentation by Product

          • 7.1 Market segments
            • Chart on Product - Market share 2023-2028 (%)
            • Data Table on Product - Market share 2023-2028 (%)
          • 7.2 Comparison by Product
            • Chart on Comparison by Product
            • Data Table on Comparison by Product
          • 7.3 Stereoscopic display - Market size and forecast 2023-2028
            • Chart on Stereoscopic display - Market size and forecast 2023-2028 ($ million)
            • Data Table on Stereoscopic display - Market size and forecast 2023-2028 ($ million)
            • Chart on Stereoscopic display - Year-over-year growth 2023-2028 (%)
            • Data Table on Stereoscopic display - Year-over-year growth 2023-2028 (%)
          • 7.4 Volumetric display - Market size and forecast 2023-2028
            • Chart on Volumetric display - Market size and forecast 2023-2028 ($ million)
            • Data Table on Volumetric display - Market size and forecast 2023-2028 ($ million)
            • Chart on Volumetric display - Year-over-year growth 2023-2028 (%)
            • Data Table on Volumetric display - Year-over-year growth 2023-2028 (%)
          • 7.5 HMD - Market size and forecast 2023-2028
            • Chart on HMD - Market size and forecast 2023-2028 ($ million)
            • Data Table on HMD - Market size and forecast 2023-2028 ($ million)
            • Chart on HMD - Year-over-year growth 2023-2028 (%)
            • Data Table on HMD - Year-over-year growth 2023-2028 (%)
          • 7.6 Others - Market size and forecast 2023-2028
            • Chart on Others - Market size and forecast 2023-2028 ($ million)
            • Data Table on Others - Market size and forecast 2023-2028 ($ million)
            • Chart on Others - Year-over-year growth 2023-2028 (%)
            • Data Table on Others - Year-over-year growth 2023-2028 (%)
          • 7.7 Market opportunity by Product
            • Market opportunity by Product ($ million)
            • Data Table on Market opportunity by Product ($ million)

          8 Customer Landscape

          • 8.1 Customer landscape overview
            • Analysis of price sensitivity, lifecycle, customer purchase basket, adoption rates, and purchase criteria

          9 Geographic Landscape

          • 9.1 Geographic segmentation
            • Chart on Market share by geography 2023-2028 (%)
            • Data Table on Market share by geography 2023-2028 (%)
          • 9.2 Geographic comparison
            • Chart on Geographic comparison
            • Data Table on Geographic comparison
          • 9.3 APAC - Market size and forecast 2023-2028
            • Chart on APAC - Market size and forecast 2023-2028 ($ million)
            • Data Table on APAC - Market size and forecast 2023-2028 ($ million)
            • Chart on APAC - Year-over-year growth 2023-2028 (%)
            • Data Table on APAC - Year-over-year growth 2023-2028 (%)
          • 9.4 North America - Market size and forecast 2023-2028
            • Chart on North America - Market size and forecast 2023-2028 ($ million)
            • Data Table on North America - Market size and forecast 2023-2028 ($ million)
            • Chart on North America - Year-over-year growth 2023-2028 (%)
            • Data Table on North America - Year-over-year growth 2023-2028 (%)
          • 9.5 Europe - Market size and forecast 2023-2028
            • Chart on Europe - Market size and forecast 2023-2028 ($ million)
            • Data Table on Europe - Market size and forecast 2023-2028 ($ million)
            • Chart on Europe - Year-over-year growth 2023-2028 (%)
            • Data Table on Europe - Year-over-year growth 2023-2028 (%)
          • 9.6 Middle East and Africa - Market size and forecast 2023-2028
            • Chart on Middle East and Africa - Market size and forecast 2023-2028 ($ million)
            • Data Table on Middle East and Africa - Market size and forecast 2023-2028 ($ million)
            • Chart on Middle East and Africa - Year-over-year growth 2023-2028 (%)
            • Data Table on Middle East and Africa - Year-over-year growth 2023-2028 (%)
          • 9.7 South America - Market size and forecast 2023-2028
            • Chart on South America - Market size and forecast 2023-2028 ($ million)
            • Data Table on South America - Market size and forecast 2023-2028 ($ million)
            • Chart on South America - Year-over-year growth 2023-2028 (%)
            • Data Table on South America - Year-over-year growth 2023-2028 (%)
          • 9.8 US - Market size and forecast 2023-2028
            • Chart on US - Market size and forecast 2023-2028 ($ million)
            • Data Table on US - Market size and forecast 2023-2028 ($ million)
            • Chart on US - Year-over-year growth 2023-2028 (%)
            • Data Table on US - Year-over-year growth 2023-2028 (%)
          • 9.9 China - Market size and forecast 2023-2028
            • Chart on China - Market size and forecast 2023-2028 ($ million)
            • Data Table on China - Market size and forecast 2023-2028 ($ million)
            • Chart on China - Year-over-year growth 2023-2028 (%)
            • Data Table on China - Year-over-year growth 2023-2028 (%)
          • 9.10 South Korea - Market size and forecast 2023-2028
            • Chart on South Korea - Market size and forecast 2023-2028 ($ million)
            • Data Table on South Korea - Market size and forecast 2023-2028 ($ million)
            • Chart on South Korea - Year-over-year growth 2023-2028 (%)
            • Data Table on South Korea - Year-over-year growth 2023-2028 (%)
          • 9.11 Germany - Market size and forecast 2023-2028
            • Chart on Germany - Market size and forecast 2023-2028 ($ million)
            • Data Table on Germany - Market size and forecast 2023-2028 ($ million)
            • Chart on Germany - Year-over-year growth 2023-2028 (%)
            • Data Table on Germany - Year-over-year growth 2023-2028 (%)
          • 9.12 UK - Market size and forecast 2023-2028
            • Chart on UK - Market size and forecast 2023-2028 ($ million)
            • Data Table on UK - Market size and forecast 2023-2028 ($ million)
            • Chart on UK - Year-over-year growth 2023-2028 (%)
            • Data Table on UK - Year-over-year growth 2023-2028 (%)
          • 9.13 Market opportunity by geography
            • Market opportunity by geography ($ million)
            • Data Tables on Market opportunity by geography ($ million)

          10 Drivers, Challenges, and Opportunity/Restraints

          • 10.1 Market drivers
            • 10.2 Market challenges
              • 10.3 Impact of drivers and challenges
                • Impact of drivers and challenges in 2023 and 2028
              • 10.4 Market opportunities/restraints

                11 Competitive Landscape

                • 11.1 Overview
                  • 11.2 Competitive Landscape
                    • Overview on criticality of inputs and factors of differentiation
                  • 11.3 Landscape disruption
                    • Overview on factors of disruption
                  • 11.4 Industry risks
                    • Impact of key risks on business

                  12 Competitive Analysis

                  • 12.1 Companies profiled
                    • Companies covered
                  • 12.2 Market positioning of companies
                    • Matrix on companies position and classification
                  • 12.3 Alphabet Inc.
                    • Alphabet Inc. - Overview
                    • Alphabet Inc. - Business segments
                    • Alphabet Inc. - Key offerings
                    • Alphabet Inc. - Segment focus
                  • 12.4 AUO Corp.
                    • AUO Corp. - Overview
                    • AUO Corp. - Business segments
                    • AUO Corp. - Key news
                    • AUO Corp. - Key offerings
                    • AUO Corp. - Segment focus
                  • 12.5 Avalon Holographics Inc.
                    • Avalon Holographics Inc. - Overview
                    • Avalon Holographics Inc. - Product / Service
                    • Avalon Holographics Inc. - Key offerings
                  • 12.6 Avegant Corp.
                    • Avegant Corp. - Overview
                    • Avegant Corp. - Product / Service
                    • Avegant Corp. - Key offerings
                  • 12.7 Continental AG
                    • Continental AG - Overview
                    • Continental AG - Business segments
                    • Continental AG - Key news
                    • Continental AG - Key offerings
                    • Continental AG - Segment focus
                  • 12.8 CREAL SA
                    • CREAL SA - Overview
                    • CREAL SA - Product / Service
                    • CREAL SA - Key offerings
                  • 12.9 FoVI3D
                    • FoVI3D - Overview
                    • FoVI3D - Product / Service
                    • FoVI3D - Key offerings
                  • 12.10 Holografika Kft.
                    • Holografika Kft. - Overview
                    • Holografika Kft. - Product / Service
                    • Holografika Kft. - Key offerings
                  • 12.11 LG Electronics Inc.
                    • LG Electronics Inc. - Overview
                    • LG Electronics Inc. - Product / Service
                    • LG Electronics Inc. - Key news
                    • LG Electronics Inc. - Key offerings
                  • 12.12 Looking Glass Factory Inc.
                    • Looking Glass Factory Inc. - Overview
                    • Looking Glass Factory Inc. - Product / Service
                    • Looking Glass Factory Inc. - Key offerings
                  • 12.13 NVIDIA Corp.
                    • NVIDIA Corp. - Overview
                    • NVIDIA Corp. - Business segments
                    • NVIDIA Corp. - Key news
                    • NVIDIA Corp. - Key offerings
                    • NVIDIA Corp. - Segment focus
                  • 12.14 Panasonic Holdings Corp.
                    • Panasonic Holdings Corp. - Overview
                    • Panasonic Holdings Corp. - Business segments
                    • Panasonic Holdings Corp. - Key news
                    • Panasonic Holdings Corp. - Key offerings
                    • Panasonic Holdings Corp. - Segment focus
                  • 12.15 Robert Bosch GmbH
                    • Robert Bosch GmbH - Overview
                    • Robert Bosch GmbH - Product / Service
                    • Robert Bosch GmbH - Key news
                    • Robert Bosch GmbH - Key offerings
                  • 12.16 Sharp Corp.
                    • Sharp Corp. - Overview
                    • Sharp Corp. - Business segments
                    • Sharp Corp. - Key news
                    • Sharp Corp. - Key offerings
                    • Sharp Corp. - Segment focus
                  • 12.17 Toshiba Corp.
                    • Toshiba Corp. - Overview
                    • Toshiba Corp. - Business segments
                    • Toshiba Corp. - Key news
                    • Toshiba Corp. - Key offerings
                    • Toshiba Corp. - Segment focus

                  13 Appendix

                  • 13.1 Scope of the report
                    • 13.2 Inclusions and exclusions checklist
                      • Inclusions checklist
                      • Exclusions checklist
                    • 13.3 Currency conversion rates for US$
                      • Currency conversion rates for US$
                    • 13.4 Research methodology
                      • Research methodology
                    • 13.5 Data procurement
                      • Information sources
                    • 13.6 Data validation
                      • Data validation
                    • 13.7 Validation techniques employed for market sizing
                      • Validation techniques employed for market sizing
                    • 13.8 Data synthesis
                      • Data synthesis
                    • 13.9 360 degree market analysis
                      • 360 degree market analysis
                    • 13.10 List of abbreviations
                      • List of abbreviations

                    Research Methodology

                    Technavio presents a detailed picture of the market by way of study, synthesis, and summation of data from multiple sources. The analysts have presented the various facets of the market with a particular focus on identifying the key industry influencers. The data thus presented is comprehensive, reliable, and the result of extensive research, both primary and secondary.

                    INFORMATION SOURCES

                    Primary sources

                    • Manufacturers and suppliers
                    • Channel partners
                    • Industry experts
                    • Strategic decision makers

                    Secondary sources

                    • Industry journals and periodicals
                    • Government data
                    • Financial reports of key industry players
                    • Historical data
                    • Press releases

                    DATA ANALYSIS

                    Data Synthesis

                    • Collation of data
                    • Estimation of key figures
                    • Analysis of derived insights

                    Data Validation

                    • Triangulation with data models
                    • Reference against proprietary databases
                    • Corroboration with industry experts

                    REPORT WRITING

                    Qualitative

                    • Market drivers
                    • Market challenges
                    • Market trends
                    • Five forces analysis

                    Quantitative

                    • Market size and forecast
                    • Market segmentation
                    • Geographical insights
                    • Competitive landscape

                    Interested in this report?

                    Get your sample now to see our research methodology and insights!

                    Download Now

                    Frequently Asked Questions

                    Next Generation 3D Display market growth will increase by $ 1053 mn during 2024-2028.

                    The Next Generation 3D Display market is expected to grow at a CAGR of 18.52% during 2024-2028.

                    Next Generation 3D Display market is segmented by Component( Consumer electronics, Automotive, Healthcare, Others) Product( Stereoscopic display, Volumetric display, HMD, Others, South America)

                    Alphabet Inc., AUO Corp., Avalon Holographics Inc., Avegant Corp., Continental AG, CREAL SA, Dimenco BV, FoVI3D, Holografika Kft., LG Electronics Inc., Looking Glass Factory Inc., NVIDIA Corp., Ostendo Technologies Inc., Panasonic Holdings Corp., Robert Bosch GmbH, Samsung Electronics Co. Ltd., SeeReal Technologies SA, Sharp Corp., Toshiba Corp., VividQ Ltd. are a few of the key vendors in the Next Generation 3D Display market.

                    North America will register the highest growth rate of 37% among the other regions. Therefore, the Next Generation 3D Display market in North America is expected to garner significant business opportunities for the vendors during the forecast period.

                    US, China, South Korea, Germany, UK

                    • Increasing advent of VR in gamingOne of the major drivers of the global next generation 3D display market is the increasing implementation of VR technology by means of VR headsets and other VR devices is the driving factor this market.
                    • such as VR glasses and in-home 3D gaming consoles. For instance is the driving factor this market.
                    • Facebook Technologies is the driving factor this market.
                    • LLC. is increasingly emphasizing the production of VR HMD Oculus Rift and Oculus Go. These headsets completely work in tandem with various gaming consoles is the driving factor this market.
                    • such as Sony PlayStation VR. They track the head movement of the gamer to provide 3D imagery on its stereo screens. Furthermore is the driving factor this market.
                    • products such as Oculus Touch controllers conform to the gamer's hand is the driving factor this market.
                    • enabling finger recognition and gesture-controlled gaming is the driving factor this market.
                    • thereby enhancing the gaming experience. The popularity of VR gaming consoles is increasing in various developed economies such as the US is the driving factor this market.
                    • the UK is the driving factor this market.
                    • China is the driving factor this market.
                    • and Japan. As a result is the driving factor this market.
                    • companies such as Sony Corporation and Oculus have started offering VR gaming consoles to end-users. For instance is the driving factor this market.
                    • in September 2018 is the driving factor this market.
                    • Oculus launched its Oculus Quest gaming console is the driving factor this market.
                    • that is is the driving factor this market.
                    • a direct competitor of Nintendo Switch. The all-in-one VR gaming system Oculus Quest is designed using Oculus Insight. Oculus Quest uses four ultra-wide-angle sensors and computer vision algorithms to track the gamers' exact positions in real time without any external sensors. These technological innovations in VR gaming are expected to drive the growth of the global next generation 3D display market during the forecast period. is the driving factor this market.

                    The Next Generation 3D Display market vendors should focus on grabbing business opportunities from the Consumer electronics segment as it accounted for the largest market share in the base year.