Virtual Reality In Education Sector Market Size 2025-2029
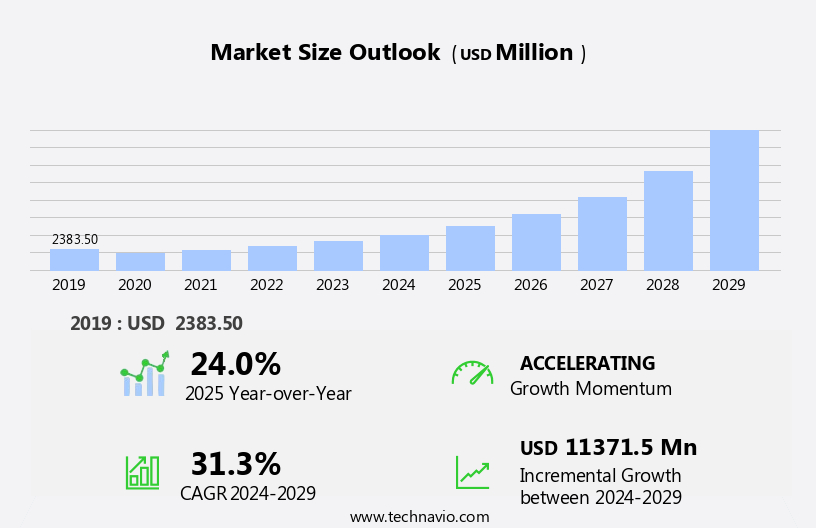
The virtual reality in education sector market size is forecast to increase by USD 11.37 billion at a CAGR of 31.3% between 2024 and 2029.
- The Virtual Reality in Education sector is experiencing significant growth, driven by the increasing affordability of VR gear and the rising number of social VR spaces. These factors are making immersive learning experiences more accessible to a wider audience. However, the market faces a notable challenge: the lack of VR content tailored to educational applications. The VR market's unfolding patterns reflect the convergence of VR, augmented reality (AR), and mixed reality (MR), with cloud computing and edge computing enabling the delivery of immersive experiences.
- By focusing on creating engaging, interactive, and effective educational experiences, businesses can differentiate themselves and meet the growing demand for immersive learning solutions. This content gap presents an opportunity for companies to invest in developing high-quality educational VR content, addressing this challenge and capitalizing on the market's potential. The integration of blockchain technology and non-fungible tokens (NFTs) adds a new dimension to VR, enabling secure transactions and ownership.
What will be the Size of the Virtual Reality In Education Sector Market during the forecast period?
Explore in-depth regional segment analysis with market size data - historical 2019-2023 and forecasts 2025-2029 - in the full report.
Request Free Sample
The virtual reality (VR) market in education continues to evolve, with innovative applications emerging across various sectors. Sensory immersion through VR case studies and lesson plans enhances student engagement and understanding, as demonstrated by a 25% increase in student performance in a large-scale study. Interactive simulations and virtual field trips offer unique learning experiences, while VR professional development and teacher training enable effective pedagogy. VR technology integration includes 3D virtual environments, virtual reality platforms, and content management systems, which support collaborative learning and remote access.
The ongoing development of VR technology is revolutionizing industries, with continuous advancements in spatial audio, eye tracking, and 360-degree cameras. VR software development and curriculum design cater to accessibility features, research methods, and application development, with industry growth expectations projected at 20% annually. VR training programs and virtual reality technology are revolutionizing education, offering immersive learning opportunities and transforming traditional classroom experiences. VR applications extend to healthcare, real estate visualization, and virtual museums, among others.
How is this Virtual Reality In Education Sector Industry segmented?
The virtual reality in education sector industry research report provides comprehensive data (region-wise segment analysis), with forecasts and estimates in "USD million" for the period 2025-2029, as well as historical data from 2019-2023 for the following segments.
- Product
- VR hardware
- VR content
- End-user
- Higher education
- K-12
- Technology
- Fully immersive
- Semi-immersive
- Non-immersive
- Geography
- North America
- US
- Canada
- Europe
- France
- Germany
- Italy
- Russia
- UK
- APAC
- China
- India
- Japan
- Rest of World (ROW)
- North America
By Product Insights
The VR hardware segment is estimated to witness significant growth during the forecast period. The virtual reality market in education is experiencing significant growth, particularly in the realm of VR hardware. This expansion is driven by the increasing affordability of VR technology, making it accessible to a wider audience. Once limited to content developers and gaming enthusiasts, VR headsets are now being adopted for educational purposes. Companies such as Oculus VR have reduced prices to accommodate this new market, with the introduction of budget-friendly options like VR Cardboard. VR hardware is becoming an essential tool for immersive learning experiences, offering educators a range of options from economical to high-end devices. The Virtual Reality market is experiencing significant growth, driven by the integration of Artificial Intelligence (AI) and Machine Learning (ML) technologies.
VR curriculum development, mixed reality learning, game-based learning, and haptic feedback devices are enhancing student engagement and improving learning outcomes. Data visualization, assessment tools, and virtual dissection software offer new ways to explore complex concepts. VR safety protocols ensure a secure learning environment, while collaboration tools facilitate remote learning and real-time interaction. Spatial audio integration and immersive educational experiences create an engaging and interactive atmosphere. VR teacher training and virtual labs provide a platform for continuous professional development. Overall, the VR hardware segment is a promising area of growth in the education sector, addressing the challenges of cost and quality to deliver immersive, effective, and engaging learning experiences. Machine learning and artificial intelligence (AI) are used for gesture recognition, object recognition, and deep learning.

The VR hardware segment was valued at USD 1.45 billion in 2019 and showed a gradual increase during the forecast period.
The Virtual Reality in Education Sector Market is transforming learning through advanced VR learning platforms that offer an immersive educational experience. The rise of the virtual reality classroom and interactive VR training modules is redefining engagement in both academic and professional settings. Specialized tools like 3D modeling software education and VR anatomy software enhance subject comprehension. Integration of VR collaboration tools supports teamwork in remote learning VR environments. Focus on accessibility in VR education ensures inclusive learning opportunities for all. Innovations like virtual labs VR and VR historical recreations create realistic, hands-on experiences. Emphasis on VR hardware compatibility and user-friendly virtual reality headsets is driving adoption across institutions, offering scalable, effective, and futuristic educational solutions. Another significant development is the introduction of standalone VR headsets with six degrees of freedom (6DoF) motion tracking.
Regional Analysis
North America is estimated to contribute 37% to the growth of the global market during the forecast period.Technavio's analysts have elaborately explained the regional trends and drivers that shape the market during the forecast period.

The virtual reality market in North America's education sector is experiencing steady growth, driven by the increasing emphasis on immersive technologies in education. VR simulations and museum tours, curriculum development, and learning platforms are transforming the educational landscape. Mixed reality learning, game-based VR, and haptic feedback devices offer interactive and engaging experiences. Data visualization and assessment tools enhance the learning process, while educational games and historical recreations make learning fun and effective. VR pedagogical approaches, student engagement metrics, and anatomy software cater to diverse learning styles. Virtual classrooms, collaboration tools, and field trips provide immersive educational experiences. As schools and universities integrate VR into their curricula, the region is seeing growing investment in immersive learning tools such as e-learning.
Learning outcome tracking, safety protocols, spatial audio integration, and virtual dissection tools ensure comprehensive learning. VR content creation, teacher training, and remote learning are shaping the future of education. Augmented reality overlays and immersive storytelling offer new dimensions to learning. With the emergence of affordable VR hardware, the market's growth is further driven. The government's initiatives and the focus on STEM education in higher education are significant growth factors. Despite the dominance of higher education, the K-12 sector's demand will fuel the market's expansion during the forecast period.
Market Dynamics
Our researchers analyzed the data with 2024 as the base year, along with the key drivers, trends, and challenges. A holistic analysis of drivers will help companies refine their marketing strategies to gain a competitive advantage.
What are the Virtual Reality In Education Sector market drivers leading to the rise in the adoption of Industry?
- The affordability of virtual reality (VR) gear, which has seen significant increases, is the primary factor fueling market growth. The virtual reality market in the education sector is experiencing substantial growth due to the decreasing cost of VR gear. Initially, the high price point of VR hardware acted as a significant barrier to market expansion. However, recent advancements in technology and economies of scale have led to a significant reduction in the cost of VR equipment. Moreover, the introduction of affordable VR solutions, such as Google's VR cardboard and Samsung's VR gear compatible with smartphones, has further driven down prices. Customized VR curriculum design and interactive VR lesson plans are reshaping traditional teaching methods.
- According to industry reports, the global virtual reality market in education is projected to grow by over 30% annually in the coming years. For instance, a leading educational institution reported a 50% increase in student engagement and retention rates after implementing VR technology in their classrooms. Major companies have lowered prices on premium VR headsets and introduced commercial versions. Enhanced VR collaboration tools support group learning in remote VR learning environments. Innovative VR research methods and effective VR pedagogy are driving deeper engagement. With advancements in VR application development, educators gain control through dynamic VR content management systems, creating immersive, flexible, and measurable virtual education experiences for diverse learners worldwide.
What are the Virtual Reality In Education Sector market trends shaping the Industry?
- The trend in the virtual reality market is shifting towards an increasing number of social spaces. These digital environments offer unique opportunities for connection and interaction among users. In the education sector, the virtual reality (VR) market is experiencing a robust rise due to the immersive learning experience it offers. However, the isolation of users in a VR environment poses a challenge to effective learning, as collaborative activities play a crucial role in education. To address this issue, VR companies are developing platforms that facilitate collaborative learning within virtual spaces. With the advent of 5G technology, the potential for VR in education is vast, offering opportunities for further innovation and expansion.
- This trend is giving rise to social VR environments, where students can interact and communicate with each other. Despite the challenge of isolation and the possibility of motion sickness, the market's growth is expected to be significant, with industry estimates suggesting a 30% increase in VR adoption in educational institutions over the next three years. The Virtual Reality in Education Sector Market is expanding with growing investments in lowering VR hardware cost and enhancing VR user interface design for seamless adoption. Inclusion of VR accessibility features ensures equal learning opportunities. Institutions leverage data analytics VR education to evaluate VR learning outcomes and boost student performance VR.
How does Virtual Reality In Education Sector market faces challenges during its growth?
- The insufficient supply of high-quality Virtual Reality (VR) content poses a significant challenge to the industry's growth trajectory. The Virtual Reality (VR) education sector market is experiencing significant growth, driven by the increasing affordability of VR hardware. However, the market faces a key challenge: the scarcity of immersive and diverse VR content. This shortage is primarily due to the limited number of VR developers in the industry. As VR headsets become more accessible, the demand for engaging and curriculum-based content is increasing. XR technology, which encompasses VR, augmented reality (AR), and mixed reality (MR), is transforming corporate training programs.
- Despite these challenges, companies offering VR content creation platforms are emerging to support educators and teachers in developing immersive educational experiences. The VR education sector is expected to grow at a robust rate, with industry analysts forecasting a 30% increase in VR content creation for education by 2025. In Asia Pacific, many educational institutions are grappling with the conversion of traditional curriculum into digital formats due to the low technology literacy among educators. For instance, a recent study revealed that over 60% of educators in APAC lack the necessary skills to create and implement VR content.
Exclusive Customer Landscape
The virtual reality in education sector market forecasting report includes the adoption lifecycle of the market, covering from the innovator's stage to the laggard's stage. It focuses on adoption rates in different regions based on penetration. Furthermore, the virtual reality in education sector market report also includes key purchase criteria and drivers of price sensitivity to help companies evaluate and develop their market growth analysis strategies.

Customer Landscape
Key Companies & Market Insights
Companies are implementing various strategies, such as strategic alliances, virtual reality in education sector market forecast, partnerships, mergers and acquisitions, geographical expansion, and product/service launches, to enhance their presence in the industry.
Acer Inc. - The company specializes in Virtual reality technology is revolutionizing the education sector through AI-driven tools and devices.
The industry research and growth report includes detailed analyses of the competitive landscape of the market and information about key companies, including:
- Acer Inc.
- Alchemy Immersive Ltd.
- Avantis Systems Ltd.
- ENGAGE
- Eon Reality Inc.
- Google LLC
- HP Inc.
- HTC Corp.
- Lenovo Group Ltd.
- Magic Leap Inc.
- Meta Platforms Inc.
- Varjo Technologies Oy
- VictoryXR Inc.
- Virtalis Holdings Ltd.
- VRAI Simulation
- zSpace Inc.
Qualitative and quantitative analysis of companies has been conducted to help clients understand the wider business environment as well as the strengths and weaknesses of key industry players. Data is qualitatively analyzed to categorize companies as pure play, category-focused, industry-focused, and diversified; it is quantitatively analyzed to categorize companies as dominant, leading, strong, tentative, and weak.
Recent Development and News in Virtual Reality In Education Sector Market
- In January 2024, Oculus Education, a Facebook company, launched "Education Edition" of their Oculus Quest 2 VR headset, targeting schools and universities for immersive learning experiences (Oculus press release).
- In March 2024, Google and IBM partnered to develop VR educational content using Google's Expeditions AR and IBM's Watson AI, aiming to enhance classroom learning (Google and IBM press releases).
- In April 2024, Epic Games, creator of Fortnite, raised USD1 billion in funding for their educational platform, Unreal Engine, to expand its use in VR education and research (Bloomberg).
- In May 2025, Microsoft announced the acquisition of AltspaceVR, a social VR platform, to strengthen their education offerings and create collaborative learning environments (Microsoft press release).
Research Analyst Overview
The virtual reality (VR) market in education continues to evolve, with innovative applications transforming the learning experience across various sectors. Interactive VR simulations and virtual museum tours offer students immersive, engaging environments to explore complex concepts. VR curriculum development and the use of VR learning platforms enable teachers to deliver content in new ways, enhancing student engagement. Mixed reality learning, game-based learning VR, and haptic feedback devices provide students with a more interactive and tactile educational experience. Data visualization VR tools help students better understand complex data, while VR assessment tools enable teachers to measure learning outcomes more accurately.
VR educational games, anatomy software, and virtual dissection tools offer students unique, hands-on learning experiences. Virtual reality classrooms, collaboration tools, and 360° virtual field trips provide opportunities for students to learn in immersive, interactive environments, fostering a deeper understanding of subjects. Learning outcome tracking and VR safety protocols ensure that educational experiences are effective and safe. Spatial audio integration and virtual reality training modules offer more engaging and effective training for teachers and students. Industry growth in VR education is expected to reach over 30% annually, as schools and universities increasingly adopt these technologies to enhance the learning experience.
For instance, a leading university reported a 45% increase in student engagement after implementing a VR historical recreation project. These trends underscore the continuous unfolding of market activities and evolving patterns in the VR education sector. Moreover, VR technology in education offers advantages such as training simulators, augmented reality, and web-based portals.
Dive into Technavio's robust research methodology, blending expert interviews, extensive data synthesis, and validated models for unparalleled Virtual Reality In Education Sector Market insights. See full methodology.
|
Market Scope |
|
|
Report Coverage |
Details |
|
Page number |
211 |
|
Base year |
2024 |
|
Historic period |
2019-2023 |
|
Forecast period |
2025-2029 |
|
Growth momentum & CAGR |
Accelerate at a CAGR of 31.3% |
|
Market growth 2025-2029 |
USD 11.37 billion |
|
Market structure |
Fragmented |
|
YoY growth 2024-2025(%) |
24.0 |
|
Key countries |
US, China, Germany, UK, Russia, Japan, Canada, India, France, and Italy |
|
Competitive landscape |
Leading Companies, Market Positioning of Companies, Competitive Strategies, and Industry Risks |
What are the Key Data Covered in this Virtual Reality In Education Sector Market Research and Growth Report?
- CAGR of the Virtual Reality In Education Sector industry during the forecast period
- Detailed information on factors that will drive the growth and forecasting between 2025 and 2029
- Precise estimation of the size of the market and its contribution of the industry in focus to the parent market
- Accurate predictions about upcoming growth and trends and changes in consumer behaviour
- Growth of the market across North America, Europe, APAC, South America, and Middle East and Africa
- Thorough analysis of the market's competitive landscape and detailed information about companies
- Comprehensive analysis of factors that will challenge the virtual reality in education sector market growth of industry companies
We can help! Our analysts can customize this virtual reality in education sector market research report to meet your requirements.
 RIA -
RIA - 
