
Digitaling Spending Market Size 2026-2030
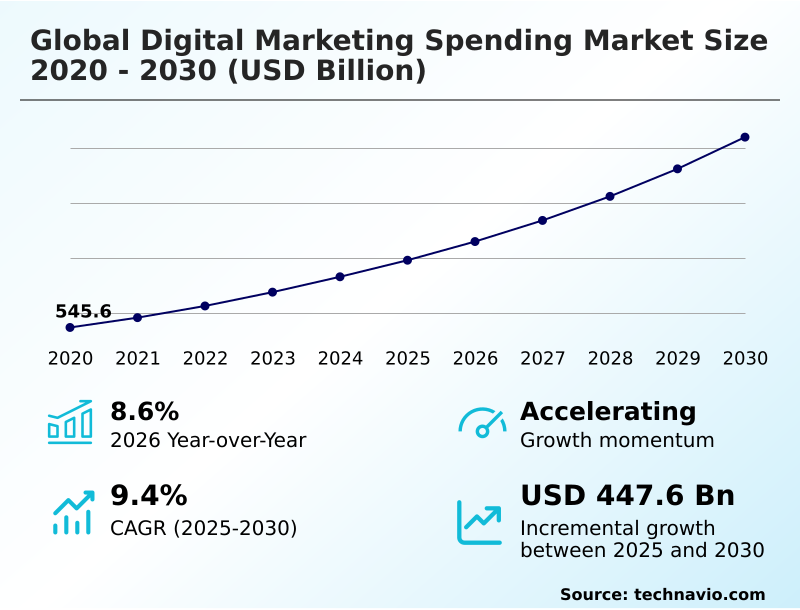
The digitaling spending market size is valued to increase by USD 447.6 billion, at a CAGR of 9.4% from 2025 to 2030. Integration of AI into digital advertising ecosystems will drive the digitaling spending market.
Major Market Trends & Insights
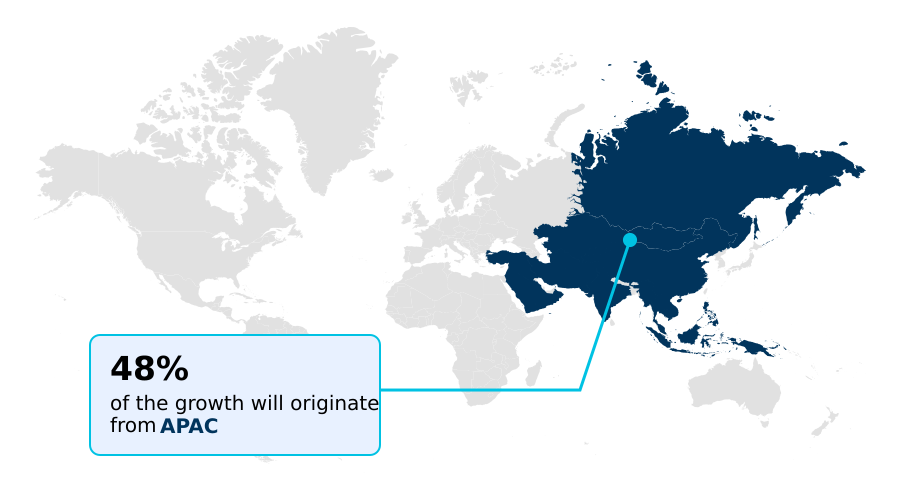
- APAC dominated the market and accounted for a 48.3% growth during the forecast period.
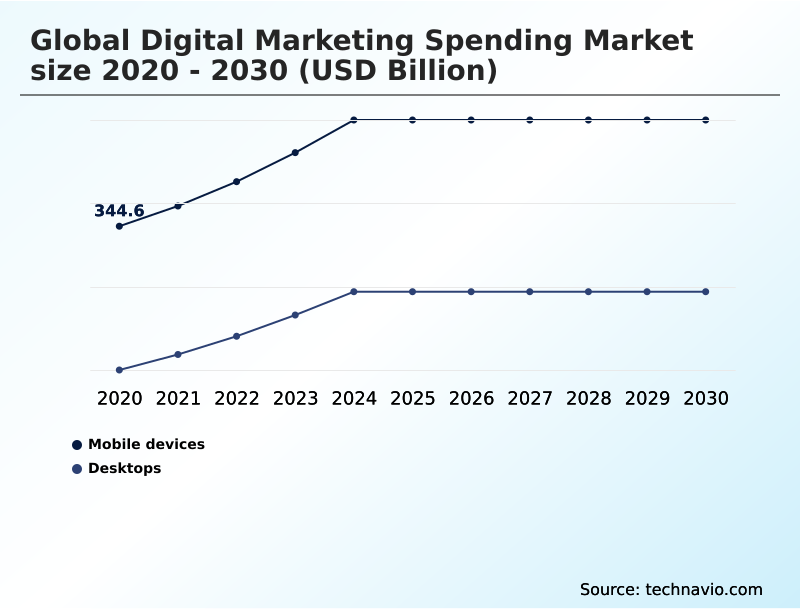
- By Application - Mobile devices segment was valued at USD 450.7 billion in 2024
- By Type - Search ads segment accounted for the largest market revenue share in 2024
Market Size & Forecast
- Market Opportunities: USD 692.1 billion
- Market Future Opportunities: USD 447.6 billion
- CAGR from 2025 to 2030 : 9.4%
Market Summary
- The digital marketing spending market is defined by a dynamic interplay of technological innovation and shifting consumer behaviors. The adoption of AI-powered marketing tools is central to this evolution, enabling sophisticated programmatic advertising and generative AI tools that automate creative production and optimize bidding.
- As the industry navigates a post-cookie landscape, the focus intensifies on privacy-first advertising, with organizations investing in customer data platforms and contextual targeting to maintain relevance. Key growth areas include retail media networks, which offer closed-loop attribution modeling, and social commerce platforms that integrate user-generated content with direct purchase paths.
- The dominance of short-form video content and connected television advertising continues to reshape media budgets. For instance, a consumer goods firm can leverage first-party data from a retail partner’s platform to refine its omnichannel approaches, aligning digital campaigns with in-store inventory levels to maximize performance marketing outcomes.
- However, persistent challenges in cross-platform measurement require businesses to adopt more advanced analytics to justify investments in search engine marketing (SEM) and other key channels, ensuring strategic alignment and verifiable returns in a competitive environment.
What will be the Size of the Digitaling Spending Market during the forecast period?
Get Key Insights on Market Forecast (PDF) Get Free Sample
How is the Digitaling Spending Market Segmented?
The digitaling spending industry research report provides comprehensive data (region-wise segment analysis), with forecasts and estimates in "USD billion" for the period 2026-2030, as well as historical data from 2020-2024 for the following segments.
- Application
- Mobile devices
- Desktops
- Type
- Search ads
- Display ads
- Social media
- E-mail marketing
- Others
- Pricing scheme
- Cost-per-click
- Cost-per-mille
- Cost-per-action
- Others
- Geography
- APAC
- China
- Japan
- India
- North America
- US
- Canada
- Mexico
- Europe
- Germany
- UK
- France
- South America
- Brazil
- Colombia
- Argentina
- Middle East and Africa
- Saudi Arabia
- UAE
- South Africa
- Rest of World (ROW)
- APAC
By Application Insights
The mobile devices segment is estimated to witness significant growth during the forecast period.
The mobile devices segment dominates digital marketing expenditure, driven by high smartphone penetration and the consumer shift to portable connectivity. Companies are prioritizing mobile-first campaigns, leveraging short-form video content and vertical video formats on social commerce platforms.
The integration of AI-powered marketing tools for real-time consumer data analysis has become standard, with some organizations reporting a 25% improvement in campaign engagement through automated refined audience segmentation.
The move away from traditional tracking necessitates a robust first-party data ecosystem and ID-less solutions.
Marketers are increasingly focused on in-app advertisements, shoppable posts, and comprehensive customer journey mapping to navigate the evolving landscape and optimize spend within this critical channel, including through programmatic advertising.
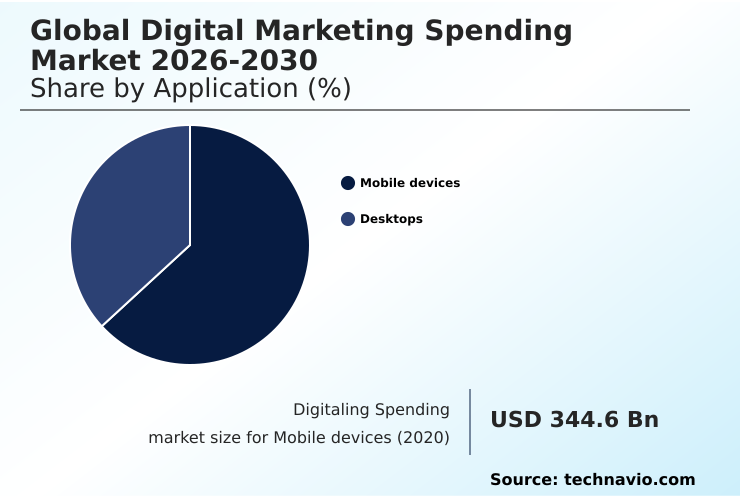
The Mobile devices segment was valued at USD 450.7 billion in 2024 and showed a gradual increase during the forecast period.
Regional Analysis
APAC is estimated to contribute 48.3% to the growth of the global market during the forecast period.Technavio’s analysts have elaborately explained the regional trends and drivers that shape the market during the forecast period.
See How Digitaling Spending Market Demand is Rising in APAC Get Free Sample
The geographic landscape of digital marketing spending is marked by varied regional dynamics. APAC leads in momentum, with growth rates exceeding 5%, driven by mobile-first adoption and burgeoning influencer marketing ecosystems.
North America remains the largest market, characterized by advanced programmatic buying technologies and heavy investment in search engine marketing (SEM) and connected television advertising. In Europe, regulatory pressures drive investment in brand safety solutions and privacy-compliant customer experience automation.
Meanwhile, digitalization in regions like South America is evident, where digital channels now constitute over 56% of total advertising expenditure.
Across all regions, businesses are leveraging demand-side platforms (DSPs) and supply-side platforms (SSPs) with new audience engagement strategies to lower customer acquisition cost (CAC) and enhance digital shelf analytics.
Market Dynamics
Our researchers analyzed the data with 2025 as the base year, along with the key drivers, trends, and challenges. A holistic analysis of drivers will help companies refine their marketing strategies to gain a competitive advantage.
- Strategically measuring digital marketing spending effectiveness has become a critical boardroom concern. The impact of AI on advertising is profound, particularly with the rise of generative AI for ad creative, which promises to streamline content production.
- Organizations are reassessing their media mix, considering the significant retail media network advertising benefits that offer closed-loop reporting and the strong social commerce platform spending trends that merge discovery with transaction. This requires a robust privacy-first advertising strategy implementation and a sophisticated first-party data strategy for marketing.
- Marketers are intensely focused on navigating the post-cookie advertising world, leading to a renewed debate on contextual targeting vs behavioral targeting. Simultaneously, content strategies are shifting. The high engagement from short-form video content marketing ROI and the authenticity of leveraging user-generated content for marketing are undeniable.
- This has also elevated the importance of creator-led influencer marketing campaign measurement and the use of podcast advertising for brand awareness. To ensure budget integrity, advanced digital ad fraud prevention techniques are essential. While there are persistent cross-channel marketing attribution challenges, firms using advanced modeling see nearly double the accuracy in performance reporting compared to those relying on last-click methods.
- Optimizing spend involves mastering programmatic advertising for mobile devices, optimizing cost-per-click in SEM, and achieving connected TV advertising campaign success. Furthermore, understanding advanced data clean room use cases and refining b2b digital marketing spending allocation are key to delivering a seamless omnichannel customer experience in retail and beyond.
What are the key market drivers leading to the rise in the adoption of Digitaling Spending Industry?
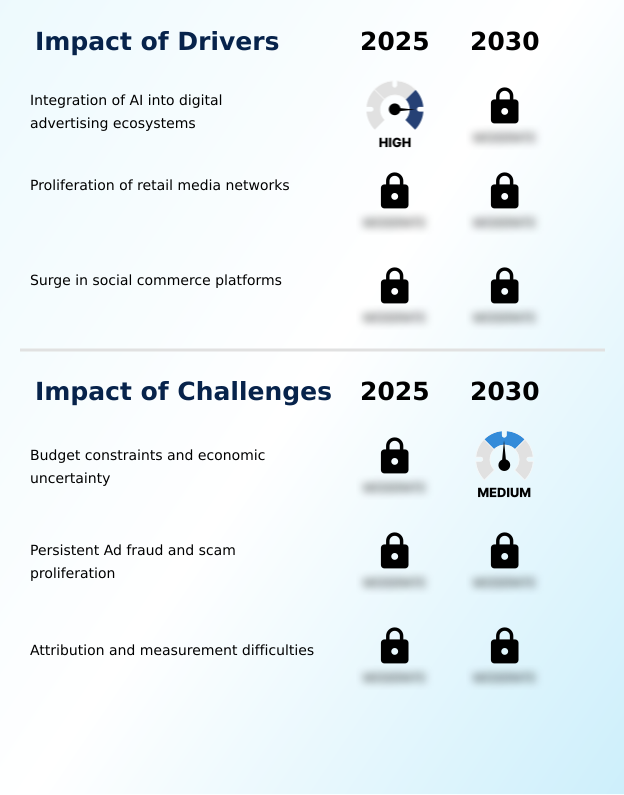
- The integration of AI into digital advertising ecosystems is a primary driver of market growth, enabling advanced automation, personalization, and campaign optimization.
- Key market drivers include the proliferation of retail media networks and social commerce platforms, which provide access to high-intent audiences and enable closed-loop attribution models.
- The integration of generative AI tools and AI-powered marketing tools is revolutionizing digital campaign management and enabling hyper-personalized content delivery through real-time consumer data analysis.
- Use of AI-driven bidding strategies in automated bidding processes has demonstrated ad spend efficiency improvements of up to 18%.
- Furthermore, businesses adopting mature omnichannel approaches supported by customer data platforms and effective cross-channel orchestration achieve a customer lifetime value that is 2.5 times higher than their less-integrated counterparts, justifying increased technology investment in native advertising formats.
What are the market trends shaping the Digitaling Spending Industry?
- The rise of privacy-first advertising approaches represents a significant market trend. This shift is reshaping strategies as companies adapt to evolving data protection regulations and consumer expectations.
- Market trends are defined by the pivot to privacy-first advertising in a post-cookie landscape. This involves adopting cookieless tracking solutions, ID-less solutions, and data clean rooms to ensure consumer data protection. Platforms prioritizing transparent consent mechanisms see user opt-in rates 20% higher than industry averages.
- Concurrently, the dominance of short-form video content and creator-led campaigns reshapes engagement, with vertical video formats becoming standard. The integration of shoppable video features boosts performance, with some studies showing an increase in conversion intent by over 35%.
- This environment pushes investment toward contextual targeting and supports ecosystems with advanced creator monetization tools, aligning spending with modern consumption habits and regulatory demands. The trend also benefits influencer partnership programs.
What challenges does the Digitaling Spending Industry face during its growth?
- Budget constraints and economic uncertainty present a key challenge affecting industry growth, forcing marketers to justify spending with rigorous performance metrics.
- The market faces significant challenges, primarily in cross-platform measurement and attribution modeling. Firms relying on outdated last-touch models misattribute over 40% of their conversions, obscuring true return on ad spend (ROAS).
- Persistent ad fraud necessitates robust invalid traffic detection and ad fraud detection tools, as fraudulent activity can inflate customer acquisition cost (CAC) by as much as 20% in unprotected campaigns. This environment drives demand for better brand safety solutions and improved ad viewability metrics.
- To counter these issues, organizations are shifting toward media mix modeling, probabilistic modeling, and performance-based pricing models to bring clarity to their performance marketing efforts and create a more accurate customer journey mapping, leveraging viral marketing trends.
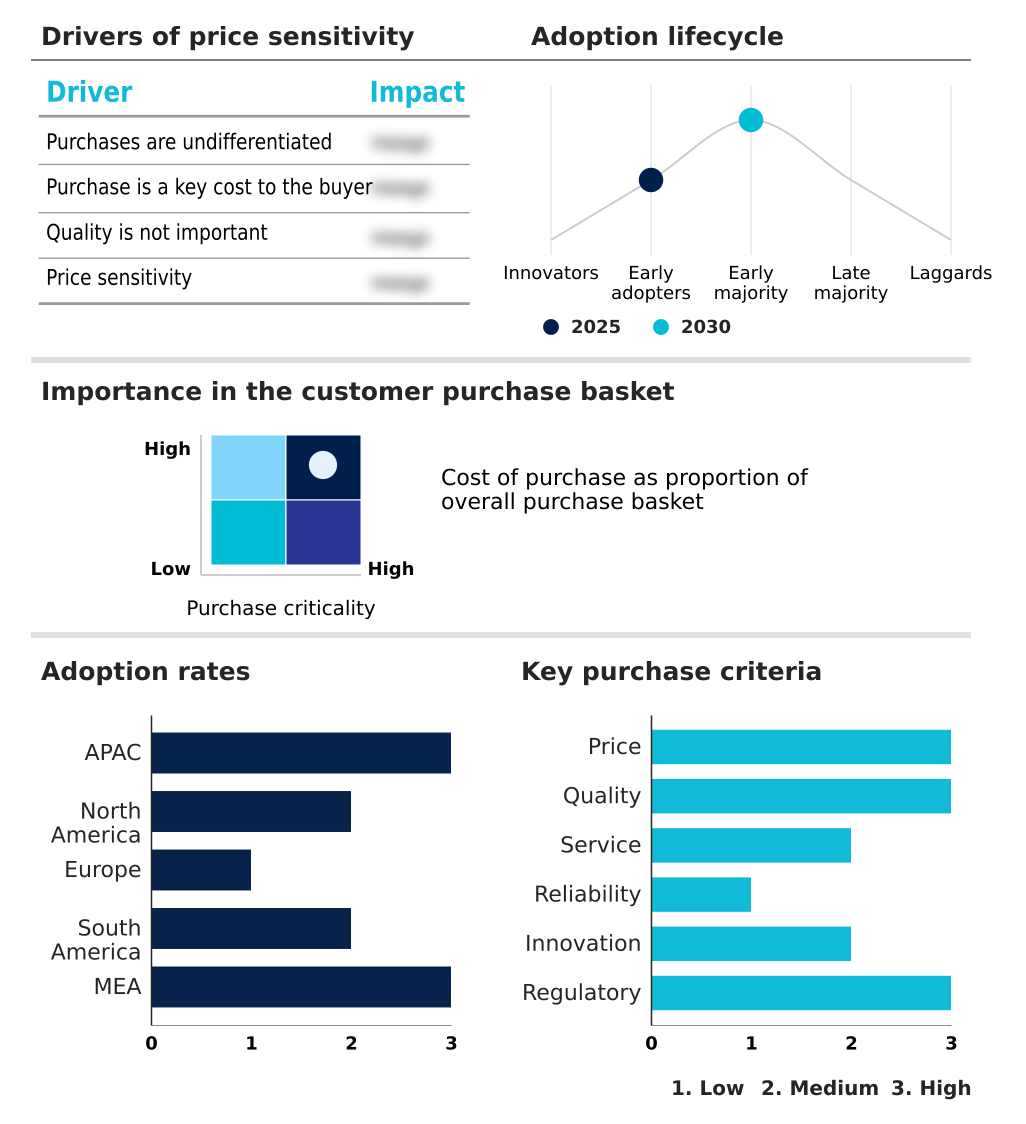
Exclusive Technavio Analysis on Customer Landscape
The digitaling spending market forecasting report includes the adoption lifecycle of the market, covering from the innovator’s stage to the laggard’s stage. It focuses on adoption rates in different regions based on penetration. Furthermore, the digitaling spending market report also includes key purchase criteria and drivers of price sensitivity to help companies evaluate and develop their market growth analysis strategies.
Customer Landscape of Digitaling Spending Industry
Competitive Landscape
Companies are implementing various strategies, such as strategic alliances, digitaling spending market forecast, partnerships, mergers and acquisitions, geographical expansion, and product/service launches, to enhance their presence in the industry.
Accenture Plc - Offers data-driven consulting focused on optimizing digital marketing expenditure through advanced analytics, enhancing campaign performance and strategic outcomes for enterprises.
The industry research and growth report includes detailed analyses of the competitive landscape of the market and information about key companies, including:
- Accenture Plc
- Acquia Inc.
- Act On Software Inc.
- ActiveCampaign LLC
- Adobe Inc.
- Alibaba Group Holding Ltd.
- Amazon.com Inc.
- ByteDance Ltd.
- Dentsu Group Inc.
- Disruptive Advertising Inc.
- Google LLC
- HubSpot Inc.
- IBM Corp.
- Intuit Inc.
- Meta Platforms Inc.
- Microsoft Corp.
- Oracle Corp.
- Salesforce Inc.
- SAP SE
Qualitative and quantitative analysis of companies has been conducted to help clients understand the wider business environment as well as the strengths and weaknesses of key industry players. Data is qualitatively analyzed to categorize companies as pure play, category-focused, industry-focused, and diversified; it is quantitatively analyzed to categorize companies as dominant, leading, strong, tentative, and weak.
Recent Development and News in Digitaling spending market
- In November, 2025, Meta projected that approximately 10% of its 2024 revenue would be derived from advertising for scams and banned goods, highlighting significant ecosystem vulnerabilities, as reported by Reuters.
- In October, 2025, Meta announced strong Q3 advertising results, attributing the performance to advancements in its AI tools that enhanced ad delivery and impression volume across its platforms.
- In October, 2025, Alphabet reported Q3 results emphasizing the continued strength of its Search and YouTube platforms, largely driven by innovative AI integrations that captured significant marketer spending.
- In April, 2025, the Interactive Advertising Bureau released its full-year 2024 report, indicating sustained momentum in digital ad spending across key formats including video, search, and social media.
Dive into Technavio’s robust research methodology, blending expert interviews, extensive data synthesis, and validated models for unparalleled Digitaling Spending Market insights. See full methodology.
| Market Scope | |
|---|---|
| Page number | 312 |
| Base year | 2025 |
| Historic period | 2020-2024 |
| Forecast period | 2026-2030 |
| Growth momentum & CAGR | Accelerate at a CAGR of 9.4% |
| Market growth 2026-2030 | USD 447.6 billion |
| Market structure | Fragmented |
| YoY growth 2025-2026(%) | 8.6% |
| Key countries | China, Japan, India, South Korea, Australia, Indonesia, US, Canada, Mexico, Germany, UK, France, Italy, The Netherlands, Spain, Brazil, Colombia, Argentina, Saudi Arabia, UAE, South Africa, Israel and Turkey |
| Competitive landscape | Leading Companies, Market Positioning of Companies, Competitive Strategies, and Industry Risks |
Research Analyst Overview
- The digital marketing spending market is rapidly advancing beyond simple performance marketing, driven by the convergence of AI and data-centric strategies. The widespread adoption of generative AI tools and AI-powered marketing tools is transforming both creative development and tactical execution.
- A core trend is the shift to privacy-first advertising, compelling investment in a first-party data ecosystem, data clean rooms, and ID-less solutions to navigate the post-cookie landscape. This pivot favors contextual targeting and sophisticated attribution modeling. Key growth channels include retail media networks, social commerce platforms, and connected television advertising, where programmatic buying technologies and AI-driven bidding strategies are crucial.
- The dominance of short-form video content, creator-led campaigns, and in-app advertisements requires new approaches to engagement, such as shoppable posts and user-generated content. Firms leveraging integrated marketing automation technologies and customer data platforms have reported reducing campaign launch cycles by over 30%.
- Ultimately, success depends on unified omnichannel approaches supported by robust cross-platform measurement, incrementality testing, and effective media mix modeling to counter threats like invalid traffic detection and ensure brand safety solutions. Search engine marketing (SEM), shopper marketing, and podcast advertising remain vital components of a diversified strategy built on recommendation algorithms and probabilistic modeling.
What are the Key Data Covered in this Digitaling Spending Market Research and Growth Report?
-
What is the expected growth of the Digitaling Spending Market between 2026 and 2030?
-
USD 447.6 billion, at a CAGR of 9.4%
-
-
What segmentation does the market report cover?
-
The report is segmented by Application (Mobile devices, and Desktops), Type (Search ads, Display ads, Social media, E-mail marketing, and Others), Pricing Scheme (Cost-per-click, Cost-per-mille, Cost-per-action, and Others) and Geography (APAC, North America, Europe, South America, Middle East and Africa)
-
-
Which regions are analyzed in the report?
-
APAC, North America, Europe, South America and Middle East and Africa
-
-
What are the key growth drivers and market challenges?
-
Integration of AI into digital advertising ecosystems, Budget constraints and economic uncertainty
-
-
Who are the major players in the Digitaling Spending Market?
-
Accenture Plc, Acquia Inc., Act On Software Inc., ActiveCampaign LLC, Adobe Inc., Alibaba Group Holding Ltd., Amazon.com Inc., ByteDance Ltd., Dentsu Group Inc., Disruptive Advertising Inc., Google LLC, HubSpot Inc., IBM Corp., Intuit Inc., Meta Platforms Inc., Microsoft Corp., Oracle Corp., Salesforce Inc. and SAP SE
-
Market Research Insights
- The digital marketing spending market is characterized by a strategic shift towards automation and data-driven precision. Effective digital campaign management now relies on automated bidding processes and sophisticated tools for real-time consumer data analysis, enabling refined audience segmentation.
- Organizations that successfully implement cross-channel orchestration and detailed customer journey mapping report customer retention rates over 15% higher than peers using siloed channel strategies. Furthermore, the adoption of AI for personalized content delivery and dynamic ad versioning has proven to enhance operational efficiency, with some marketing teams reducing creative production timelines by up to 40%.
- This focus on integrated, intelligent systems allows for more effective resource allocation and demonstrably higher returns on marketing investments across the entire digital ecosystem.
We can help! Our analysts can customize this digitaling spending market research report to meet your requirements.
 RIA -
RIA - 
