On-board Diagnostics Telematics Market Analysis, Size, and Forecast 2026-2030: North America (US, Canada, and Mexico), Europe (Germany, UK, and France), APAC (China, Japan, and India), South America (Brazil and Argentina), Middle East and Africa (Saudi Arabia, UAE, and South Africa), and Rest of World (ROW)

On-board Diagnostics Telematics Market Analysis, Size, and Forecast 2026-2030:
North America (US, Canada, and Mexico), Europe (Germany, UK, and France), APAC (China, Japan, and India), South America (Brazil and Argentina), Middle East and Africa (Saudi Arabia, UAE, and South Africa), and Rest of World (ROW)

Published: Mar 2026 292 Pages SKU: IRTNTR43026

Market Overview at a Glance

$4.91 B
Market Opportunity
15.8%
CAGR 2025 - 2030
38.4%
North America Growth
$2.65 B
Passenger cars segment 2024

On-board Diagnostics Telematics Market Size 2026-2030

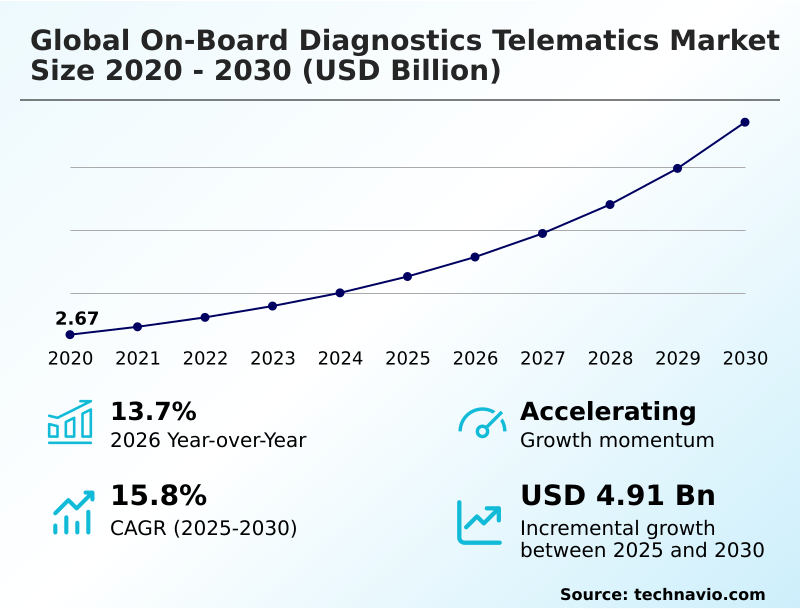
The on-board diagnostics telematics market size is valued to increase by USD 4.91 billion, at a CAGR of 15.8% from 2025 to 2030. Government initiatives increasing adoption of OBD telematics systems will drive the on-board diagnostics telematics market.

Major Market Trends & Insights

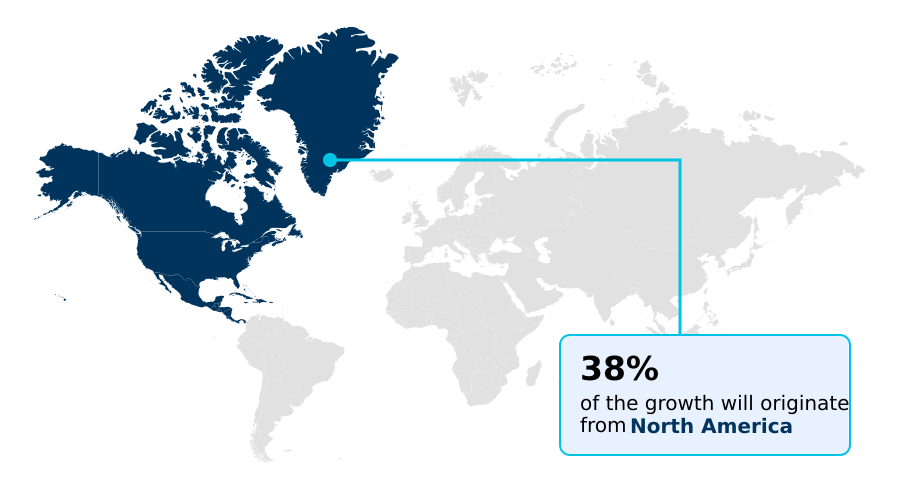
  • North America dominated the market and accounted for a 38.4% growth during the forecast period.
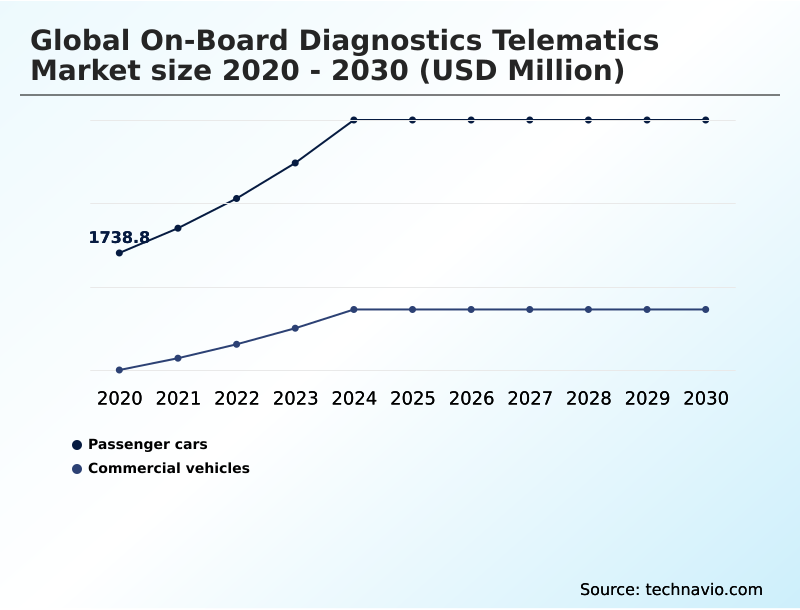
  • By Type - Passenger cars segment was valued at USD 2.65 billion in 2024
  • By Component - Hardware segment accounted for the largest market revenue share in 2024

Market Size & Forecast

  • Market Opportunities: USD 6.75 billion
  • Market Future Opportunities: USD 4.91 billion
  • CAGR from 2025 to 2030 : 15.8%

Market Summary

  • The On-board Diagnostics Telematics market is rapidly evolving beyond simple vehicle tracking into a sophisticated data-driven service economy. Core to this transformation is the integration of a telematics control unit with fleet management software, enabling real-time vehicle tracking and advanced driver behavior analytics.
  • This connected vehicle ecosystem supports critical business functions, such as deploying predictive maintenance algorithms to reduce vehicle downtime and utilizing AI-powered fuel management to lower operational costs. A key application is in logistics and transportation telematics, where an electronic logging device (ELD) ensures regulatory compliance.
  • For instance, a long-haul freight company utilizes CAN bus data extraction and remote diagnostics to monitor engine performance monitoring in real-time. This allows for fault code interpretation from a central dashboard, triggering vehicle health alerts and preventing costly roadside breakdowns.
  • This shift toward a software-defined vehicle, facilitated by over-the-air (OTA) updates and open-platform telematics, creates new opportunities for vehicle data monetization and enhanced supply chain visibility.

What will be the Size of the On-board Diagnostics Telematics Market during the forecast period?

Get Key Insights on Market Forecast (PDF) Request Free Sample

How is the On-board Diagnostics Telematics Market Segmented?

The on-board diagnostics telematics industry research report provides comprehensive data (region-wise segment analysis), with forecasts and estimates in "USD million" for the period 2026-2030, as well as historical data from 2020-2024 for the following segments.

  • Type
    • Passenger cars
    • Commercial vehicles
  • Component
    • Hardware
    • Software
    • Services
  • Communication technology
    • Cellular
    • Bluetooth and Wi-Fi
    • Satellite and Hybrid
  • Geography
    • North America
      • US
      • Canada
      • Mexico
    • Europe
      • Germany
      • UK
      • France
    • APAC
      • China
      • Japan
      • India
    • South America
      • Brazil
      • Argentina
    • Middle East and Africa
      • Saudi Arabia
      • UAE
      • South Africa
    • Rest of World (ROW)

By Type Insights

The passenger cars segment is estimated to witness significant growth during the forecast period.

The passenger car segment is driven by consumer demand for an enhanced connected vehicle ecosystem and personal safety.

The integration of a plug-and-play telematics dongle or an aftermarket OBD-II device enables sophisticated telematics data analytics, supporting services from stolen vehicle recovery to proactive vehicle health monitoring.

Real-time vehicle health alerts and predictive maintenance algorithms empower owners, while driver coaching programs and usage-based insurance models leverage data to improve safety and reduce costs. The adoption of these data-driven programs has seen enrollment increases of up to 15%.

This shift is supported by robust data privacy frameworks and the availability of API-driven data access, making e-call emergency response and EV battery management standard expectations.

Request Free Sample

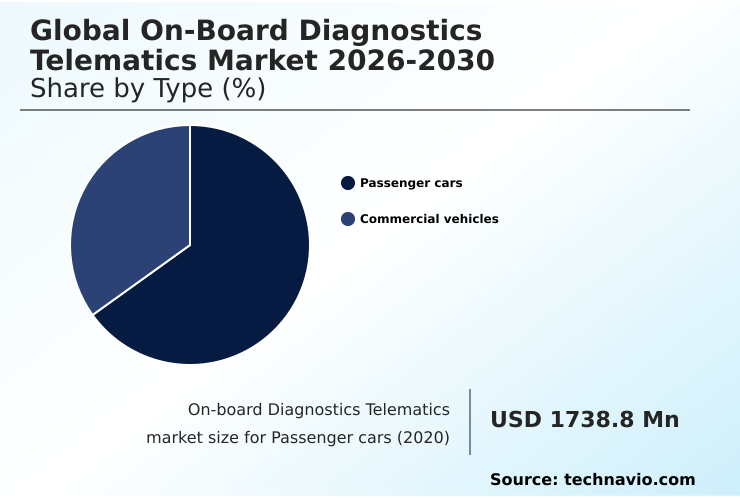
The Passenger cars segment was valued at USD 2.65 billion in 2024 and showed a gradual increase during the forecast period.

Request Free Sample

Regional Analysis

North America is estimated to contribute 38.4% to the growth of the global market during the forecast period.Technavio’s analysts have elaborately explained the regional trends and drivers that shape the market during the forecast period.

See How On-board Diagnostics Telematics Market Demand is Rising in North America Request Free Sample

The global geographic landscape is characterized by distinct regional drivers and adoption patterns. North America, which accounts for over 38% of the market's incremental growth, leads in the adoption of solutions for logistics and transportation telematics, driven by regulatory mandates.

In Europe, the focus is on compliance with stringent emissions standards and cross-border telematics services, where the use of a smart tachograph standard is widespread.

The APAC region is experiencing rapid growth fueled by the need for supply chain visibility and mobile asset management in burgeoning e-commerce sectors.

Across these regions, the demand for specialized capabilities such as cold chain logistics monitoring and electronic proof of delivery is increasing.

The use of a unified fleet dashboard and robust asset tracking hardware allows global enterprises to achieve asset utilization reporting improvements of up to 25%, creating a standardized operational view across diverse regulatory environments.

Market Dynamics

Our researchers analyzed the data with 2025 as the base year, along with the key drivers, trends, and challenges. A holistic analysis of drivers will help companies refine their marketing strategies to gain a competitive advantage.

  • Strategically deploying on-board diagnostics telematics requires a comprehensive approach that moves beyond simple tracking to full operational integration. The benefits of OTA updates for telematics are clear, enabling continuous improvement without physical intervention. A primary business case involves integrating telematics with fleet management software to create a single source of truth for all vehicle and driver data.
  • For urban-focused operations, leveraging V2X communication for smart cities is becoming a key differentiator, improving safety and efficiency. The role of telematics in last-mile delivery is particularly crucial, where a 10% improvement in route accuracy can significantly impact customer satisfaction.
  • Businesses are increasingly using predictive analytics for proactive maintenance, which can reduce unexpected downtime by over 30% compared to traditional reactive models. For specialized industries, using telematics for cold chain monitoring ensures product integrity. As the market matures, the focus shifts to advanced applications like deploying OBD telematics for usage-based insurance and optimizing logistics with AI-powered telematics.
  • Ensuring ELD compliance with telematics systems remains a foundational requirement for commercial fleets. Key decisions now revolve around comparing aftermarket vs. embedded telematics solutions and managing electric vehicle fleets with telematics. Addressing cybersecurity in connected vehicle platforms and the challenges of telematics data privacy compliance are paramount.
  • Furthermore, standardizing data with the next-generation telematics protocol is essential for future-proofing investments, while improving driver safety with video telematics offers tangible risk reduction. Implementing geofencing for asset security, reducing fuel costs with driver analytics, and enabling remote diagnostics for vehicle fleets are now standard expectations.
  • Finally, monetizing vehicle data through telematics platforms is the next frontier for many organizations, with specialized applications extending to telematics for heavy equipment and construction.

What are the key market drivers leading to the rise in the adoption of On-board Diagnostics Telematics Industry?

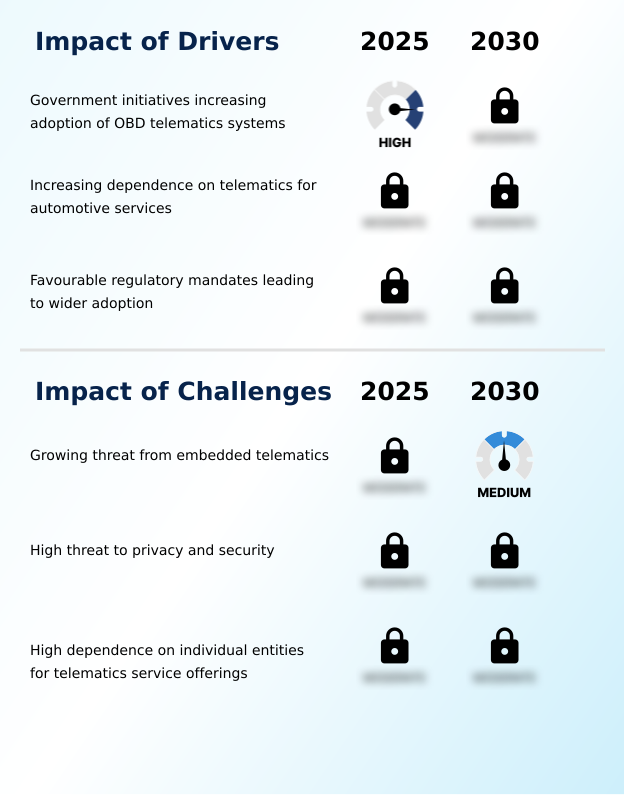
  • Government initiatives and favorable regulatory mandates promoting the adoption of on-board diagnostics telematics systems are key drivers for market growth.

  • Regulatory mandates and the pursuit of operational efficiency are primary drivers fueling market adoption. Government initiatives requiring the electronic logging device for commercial fleets have created a foundational demand, with compliant systems achieving a 99% accuracy rate in hours-of-service tracking.
  • This push for compliance-as-a-service is a cornerstone of logistics and transportation telematics.
  • Concurrently, the increasing dependence on a data-driven service economy for automotive services, such as usage-based insurance, provides direct financial incentives, with safe drivers saving up to 30% on premiums.
  • For fleet operators, the ability to perform remote diagnostics and fault code interpretation in real-time minimizes downtime.
  • Furthermore, the standardization of the CAN bus data extraction process and the OBD-II port provides a universal interface, simplifying the deployment of asset tracking hardware and fleet management software across diverse vehicle fleets.

What are the market trends shaping the On-board Diagnostics Telematics Industry?

  • The standardization of telematics platforms through the Next-Generation Telematics Protocol (NGTP) is an emerging market trend. This development fosters greater interoperability among service providers and system components.

  • The market is witnessing a significant shift toward open-platform telematics, driven by the adoption of the next-generation telematics protocol. This trend fosters greater interoperability, allowing for seamless third-party logistics integration and the development of a richer connected vehicle ecosystem.
  • The rise of the software-defined vehicle is accelerated by over-the-air updates, enabling vehicle data monetization and the deployment of digital twin modeling, which can improve design-phase error detection by 40%. Advanced driver-assistance systems (ADAS) are increasingly reliant on sensor fusion technology and high-definition mapping, with some systems now reducing collision risks by up to 25%.
  • This data-driven service economy is pushing telematics service providers to offer more sophisticated analytics, including AI-powered fuel management and predictive maintenance algorithms that reduce operational costs by 15%.

What challenges does the On-board Diagnostics Telematics Industry face during its growth?

  • The growing threat from factory-installed embedded telematics, which bypasses the need for aftermarket hardware, presents a key challenge to the sector's growth.

  • The market faces significant challenges from the growing prevalence of OEM-embedded solutions and rising cybersecurity threats. The integration of an embedded telematics module at the factory level threatens aftermarket telematics providers, as it offers a seamless user experience and eliminates the need for an aftermarket OBD-II device.
  • This trend could capture up to 60% of the new vehicle market within the next five years. Simultaneously, diagnostic port security has become a paramount concern, with reports indicating that a single vulnerability can be exploited to gain remote vehicle immobilization capabilities.
  • The high threat to privacy and security from unsecured cellular modem integration or weak data privacy frameworks can erode consumer trust and lead to penalties exceeding 4% of global revenue. This environment forces providers to invest heavily in cybersecurity in telematics and secure API-driven data access.

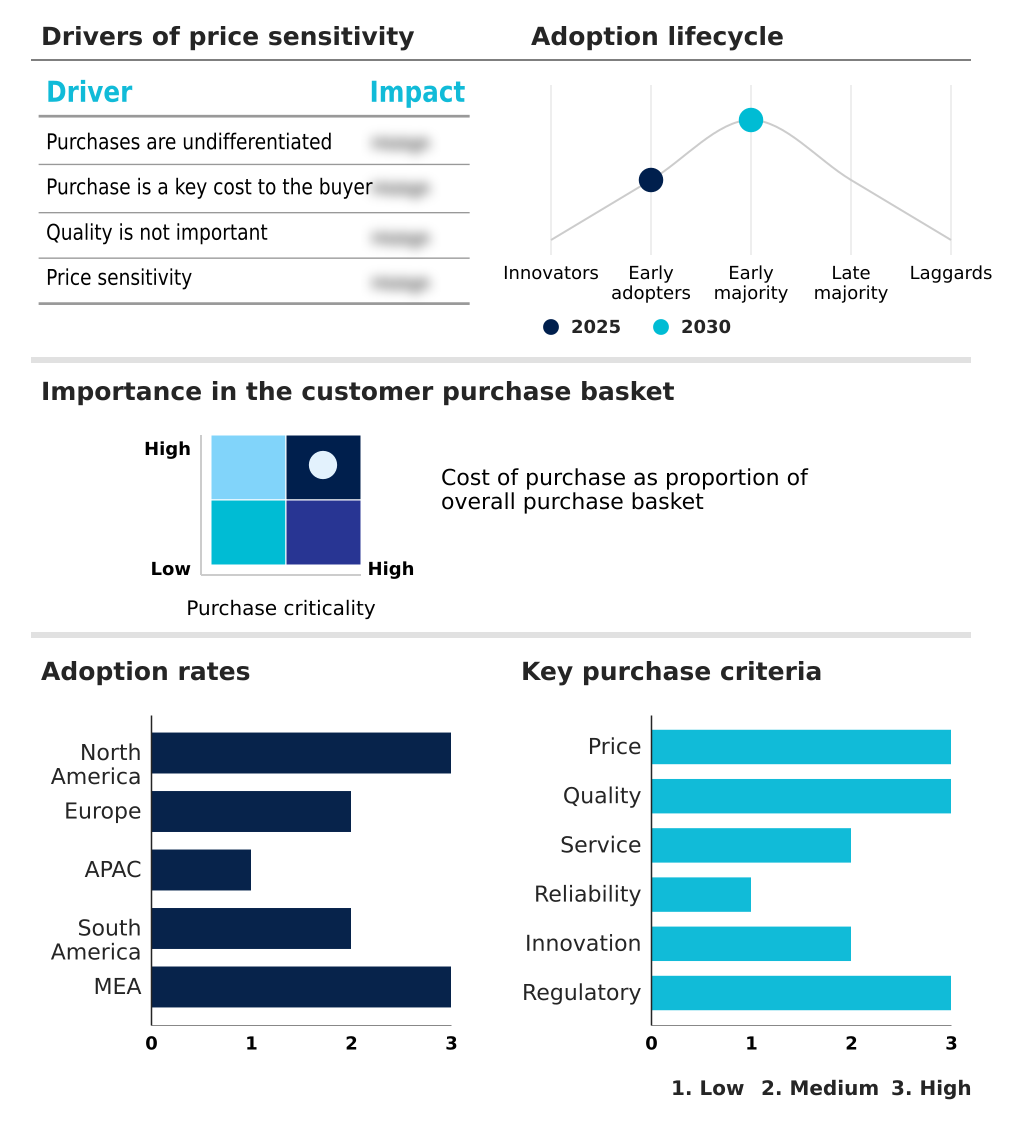
Exclusive Technavio Analysis on Customer Landscape

The on-board diagnostics telematics market forecasting report includes the adoption lifecycle of the market, covering from the innovator’s stage to the laggard’s stage. It focuses on adoption rates in different regions based on penetration. Furthermore, the on-board diagnostics telematics market report also includes key purchase criteria and drivers of price sensitivity to help companies evaluate and develop their market growth analysis strategies.

Customer Landscape of On-board Diagnostics Telematics Industry

Competitive Landscape

Companies are implementing various strategies, such as strategic alliances, on-board diagnostics telematics market forecast, partnerships, mergers and acquisitions, geographical expansion, and product/service launches, to enhance their presence in the industry.

Aptiv PLC - Provides connected vehicle platforms and telematics control units, enabling advanced automotive diagnostics and secure data connectivity for automotive systems.

The industry research and growth report includes detailed analyses of the competitive landscape of the market and information about key companies, including:

  • Aptiv PLC
  • CalAmp Corp.
  • Cambridge Mobile Telematics Inc.
  • Continental AG
  • Danlaw Inc.
  • Geotab Inc.
  • Ituran Location and Control Ltd.
  • Mojio Inc.
  • Octo Telematics S.p.A.
  • PowerFleet Inc.
  • Quartix Technologies plc
  • Robert Bosch GmbH
  • Samsara Inc.
  • SmartDrive Systems Inc.
  • Spireon LLC
  • UAB Ruptela
  • Verizon Connect
  • Webfleet Solutions B.V.
  • Xirgo Technologies LLC
  • Zubie Inc.

Qualitative and quantitative analysis of companies has been conducted to help clients understand the wider business environment as well as the strengths and weaknesses of key industry players. Data is qualitatively analyzed to categorize companies as pure play, category-focused, industry-focused, and diversified; it is quantitatively analyzed to categorize companies as dominant, leading, strong, tentative, and weak.

Recent Development and News in On-board diagnostics telematics market

  • In January, 2025, Ford Motor Company announced a major software update for its connected vehicle fleet, allowing third-party developers to access diagnostic data directly via the cloud without requiring any OBD hardware.
  • In May, 2025, Progressive Insurance expanded its telematics-based snapshot program to include real-time vehicle health alerts for users, which resulted in a fifteen percent increase in enrollment for that month.
  • In August, 2025, Geotab introduced a new artificial intelligence-powered fuel management module that provides fleet managers with hyper-localized insights on driver behavior and its direct impact on carbon emissions.
  • In September, 2025, General Motors announced that all of its upcoming electric vehicle models would feature an enhanced connectivity suite with native support for advanced diagnostic and energy management tools.

Dive into Technavio’s robust research methodology, blending expert interviews, extensive data synthesis, and validated models for unparalleled On-board Diagnostics Telematics Market insights. See full methodology.

Market Scope
Page number 292
Base year 2025
Historic period 2020-2024
Forecast period 2026-2030
Growth momentum & CAGR Accelerate at a CAGR of 15.8%
Market growth 2026-2030 USD 4907.0 million
Market structure Fragmented
YoY growth 2025-2026(%) 13.7%
Key countries US, Canada, Mexico, Germany, UK, France, Italy, Spain, The Netherlands, China, Japan, India, South Korea, Australia, Indonesia, Brazil, Argentina, Chile, Saudi Arabia, UAE, South Africa, Turkey and Israel
Competitive landscape Leading Companies, Market Positioning of Companies, Competitive Strategies, and Industry Risks

Request Free Sample

Research Analyst Overview

  • The on-board diagnostics telematics market is defined by the convergence of advanced hardware and intelligent software, fundamentally reshaping vehicle and asset management. Boardroom decisions are now directly influenced by the capabilities of these systems, particularly in budgeting for compliance and product strategy.
  • The core of the market revolves around the telematics control unit and its integration with a cloud-based telematics platform, enabling everything from real-time vehicle tracking to predictive analytics for fleet operations. The software-defined vehicle concept is accelerated by over-the-air updates, while AI-powered fuel management and route optimization software deliver measurable cost savings.
  • For commercial fleets, the electronic logging device and smart tachograph standards are non-negotiable for compliance, complemented by video-based safety solutions and driver behavior analytics. Hardware, from the embedded telematics module to the aftermarket OBD-II device and plug-and-play telematics dongle, captures critical data through CAN bus data extraction for fault code interpretation.
  • This ecosystem supports advanced applications like vehicle-to-everything communication, usage-based insurance, and last-mile delivery optimization, with companies reporting a 30% reduction in unscheduled downtime. Critical support functions include geofencing alerts, remote vehicle immobilization, and cold chain logistics monitoring, all while navigating the complexities of cybersecurity in telematics and vehicle data monetization.

What are the Key Data Covered in this On-board Diagnostics Telematics Market Research and Growth Report?

  • What is the expected growth of the On-board Diagnostics Telematics Market between 2026 and 2030?

    • USD 4.91 billion, at a CAGR of 15.8%

  • What segmentation does the market report cover?

    • The report is segmented by Type (Passenger cars, and Commercial vehicles), Component (Hardware, Software, and Services), Communication Technology (Cellular, Bluetooth and Wi-Fi, and Satellite and Hybrid) and Geography (North America, Europe, APAC, South America, Middle East and Africa)

  • Which regions are analyzed in the report?

    • North America, Europe, APAC, South America and Middle East and Africa

  • What are the key growth drivers and market challenges?

    • Government initiatives increasing adoption of OBD telematics systems, Growing threat from embedded telematics

  • Who are the major players in the On-board Diagnostics Telematics Market?

    • Aptiv PLC, CalAmp Corp., Cambridge Mobile Telematics Inc., Continental AG, Danlaw Inc., Geotab Inc., Ituran Location and Control Ltd., Mojio Inc., Octo Telematics S.p.A., PowerFleet Inc., Quartix Technologies plc, Robert Bosch GmbH, Samsara Inc., SmartDrive Systems Inc., Spireon LLC, UAB Ruptela, Verizon Connect, Webfleet Solutions B.V., Xirgo Technologies LLC and Zubie Inc.

Market Research Insights

  • The market's momentum is driven by the tangible ROI from adopting a unified fleet dashboard for mobile asset management. The integration of advanced driver-assistance systems (ADAS) and vehicle-to-infrastructure (V2I) communication is creating a more interconnected and data-rich environment.
  • Businesses leveraging telematics data analytics are seeing operational efficiency gains, with some reporting a 20% reduction in fuel consumption through optimized routing and driver coaching programs. Furthermore, the use of risk assessment modeling derived from telematics data has enabled insurance partners to lower commercial fleet premiums by up to 15%.
  • As the industry shifts toward a data-driven service economy, telematics service providers (TSPs) that offer robust API-driven data access and demonstrate strong data privacy frameworks are gaining a competitive advantage, achieving customer retention rates over 90%.

We can help! Our analysts can customize this on-board diagnostics telematics market research report to meet your requirements.

Get in touch

1. Executive Summary

1.1 Market overview

Executive Summary - Chart on Market Overview
Executive Summary - Data Table on Market Overview
Executive Summary - Chart on Global Market Characteristics
Executive Summary - Chart on Market by Geography
Executive Summary - Chart on Market Segmentation by Type
Executive Summary - Chart on Market Segmentation by Component
Executive Summary - Chart on Market Segmentation by Communication Technology
Executive Summary - Chart on Incremental Growth
Executive Summary - Data Table on Incremental Growth
Executive Summary - Chart on Company Market Positioning

2. Technavio Analysis

2.1 Analysis of price sensitivity, lifecycle, customer purchase basket, adoption rates, and purchase criteria

2.2 Criticality of inputs and Factors of differentiation

Chart on Overview on criticality of inputs and factors of differentiation

2.3 Factors of disruption

Chart on Overview on factors of disruption

2.4 Impact of drivers and challenges

Chart on Impact of drivers and challenges in 2025 and 2030

3. Market Landscape

3.1 Market ecosystem

Chart on Parent Market
Data Table on - Parent Market

3.2 Market characteristics

Chart on Market characteristics analysis

3.3 Value chain analysis

Chart on Value chain analysis

4. Market Sizing

4.1 Market definition

Data Table on Offerings of companies included in the market definition

4.2 Market segment analysis

Market segments

4.3 Market size 2025

4.4 Market outlook: Forecast for 2025-2030

Chart on Global - Market size and forecast 2025-2030 ($ million)
Data Table on Global - Market size and forecast 2025-2030 ($ million)
Chart on Global Market: Year-over-year growth 2025-2030 (%)
Data Table on Global Market: Year-over-year growth 2025-2030 (%)

5. Historic Market Size

5.1 Global On-Board Diagnostics Telematics Market 2020 - 2024

Historic Market Size - Data Table on Global On-Board Diagnostics Telematics Market 2020 - 2024 ($ million)

5.2 Type segment analysis 2020 - 2024

Historic Market Size - Type Segment 2020 - 2024 ($ million)

5.3 Component segment analysis 2020 - 2024

Historic Market Size - Component Segment 2020 - 2024 ($ million)

5.4 Communication Technology segment analysis 2020 - 2024

Historic Market Size - Communication Technology Segment 2020 - 2024 ($ million)

5.5 Geography segment analysis 2020 - 2024

Historic Market Size - Geography Segment 2020 - 2024 ($ million)

5.6 Country segment analysis 2020 - 2024

Historic Market Size - Country Segment 2020 - 2024 ($ million)

6. Qualitative Analysis

6.1 Impact of AI on Global On-Board Diagnostics Telematics Market

6.2 Impact of Geopolitical Conflicts on Global On-Board Diagnostics Telematics Market

7. Five Forces Analysis

7.1 Five forces summary

Five forces analysis - Comparison between 2025 and 2030

7.2 Bargaining power of buyers

Bargaining power of buyers - Impact of key factors 2025 and 2030

7.3 Bargaining power of suppliers

Bargaining power of suppliers - Impact of key factors in 2025 and 2030

7.4 Threat of new entrants

Threat of new entrants - Impact of key factors in 2025 and 2030

7.5 Threat of substitutes

Threat of substitutes - Impact of key factors in 2025 and 2030

7.6 Threat of rivalry

Threat of rivalry - Impact of key factors in 2025 and 2030

7.7 Market condition

Chart on Market condition - Five forces 2025 and 2030

8. Market Segmentation by Type

8.1 Market segments

Chart on Type - Market share 2025-2030 (%)
Data Table on Type - Market share 2025-2030 (%)

8.2 Comparison by Type

Chart on Comparison by Type
Data Table on Comparison by Type

8.3 Passenger cars - Market size and forecast 2025-2030

Chart on Passenger cars - Market size and forecast 2025-2030 ($ million)
Data Table on Passenger cars - Market size and forecast 2025-2030 ($ million)
Chart on Passenger cars - Year-over-year growth 2025-2030 (%)
Data Table on Passenger cars - Year-over-year growth 2025-2030 (%)

8.4 Commercial vehicles - Market size and forecast 2025-2030

Chart on Commercial vehicles - Market size and forecast 2025-2030 ($ million)
Data Table on Commercial vehicles - Market size and forecast 2025-2030 ($ million)
Chart on Commercial vehicles - Year-over-year growth 2025-2030 (%)
Data Table on Commercial vehicles - Year-over-year growth 2025-2030 (%)

8.5 Market opportunity by Type

Market opportunity by Type ($ million)
Data Table on Market opportunity by Type ($ million)

9. Market Segmentation by Component

9.1 Market segments

Chart on Component - Market share 2025-2030 (%)
Data Table on Component - Market share 2025-2030 (%)

9.2 Comparison by Component

Chart on Comparison by Component
Data Table on Comparison by Component

9.3 Hardware - Market size and forecast 2025-2030

Chart on Hardware - Market size and forecast 2025-2030 ($ million)
Data Table on Hardware - Market size and forecast 2025-2030 ($ million)
Chart on Hardware - Year-over-year growth 2025-2030 (%)
Data Table on Hardware - Year-over-year growth 2025-2030 (%)

9.4 Software - Market size and forecast 2025-2030

Chart on Software - Market size and forecast 2025-2030 ($ million)
Data Table on Software - Market size and forecast 2025-2030 ($ million)
Chart on Software - Year-over-year growth 2025-2030 (%)
Data Table on Software - Year-over-year growth 2025-2030 (%)

9.5 Services - Market size and forecast 2025-2030

Chart on Services - Market size and forecast 2025-2030 ($ million)
Data Table on Services - Market size and forecast 2025-2030 ($ million)
Chart on Services - Year-over-year growth 2025-2030 (%)
Data Table on Services - Year-over-year growth 2025-2030 (%)

9.6 Market opportunity by Component

Market opportunity by Component ($ million)
Data Table on Market opportunity by Component ($ million)

10. Market Segmentation by Communication Technology

10.1 Market segments

Chart on Communication Technology - Market share 2025-2030 (%)
Data Table on Communication Technology - Market share 2025-2030 (%)

10.2 Comparison by Communication Technology

Chart on Comparison by Communication Technology
Data Table on Comparison by Communication Technology

10.3 Cellular - Market size and forecast 2025-2030

Chart on Cellular - Market size and forecast 2025-2030 ($ million)
Data Table on Cellular - Market size and forecast 2025-2030 ($ million)
Chart on Cellular - Year-over-year growth 2025-2030 (%)
Data Table on Cellular - Year-over-year growth 2025-2030 (%)

10.4 Bluetooth and Wi-Fi - Market size and forecast 2025-2030

Chart on Bluetooth and Wi-Fi - Market size and forecast 2025-2030 ($ million)
Data Table on Bluetooth and Wi-Fi - Market size and forecast 2025-2030 ($ million)
Chart on Bluetooth and Wi-Fi - Year-over-year growth 2025-2030 (%)
Data Table on Bluetooth and Wi-Fi - Year-over-year growth 2025-2030 (%)

10.5 Satellite and Hybrid - Market size and forecast 2025-2030

Chart on Satellite and Hybrid - Market size and forecast 2025-2030 ($ million)
Data Table on Satellite and Hybrid - Market size and forecast 2025-2030 ($ million)
Chart on Satellite and Hybrid - Year-over-year growth 2025-2030 (%)
Data Table on Satellite and Hybrid - Year-over-year growth 2025-2030 (%)

10.6 Market opportunity by Communication Technology

Market opportunity by Communication Technology ($ million)
Data Table on Market opportunity by Communication Technology ($ million)

11. Customer Landscape

11.1 Customer landscape overview

Analysis of price sensitivity, lifecycle, customer purchase basket, adoption rates, and purchase criteria

12. Geographic Landscape

12.1 Geographic segmentation

Chart on Market share by geography 2025-2030 (%)
Data Table on Market share by geography 2025-2030 (%)

12.2 Geographic comparison

Chart on Geographic comparison
Data Table on Geographic comparison

12.3 North America - Market size and forecast 2025-2030

Chart on North America - Market size and forecast 2025-2030 ($ million)
Data Table on North America - Market size and forecast 2025-2030 ($ million)
Chart on North America - Year-over-year growth 2025-2030 (%)
Data Table on North America - Year-over-year growth 2025-2030 (%)
Chart on Regional Comparison - North America
Data Table on Regional Comparison - North America

12.3.1 US - Market size and forecast 2025-2030

Chart on US - Market size and forecast 2025-2030 ($ million)
Data Table on US - Market size and forecast 2025-2030 ($ million)
Chart on US - Year-over-year growth 2025-2030 (%)
Data Table on US - Year-over-year growth 2025-2030 (%)

12.3.2 Canada - Market size and forecast 2025-2030

Chart on Canada - Market size and forecast 2025-2030 ($ million)
Data Table on Canada - Market size and forecast 2025-2030 ($ million)
Chart on Canada - Year-over-year growth 2025-2030 (%)
Data Table on Canada - Year-over-year growth 2025-2030 (%)

12.3.3 Mexico - Market size and forecast 2025-2030

Chart on Mexico - Market size and forecast 2025-2030 ($ million)
Data Table on Mexico - Market size and forecast 2025-2030 ($ million)
Chart on Mexico - Year-over-year growth 2025-2030 (%)
Data Table on Mexico - Year-over-year growth 2025-2030 (%)

12.4 Europe - Market size and forecast 2025-2030

Chart on Europe - Market size and forecast 2025-2030 ($ million)
Data Table on Europe - Market size and forecast 2025-2030 ($ million)
Chart on Europe - Year-over-year growth 2025-2030 (%)
Data Table on Europe - Year-over-year growth 2025-2030 (%)
Chart on Regional Comparison - Europe
Data Table on Regional Comparison - Europe

12.4.1 Germany - Market size and forecast 2025-2030

Chart on Germany - Market size and forecast 2025-2030 ($ million)
Data Table on Germany - Market size and forecast 2025-2030 ($ million)
Chart on Germany - Year-over-year growth 2025-2030 (%)
Data Table on Germany - Year-over-year growth 2025-2030 (%)

12.4.2 UK - Market size and forecast 2025-2030

Chart on UK - Market size and forecast 2025-2030 ($ million)
Data Table on UK - Market size and forecast 2025-2030 ($ million)
Chart on UK - Year-over-year growth 2025-2030 (%)
Data Table on UK - Year-over-year growth 2025-2030 (%)

12.4.3 France - Market size and forecast 2025-2030

Chart on France - Market size and forecast 2025-2030 ($ million)
Data Table on France - Market size and forecast 2025-2030 ($ million)
Chart on France - Year-over-year growth 2025-2030 (%)
Data Table on France - Year-over-year growth 2025-2030 (%)

12.4.4 Italy - Market size and forecast 2025-2030

Chart on Italy - Market size and forecast 2025-2030 ($ million)
Data Table on Italy - Market size and forecast 2025-2030 ($ million)
Chart on Italy - Year-over-year growth 2025-2030 (%)
Data Table on Italy - Year-over-year growth 2025-2030 (%)

12.4.5 Spain - Market size and forecast 2025-2030

Chart on Spain - Market size and forecast 2025-2030 ($ million)
Data Table on Spain - Market size and forecast 2025-2030 ($ million)
Chart on Spain - Year-over-year growth 2025-2030 (%)
Data Table on Spain - Year-over-year growth 2025-2030 (%)

12.4.6 The Netherlands - Market size and forecast 2025-2030

Chart on The Netherlands - Market size and forecast 2025-2030 ($ million)
Data Table on The Netherlands - Market size and forecast 2025-2030 ($ million)
Chart on The Netherlands - Year-over-year growth 2025-2030 (%)
Data Table on The Netherlands - Year-over-year growth 2025-2030 (%)

12.5 APAC - Market size and forecast 2025-2030

Chart on APAC - Market size and forecast 2025-2030 ($ million)
Data Table on APAC - Market size and forecast 2025-2030 ($ million)
Chart on APAC - Year-over-year growth 2025-2030 (%)
Data Table on APAC - Year-over-year growth 2025-2030 (%)
Chart on Regional Comparison - APAC
Data Table on Regional Comparison - APAC

12.5.1 China - Market size and forecast 2025-2030

Chart on China - Market size and forecast 2025-2030 ($ million)
Data Table on China - Market size and forecast 2025-2030 ($ million)
Chart on China - Year-over-year growth 2025-2030 (%)
Data Table on China - Year-over-year growth 2025-2030 (%)

12.5.2 Japan - Market size and forecast 2025-2030

Chart on Japan - Market size and forecast 2025-2030 ($ million)
Data Table on Japan - Market size and forecast 2025-2030 ($ million)
Chart on Japan - Year-over-year growth 2025-2030 (%)
Data Table on Japan - Year-over-year growth 2025-2030 (%)

12.5.3 India - Market size and forecast 2025-2030

Chart on India - Market size and forecast 2025-2030 ($ million)
Data Table on India - Market size and forecast 2025-2030 ($ million)
Chart on India - Year-over-year growth 2025-2030 (%)
Data Table on India - Year-over-year growth 2025-2030 (%)

12.5.4 South Korea - Market size and forecast 2025-2030

Chart on South Korea - Market size and forecast 2025-2030 ($ million)
Data Table on South Korea - Market size and forecast 2025-2030 ($ million)
Chart on South Korea - Year-over-year growth 2025-2030 (%)
Data Table on South Korea - Year-over-year growth 2025-2030 (%)

12.5.5 Australia - Market size and forecast 2025-2030

Chart on Australia - Market size and forecast 2025-2030 ($ million)
Data Table on Australia - Market size and forecast 2025-2030 ($ million)
Chart on Australia - Year-over-year growth 2025-2030 (%)
Data Table on Australia - Year-over-year growth 2025-2030 (%)

12.5.6 Indonesia - Market size and forecast 2025-2030

Chart on Indonesia - Market size and forecast 2025-2030 ($ million)
Data Table on Indonesia - Market size and forecast 2025-2030 ($ million)
Chart on Indonesia - Year-over-year growth 2025-2030 (%)
Data Table on Indonesia - Year-over-year growth 2025-2030 (%)

12.6 South America - Market size and forecast 2025-2030

Chart on South America - Market size and forecast 2025-2030 ($ million)
Data Table on South America - Market size and forecast 2025-2030 ($ million)
Chart on South America - Year-over-year growth 2025-2030 (%)
Data Table on South America - Year-over-year growth 2025-2030 (%)
Chart on Regional Comparison - South America
Data Table on Regional Comparison - South America

12.6.1 Brazil - Market size and forecast 2025-2030

Chart on Brazil - Market size and forecast 2025-2030 ($ million)
Data Table on Brazil - Market size and forecast 2025-2030 ($ million)
Chart on Brazil - Year-over-year growth 2025-2030 (%)
Data Table on Brazil - Year-over-year growth 2025-2030 (%)

12.6.2 Argentina - Market size and forecast 2025-2030

Chart on Argentina - Market size and forecast 2025-2030 ($ million)
Data Table on Argentina - Market size and forecast 2025-2030 ($ million)
Chart on Argentina - Year-over-year growth 2025-2030 (%)
Data Table on Argentina - Year-over-year growth 2025-2030 (%)

12.6.3 Chile - Market size and forecast 2025-2030

Chart on Chile - Market size and forecast 2025-2030 ($ million)
Data Table on Chile - Market size and forecast 2025-2030 ($ million)
Chart on Chile - Year-over-year growth 2025-2030 (%)
Data Table on Chile - Year-over-year growth 2025-2030 (%)

12.7 Middle East and Africa - Market size and forecast 2025-2030

Chart on Middle East and Africa - Market size and forecast 2025-2030 ($ million)
Data Table on Middle East and Africa - Market size and forecast 2025-2030 ($ million)
Chart on Middle East and Africa - Year-over-year growth 2025-2030 (%)
Data Table on Middle East and Africa - Year-over-year growth 2025-2030 (%)
Chart on Regional Comparison - Middle East and Africa
Data Table on Regional Comparison - Middle East and Africa

12.7.1 Saudi Arabia - Market size and forecast 2025-2030

Chart on Saudi Arabia - Market size and forecast 2025-2030 ($ million)
Data Table on Saudi Arabia - Market size and forecast 2025-2030 ($ million)
Chart on Saudi Arabia - Year-over-year growth 2025-2030 (%)
Data Table on Saudi Arabia - Year-over-year growth 2025-2030 (%)

12.7.2 UAE - Market size and forecast 2025-2030

Chart on UAE - Market size and forecast 2025-2030 ($ million)
Data Table on UAE - Market size and forecast 2025-2030 ($ million)
Chart on UAE - Year-over-year growth 2025-2030 (%)
Data Table on UAE - Year-over-year growth 2025-2030 (%)

12.7.3 South Africa - Market size and forecast 2025-2030

Chart on South Africa - Market size and forecast 2025-2030 ($ million)
Data Table on South Africa - Market size and forecast 2025-2030 ($ million)
Chart on South Africa - Year-over-year growth 2025-2030 (%)
Data Table on South Africa - Year-over-year growth 2025-2030 (%)

12.7.4 Turkey - Market size and forecast 2025-2030

Chart on Turkey - Market size and forecast 2025-2030 ($ million)
Data Table on Turkey - Market size and forecast 2025-2030 ($ million)
Chart on Turkey - Year-over-year growth 2025-2030 (%)
Data Table on Turkey - Year-over-year growth 2025-2030 (%)

12.7.5 Israel - Market size and forecast 2025-2030

Chart on Israel - Market size and forecast 2025-2030 ($ million)
Data Table on Israel - Market size and forecast 2025-2030 ($ million)
Chart on Israel - Year-over-year growth 2025-2030 (%)
Data Table on Israel - Year-over-year growth 2025-2030 (%)

12.8 Market opportunity by geography

Market opportunity by geography ($ million)
Data Tables on Market opportunity by geography ($ million)

13. Drivers, Challenges, and Opportunity

13.1 Market drivers

Government initiatives increasing adoption of OBD telematics systems
Increasing dependence on telematics for automotive services
Favourable regulatory mandates leading to wider adoption

13.2 Market challenges

Growing threat from embedded telematics
High threat to privacy and security
High dependence on individual entities for telematics service offerings

13.3 Impact of drivers and challenges

Impact of drivers and challenges in 2025 and 2030

13.4 Market opportunities

Standardization of telematics platform through next-generation telematics protocol (NGTP)
Use of advanced analytics to optimize vehicle efficiency
Increasing number of vehicle launches featuring connected technologies

14. Competitive Landscape

14.1 Overview

14.2

Overview on criticality of inputs and factors of differentiation

14.3 Landscape disruption

Overview on factors of disruption

14.4 Industry risks

Impact of key risks on business

15. Competitive Analysis

15.1 Companies profiled

Companies covered

15.2 Company ranking index

15.3 Market positioning of companies

Matrix on companies position and classification

15.4 Aptiv PLC

Aptiv PLC - Overview
Aptiv PLC - Business segments
Aptiv PLC - Key news
Aptiv PLC - Key offerings
Aptiv PLC - Segment focus
SWOT

15.5 CalAmp Corp.

CalAmp Corp. - Overview
CalAmp Corp. - Product / Service
CalAmp Corp. - Key offerings
SWOT

15.6 Cambridge Mobile Telematics Inc.

Cambridge Mobile Telematics Inc. - Overview
Cambridge Mobile Telematics Inc. - Product / Service
Cambridge Mobile Telematics Inc. - Key offerings
SWOT

15.7 Continental AG

Continental AG - Overview
Continental AG - Business segments
Continental AG - Key news
Continental AG - Key offerings
Continental AG - Segment focus
SWOT

15.8 Geotab Inc.

Geotab Inc. - Overview
Geotab Inc. - Product / Service
Geotab Inc. - Key offerings
SWOT

15.9 Ituran Location and Control Ltd.

Ituran Location and Control Ltd. - Overview
Ituran Location and Control Ltd. - Business segments
Ituran Location and Control Ltd. - Key offerings
Ituran Location and Control Ltd. - Segment focus
SWOT

15.10 Octo Telematics S.p.A.

Octo Telematics S.p.A. - Overview
Octo Telematics S.p.A. - Product / Service
Octo Telematics S.p.A. - Key offerings
SWOT

15.11 PowerFleet Inc.

PowerFleet Inc. - Overview
PowerFleet Inc. - Product / Service
PowerFleet Inc. - Key news
PowerFleet Inc. - Key offerings
SWOT

15.12 Quartix Technologies plc

Quartix Technologies plc - Overview
Quartix Technologies plc - Business segments
Quartix Technologies plc - Key offerings
Quartix Technologies plc - Segment focus
SWOT

15.13 Samsara Inc.

Samsara Inc. - Overview
Samsara Inc. - Product / Service
Samsara Inc. - Key news
Samsara Inc. - Key offerings
SWOT

15.14 SmartDrive Systems Inc.

SmartDrive Systems Inc. - Overview
SmartDrive Systems Inc. - Product / Service
SmartDrive Systems Inc. - Key offerings
SWOT

15.15 Spireon LLC

Spireon LLC - Overview
Spireon LLC - Product / Service
Spireon LLC - Key offerings
SWOT

15.16 Verizon Connect

Verizon Connect - Overview
Verizon Connect - Product / Service
Verizon Connect - Key offerings
SWOT

15.17 Webfleet Solutions B.V.

Webfleet Solutions B.V. - Overview
Webfleet Solutions B.V. - Product / Service
Webfleet Solutions B.V. - Key offerings
SWOT

15.18 Zubie Inc.

Zubie Inc. - Overview
Zubie Inc. - Product / Service
Zubie Inc. - Key offerings
SWOT

16. Appendix

16.1 Scope of the report

Market definition
Objectives
Notes and caveats

16.2 Inclusions and exclusions checklist

Inclusions checklist
Exclusions checklist

16.3 Currency conversion rates for US$

16.4 Research methodology

16.5 Data procurement

Information sources

16.6 Data validation

16.7 Validation techniques employed for market sizing

16.8 Data synthesis

16.9 360 degree market analysis

16.10 List of abbreviations

Research Methodology

Technavio presents a detailed picture of the market by way of study, synthesis, and summation of data from multiple sources. The analysts have presented the various facets of the market with a particular focus on identifying the key industry influencers. The data thus presented is comprehensive, reliable, and the result of extensive research, both primary and secondary.

INFORMATION SOURCES

Primary sources

  • Manufacturers and suppliers
  • Channel partners
  • Industry experts
  • Strategic decision makers

Secondary sources

  • Industry journals and periodicals
  • Government data
  • Financial reports of key industry players
  • Historical data
  • Press releases

DATA ANALYSIS

Data Synthesis

  • Collation of data
  • Estimation of key figures
  • Analysis of derived insights

Data Validation

  • Triangulation with data models
  • Reference against proprietary databases
  • Corroboration with industry experts

REPORT WRITING

Qualitative

  • Market drivers
  • Market challenges
  • Market trends
  • Five forces analysis

Quantitative

  • Market size and forecast
  • Market segmentation
  • Geographical insights
  • Competitive landscape

Interested in this report?

Get your sample now to see our research methodology and insights!

Download Now

Frequently Asked Questions

On-board Diagnostics Telematics market growth will increase by USD 4907.0 million during 2026-2030.

The On-board Diagnostics Telematics market is expected to grow at a CAGR of 15.8% during 2026-2030.

On-board Diagnostics Telematics market is segmented by Type (Passenger cars, Commercial vehicles) Component (Hardware, Software, Services) Communication technology (Cellular, Bluetooth and Wi-Fi, Satellite and Hybrid)

Aptiv PLC, CalAmp Corp., Cambridge Mobile Telematics Inc., Continental AG, Danlaw Inc., Geotab Inc., Ituran Location and Control Ltd., Mojio Inc., Octo Telematics S.p.A., PowerFleet Inc., Quartix Technologies plc, Robert Bosch GmbH, Samsara Inc., SmartDrive Systems Inc., Spireon LLC, UAB Ruptela, Verizon Connect, Webfleet Solutions B.V., Xirgo Technologies LLC, Zubie Inc. are a few of the key vendors in the On-board Diagnostics Telematics market.

North America will register the highest growth rate of 38.4% among the other regions. Therefore, the On-board Diagnostics Telematics market in North America is expected to garner significant business opportunities for the vendors during the forecast period.

US, Canada, Mexico, Germany, UK, France, Italy, Spain, The Netherlands, China, Japan, India, South Korea, Australia, Indonesia, Brazil, Argentina, Chile, Saudi Arabia, UAE, South Africa, Turkey, Israel

  • Government initiatives increasing adoption of OBD telematics systems is the driving factor this market.

The On-board Diagnostics Telematics market vendors should focus on grabbing business opportunities from the Type segment as it accounted for the largest market share in the base year.
RIA - Research AI Assistant
Ask RIA