2 Methylpropene Market Size 2025-2029
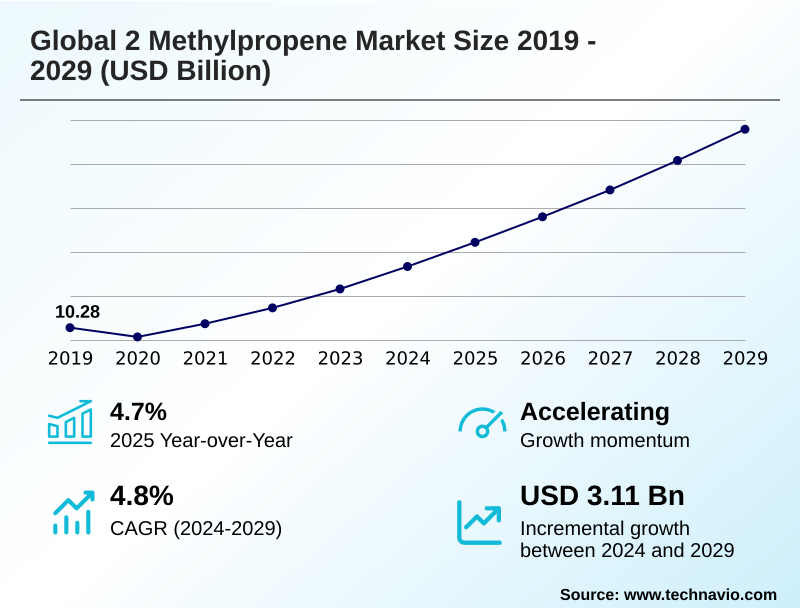
The 2 methylpropene market size is valued to increase by USD 3.11 billion, at a CAGR of 4.8% from 2024 to 2029. Growing demand from automotive industry will drive the 2 methylpropene market.
Major Market Trends & Insights
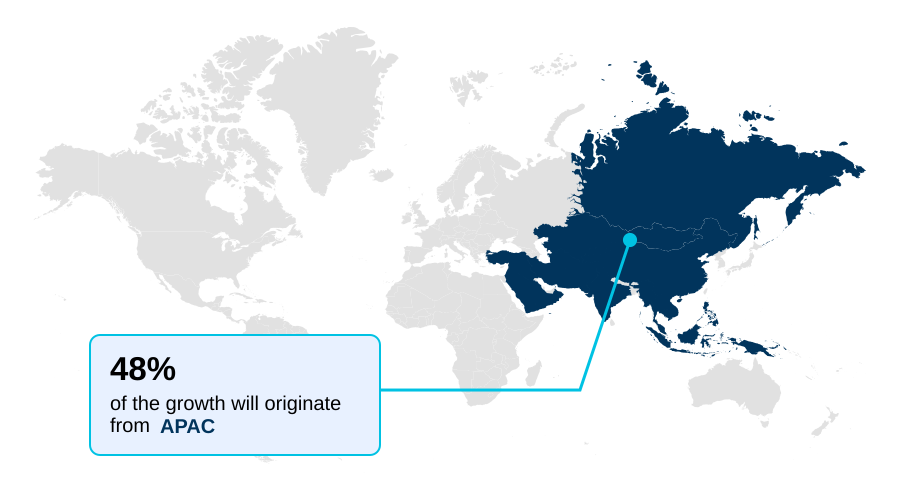
- APAC dominated the market and accounted for a 48.4% growth during the forecast period.
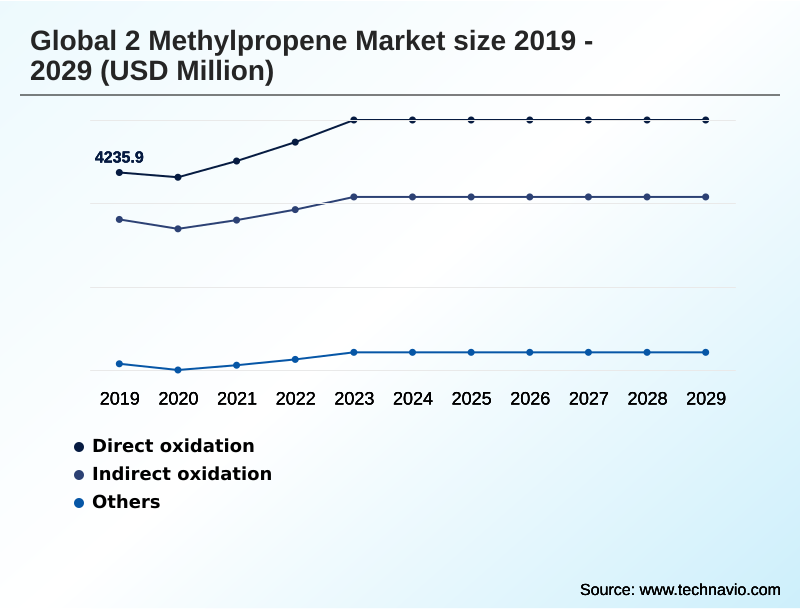
- By Technology - Direct oxidation segment was valued at USD 4.77 billion in 2023
- By Application - Polymerization segment accounted for the largest market revenue share in 2023
Market Size & Forecast
- Market Opportunities: USD 4.51 billion
- Market Future Opportunities: USD 3.11 billion
- CAGR from 2024 to 2029 : 4.8%
Market Summary
- The 2 methylpropene market is centered on a highly reactive branched alkene chemical, a vital chemical building block derived from c4 hydrocarbon streams via processes like steam cracking. Its significance is underscored by its role as a precursor to essential products such as butyl rubber and polyisobutylene (pib).
- Key market drivers include persistent demand from the automotive industry for tire inner liners and fuel and lubricant additives, alongside the construction sector's need for high-performance coatings and adhesives and sealants. A prominent trend involves the industry's pivot toward sustainability, with active research into bio-based feedstock and on-purpose production methods to ensure supply stability.
- For instance, a vehicle manufacturer facing supply disruptions of butyl rubber for EV tire production, driven by feedstock price volatility, may strategically partner with a chemical firm that has invested in on-purpose isobutylene technology.
- This move secures a stable supply of high-performance elastomers, ensuring production continuity and mitigating risks associated with dependency on co-product streams from fluid catalytic cracking (fcc) operations, ultimately aligning with circular economy principles and improving supply chain resilience against stringent environmental regulations.
What will be the Size of the 2 Methylpropene Market during the forecast period?
Get Key Insights on Market Forecast (PDF) Get Free Sample
How is the 2 Methylpropene Market Segmented?
The 2 methylpropene industry research report provides comprehensive data (region-wise segment analysis), with forecasts and estimates in "USD million" for the period 2025-2029, as well as historical data from 2019-2023 for the following segments.
- Technology
- Direct oxidation
- Indirect oxidation
- Others
- Application
- Polymerization
- Chemical intermediates
- Additives
- Others
- End-user
- Automotive
- Construction
- Packaging
- Consumer products
- Others
- Geography
- APAC
- China
- India
- Japan
- Europe
- Germany
- France
- UK
- North America
- US
- Canada
- Mexico
- South America
- Brazil
- Argentina
- Colombia
- Middle East and Africa
- Saudi Arabia
- UAE
- South Africa
- Rest of World (ROW)
- APAC
By Technology Insights
The direct oxidation segment is estimated to witness significant growth during the forecast period.
The global 2 methylpropene market is segmented by technology, application, end-user, and geography. By technology, the market is segmented into direct oxidation, indirect oxidation, and others.
The direct oxidation process is crucial for producing oxygenated derivatives synthesis, notably methacrolein and methacrylic acid (mma), a key monomer for acrylic resins. This technology leverages advanced catalytic systems for the selective conversion of 2 methylpropene.
In the application segment which includes polymerization, chemical intermediates, additives, and others, polymerization holds a significant share. This is driven by demand for butyl rubber in tire inner liners and polyisobutylene (pib) in adhesives and sealants.
Key end-users include the automotive sector, which utilizes high-performance elastomers for vehicle components, and the construction industry, which relies on these materials for high-performance coatings and waterproofing membranes, contributing to nearly 48.4% of market expansion.
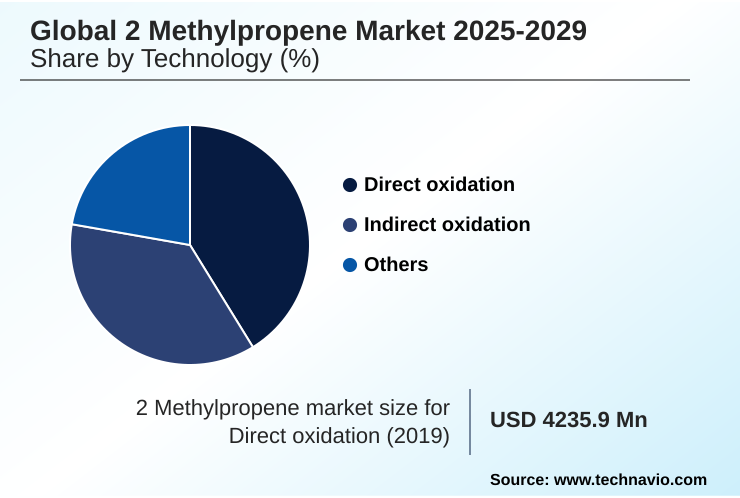
The Direct oxidation segment was valued at USD 4.77 billion in 2023 and showed a gradual increase during the forecast period.
Regional Analysis
APAC is estimated to contribute 48.4% to the growth of the global market during the forecast period.Technavio’s analysts have elaborately explained the regional trends and drivers that shape the market during the forecast period.
See How 2 Methylpropene Market Demand is Rising in APAC Get Free Sample
The geographic landscape of the 2 methylpropene market is led by the APAC region, which accounts for approximately 48.4% of the global incremental growth and exhibits a strong CAGR of 5.7%.
This expansion is driven by the region's robust automotive and construction sectors, which are major consumers of derivatives like butyl rubber and polyisobutylene (pib).
In contrast, mature markets such as Europe and North America show more moderate growth, with CAGRs of 3.9% and 4.1% respectively, focusing on high-value specialty monomers and advanced polymers.
Regional investments in APAC are heavily skewed toward enhancing c4 feedstock valorization, with new facilities targeting a 15% increase in yield from c4 hydrocarbon streams.
This strategy aims to meet the escalating demand for chemical intermediates and support the region's industrial manufacturing base, which includes everything from automotive clear plastics to pharmaceutical stoppers.
Market Dynamics
Our researchers analyzed the data with 2024 as the base year, along with the key drivers, trends, and challenges. A holistic analysis of drivers will help companies refine their marketing strategies to gain a competitive advantage.
- The global 2 methylpropene market's technical landscape is defined by its versatile applications, derived from its unique chemical properties. The synthesis of high-value products such as 2 methylpropene for butyl rubber is fundamental to the automotive industry, particularly for tire manufacturing. Similarly, the use of 2 methylpropene for polyisobutylene is critical in formulating industrial sealants and lubricants.
- The conversion of 2 methylpropene to methacrylic acid provides the monomer for a vast range of acrylic-based products. Production primarily relies on isobutylene from c4 hydrocarbon streams, utilizing advanced c4 stream processing technologies. Key production methods include the direct oxidation of 2 methylpropene and on-purpose production of isobutylene, often through the dehydrogenation of tertiary butyl alcohol.
- The polymerization of 2 methylpropene and its use in alkylation with 2 methylpropene are core chemical transformations. The synthesis of specialty chemicals, including butylated hydroxytoluene from isobutylene and the neopentyl glycol synthesis route, highlights its role as a key building block.
- In supply chain strategy, companies leveraging on-purpose production methods report over 10% greater supply reliability compared to those solely dependent on co-product streams from steam crackers, a critical factor when managing isobutylene feedstock price volatility.
- The ongoing push for bio-based isobutylene production trends is reshaping long-term sourcing strategies, while the demand for high-purity isobutylene in polymers continues to drive process innovation, particularly in isobutylene uses in specialty chemicals and 2 methylpropene in fuel additives.
What are the key market drivers leading to the rise in the adoption of 2 Methylpropene Industry?
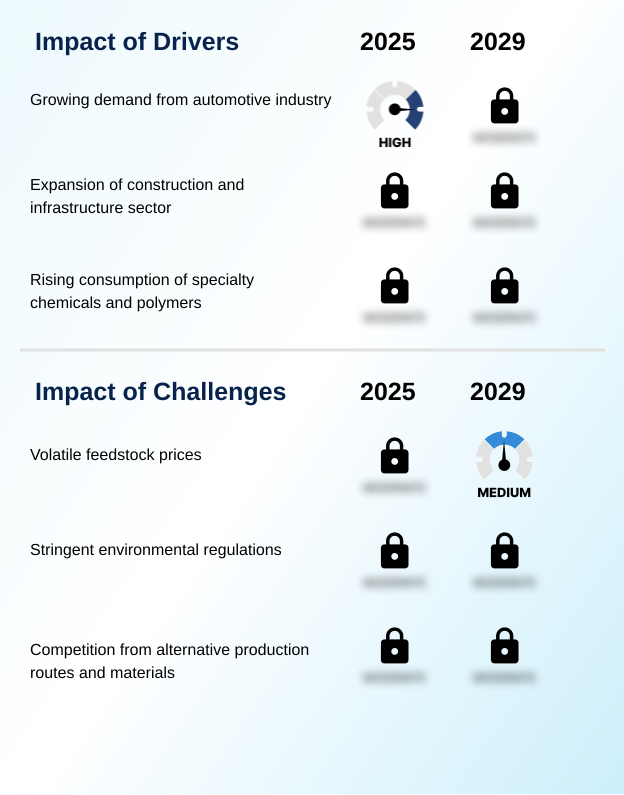
- The growing demand for high-performance components within the global automotive industry serves as a primary driver for the 2-methylpropene market.
- The global 2 methylpropene market is primarily driven by robust demand from key industrial sectors.
- The automotive industry's need for high-performance elastomers, particularly butyl rubber for tire inner liners, is a major factor, as these materials can enhance fuel efficiency by up to 2%.
- This is complemented by the use of polyisobutylene (pib) as a viscosity modifier in fuel and lubricant additives.
- The expanding construction sector is another significant driver, utilizing methacrylic acid (mma) derivatives in high-performance coatings and adhesives and sealants that extend the maintenance cycles of infrastructure by over 20%.
- Furthermore, the rising consumption of specialty chemicals and polymers, including butylated hydroxytoluene (bht) as an antioxidant for food and neopentyl glycol (npg) for polyester resins, underpins the market's growth, reflecting the monomer's versatility across diverse high-value applications.
What are the market trends shaping the 2 Methylpropene Industry?
- A significant trend shaping the market is the increasing emphasis on sustainability and the exploration of bio-based feedstock initiatives. This shift is driven by growing environmental regulations and industry demand for greener chemical production methods.
- Key trends in the 2 methylpropene market are centered on sustainability, electrification, and supply chain optimization. The industry is witnessing a significant push towards sustainable chemical synthesis, with research into bio-based feedstock routes aiming to reduce carbon footprints by over 25%. This aligns with growing demand for environmentally responsible advanced polymers.
- Concurrently, the expansion of the electric vehicle sector is driving innovation in EV battery sealants and lightweighting materials, which rely on high-purity isobutylene. This has amplified the focus on on-purpose production methods to decouple supply from traditional fluid catalytic cracking (fcc) outputs.
- Advancements in c4 stream processing, including new catalytic dehydrogenation technologies, are improving isobutylene yield by up to 10%, enhancing the economic viability of producing chemical intermediates and ensuring a more resilient supply chain amid fluctuating feedstock availability.
What challenges does the 2 Methylpropene Industry face during its growth?
- The inherent volatility of feedstock prices, closely linked to global crude oil and natural gas markets, presents a significant challenge to producers and affects market stability.
- The 2 methylpropene market confronts several challenges that impact stability and growth. The most significant is feedstock price volatility, where fluctuations in crude oil prices can alter production costs by as much as 20% in a single quarter, directly affecting the profitability of producing the synthetic elastomer.
- Additionally, increasingly stringent environmental regulations necessitate substantial capital investment, with compliance costs sometimes reaching 15% of a plant's annual operating budget to upgrade to cleaner technologies like selective adsorption. The threat from alternative production routes and substitute materials also poses a continuous challenge.
- Innovations in synthesizing derivatives from different feedstocks or the development of new polymers with comparable properties require incumbent producers to constantly innovate and demonstrate the cost-performance benefits of isobutylene-based products like high-purity isobutylene for pharmaceutical stoppers.
Exclusive Technavio Analysis on Customer Landscape
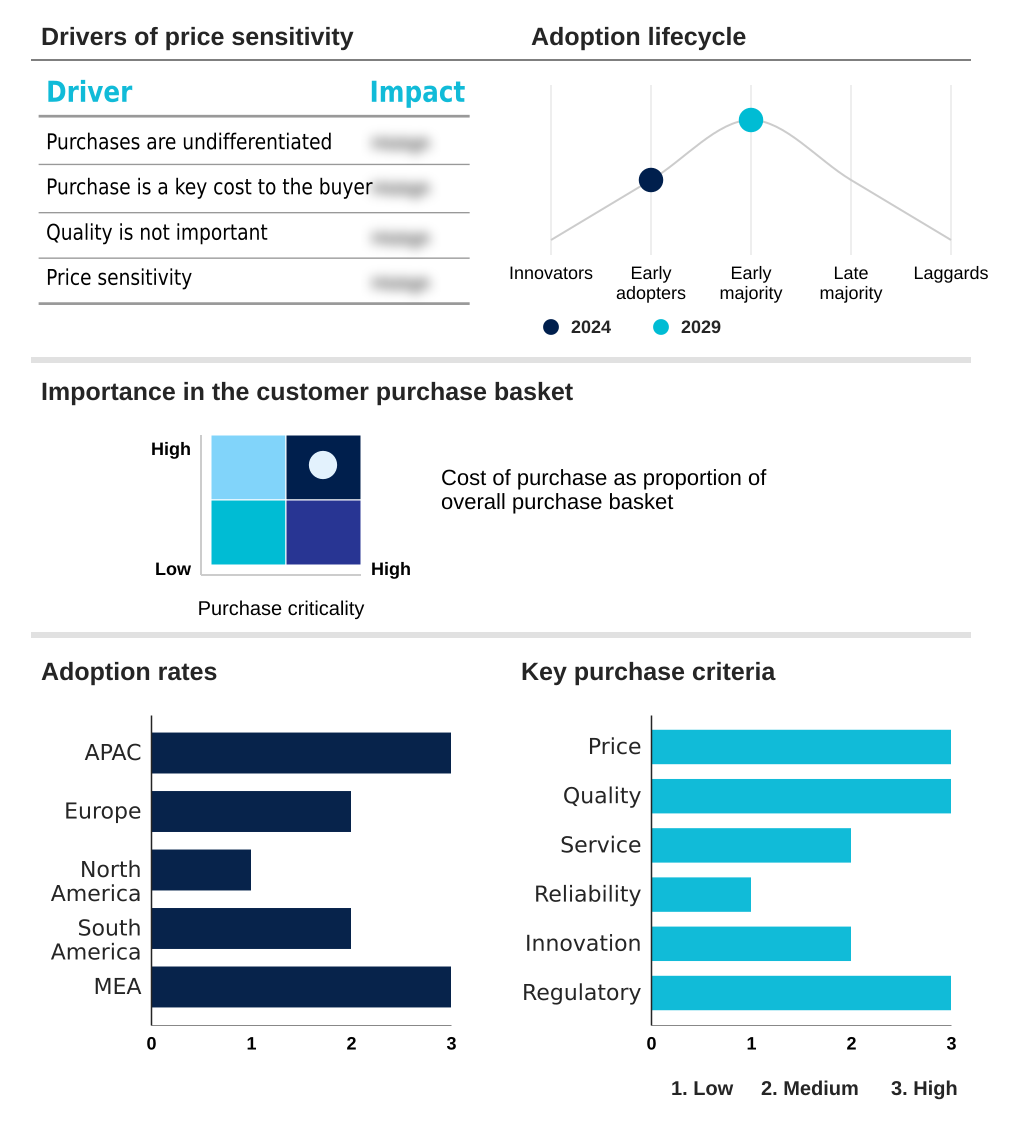
The 2 methylpropene market forecasting report includes the adoption lifecycle of the market, covering from the innovator’s stage to the laggard’s stage. It focuses on adoption rates in different regions based on penetration. Furthermore, the 2 methylpropene market report also includes key purchase criteria and drivers of price sensitivity to help companies evaluate and develop their market growth analysis strategies.
Customer Landscape of 2 Methylpropene Industry
Competitive Landscape
Companies are implementing various strategies, such as strategic alliances, 2 methylpropene market forecast, partnerships, mergers and acquisitions, geographical expansion, and product/service launches, to enhance their presence in the industry.
BASF SE - Technical-grade isobutene from butane cracking serves as a critical input for lubricants, fuel additives, and pharmaceutical intermediates, highlighting its diverse industrial applicability.
The industry research and growth report includes detailed analyses of the competitive landscape of the market and information about key companies, including:
- BASF SE
- Braskem SA
- Chevron Phillips Chemical Co.
- Evonik Industries AG
- Exxon Mobil Corp.
- INEOS Group Holdings S.A.
- Kaneka Corp.
- LyondellBasell Industries NV
- Mitsui Chemicals Inc.
- OMV Aktiengesellschaft
- Saudi Basic Industries
- Shell plc
- SIBUR Holding PJSC
- Sinopec Shanghai Co. Ltd.
- Songwon Industrial Co. Ltd.
- Sumitomo Chemical Co. Ltd.
- TPC Group
- Vinati Organics Ltd.
Qualitative and quantitative analysis of companies has been conducted to help clients understand the wider business environment as well as the strengths and weaknesses of key industry players. Data is qualitatively analyzed to categorize companies as pure play, category-focused, industry-focused, and diversified; it is quantitatively analyzed to categorize companies as dominant, leading, strong, tentative, and weak.
Recent Development and News in 2 methylpropene market
- In September, 2024, BASF SE announced a strategic partnership with a leading biotechnology firm to accelerate the development of bio-based 2-methylpropene, targeting the commercialization of a new fermentation process.
- In November, 2024, Evonik Industries AG introduced a new line of high-purity polyisobutylene (PIB) specifically engineered for advanced EV battery sealants, aiming to improve thermal management and operational safety.
- In January, 2025, LyondellBasell Industries NV completed the acquisition of a specialized C4 processing technology provider to enhance its on-purpose isobutylene production capabilities and secure its supply chain.
- In March, 2025, a consortium including Shell plc and Exxon Mobil Corp. launched a joint initiative to standardize recycling protocols for butyl rubber products, targeting a significant reduction in landfill waste from these materials.
Dive into Technavio’s robust research methodology, blending expert interviews, extensive data synthesis, and validated models for unparalleled 2 Methylpropene Market insights. See full methodology.
| Market Scope | |
|---|---|
| Page number | 319 |
| Base year | 2024 |
| Historic period | 2019-2023 |
| Forecast period | 2025-2029 |
| Growth momentum & CAGR | Accelerate at a CAGR of 4.8% |
| Market growth 2025-2029 | USD 3114.5 million |
| Market structure | Fragmented |
| YoY growth 2024-2025(%) | 4.7% |
| Key countries | China, India, Japan, South Korea, Indonesia, Australia, Germany, France, UK, Italy, Spain, The Netherlands, US, Canada, Mexico, Brazil, Argentina, Colombia, Saudi Arabia, UAE, South Africa, Egypt and Nigeria |
| Competitive landscape | Leading Companies, Market Positioning of Companies, Competitive Strategies, and Industry Risks |
Research Analyst Overview
- The 2 methylpropene market's foundation rests on its role as a critical chemical building block, primarily sourced as a steam cracking co-product from c4 hydrocarbon streams. Its conversion through polymerization process or alkylation reaction into high-performance elastomers like isobutylene-isoprene rubber and additives is essential for multiple industries.
- The market's trajectory is influenced by the demand for butyl rubber and polyisobutylene (pib), which are produced via methods like the tba dehydration process and oxo-d process isobutene. Key derivatives such as methacrylic acid (mma), butylated hydroxytoluene (bht), and neopentyl glycol (npg) are synthesized using direct oxidation process and indirect oxidation technology.
- A pivotal boardroom decision revolves around capital allocation for sustainable manufacturing, weighing investment in advanced catalytic systems against developing capabilities for bio-based isobutylene. Advanced catalytic systems have already demonstrated improvements in selectivity by over 12%, directly impacting production costs for high-reactivity isobutene.
- This decision is critical as the industry shifts from reliance on mtbe cracking processes and butane cracking derivative to more sustainable pathways, including on-purpose production via isobutane dehydrogenation and c4 feedstock valorization through extractive distillation, ensuring a stable supply of this crucial branched alkene chemical.
What are the Key Data Covered in this 2 Methylpropene Market Research and Growth Report?
-
What is the expected growth of the 2 Methylpropene Market between 2025 and 2029?
-
USD 3.11 billion, at a CAGR of 4.8%
-
-
What segmentation does the market report cover?
-
The report is segmented by Technology (Direct oxidation, Indirect oxidation, and Others), Application (Polymerization, Chemical intermediates, Additives, and Others), End-user (Automotive, Construction, Packaging, Consumer products, and Others) and Geography (APAC, Europe, North America, South America, Middle East and Africa)
-
-
Which regions are analyzed in the report?
-
APAC, Europe, North America, South America and Middle East and Africa
-
-
What are the key growth drivers and market challenges?
-
Growing demand from automotive industry, Volatile feedstock prices
-
-
Who are the major players in the 2 Methylpropene Market?
-
BASF SE, Braskem SA, Chevron Phillips Chemical Co., Evonik Industries AG, Exxon Mobil Corp., INEOS Group Holdings S.A., Kaneka Corp., LyondellBasell Industries NV, Mitsui Chemicals Inc., OMV Aktiengesellschaft, Saudi Basic Industries, Shell plc, SIBUR Holding PJSC, Sinopec Shanghai Co. Ltd., Songwon Industrial Co. Ltd., Sumitomo Chemical Co. Ltd., TPC Group and Vinati Organics Ltd.
-
Market Research Insights
- The 2 methylpropene market is shaped by a dynamic interplay between robust industrial demand and significant operational challenges. The market's expansion is heavily influenced by end-use sectors, where applications in high-performance elastomers and polymer stabilizers are critical.
- For instance, in regions contributing to nearly 48% of the market's incremental growth, the demand for lightweighting materials in automotive manufacturing is a key factor. For buyers where the material represents a high-impact cost, process innovations that deliver even a 5-10% improvement in production efficiency are pivotal for maintaining competitive pricing.
- This focus on optimization is essential, as managing feedstock price volatility remains a central issue for producers navigating the complexities of the global chemical supply chain and aiming to deliver value in applications ranging from industrial lubricants to advanced polymers.
We can help! Our analysts can customize this 2 methylpropene market research report to meet your requirements.
 RIA -
RIA - 
