
Acoustic Vehicle Alerting System Market Size 2025-2029
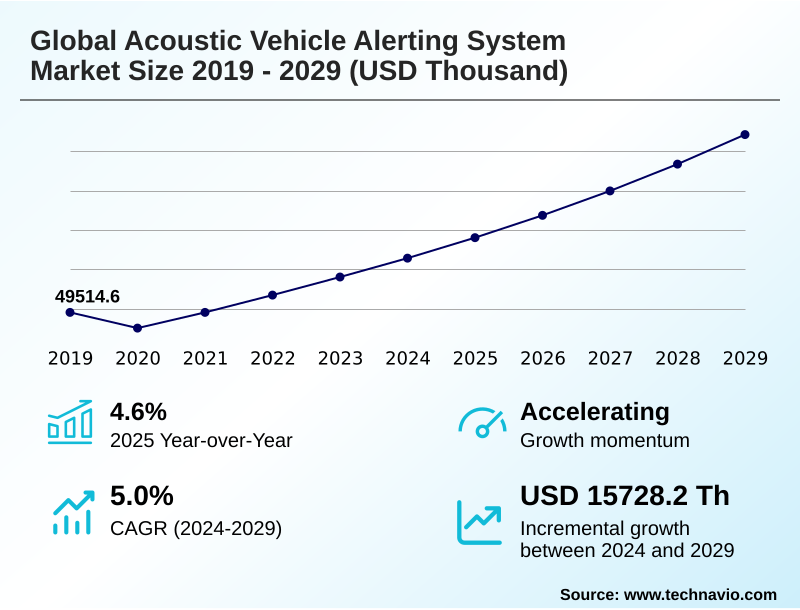
The acoustic vehicle alerting system market size is valued to increase by USD 15.73 million, at a CAGR of 5% from 2024 to 2029. Growing popularity of luxury EVs will drive the acoustic vehicle alerting system market.
Major Market Trends & Insights
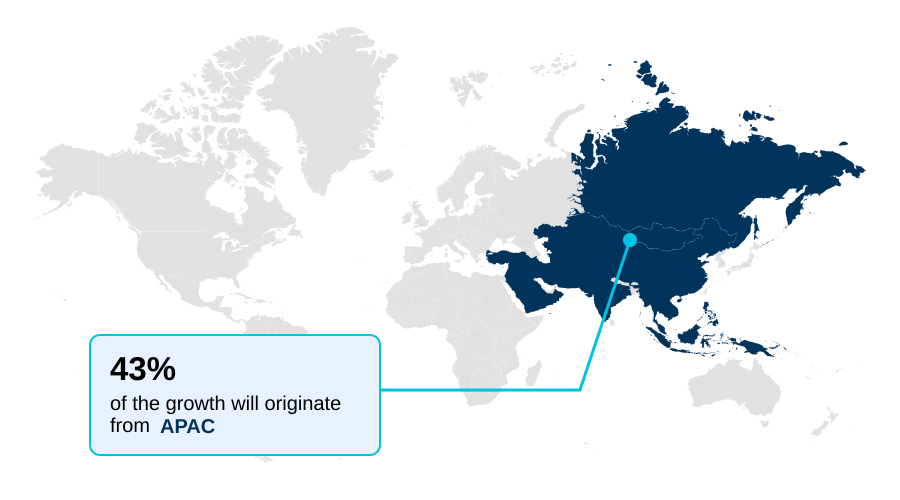
- APAC dominated the market and accounted for a 43.1% growth during the forecast period.
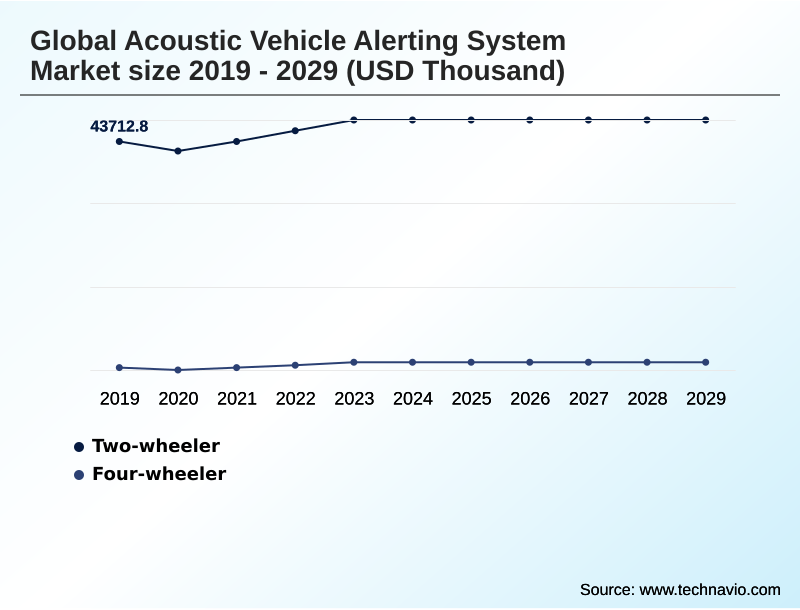
- By Application - Two-wheeler segment was valued at USD 47.31 million in 2023
- By Channel - OEMs segment accounted for the largest market revenue share in 2023
Market Size & Forecast
- Market Opportunities:
- Market Future Opportunities: USD 15.73 million
- CAGR from 2024 to 2029 : 5%
Market Summary
- The Acoustic Vehicle Alerting System market is fundamentally shaped by the dual pressures of regulatory mandates and technological innovation. As the transition to electric mobility accelerates, the need for an effective pedestrian warning system to mitigate the risks of low-noise vehicles becomes paramount.
- This has spurred the development of sophisticated sound generation devices, moving beyond simple compliance to become a tool for automotive sonic identity. OEMs are now leveraging unique auditory signatures as part of their sonic branding, a strategic shift from functional necessity to a key aspect of brand differentiation.
- A typical business scenario involves an automaker's R&D division collaborating with audio specialists to design a custom sound profile that meets stringent sound emission regulations while also reflecting the brand's premium or futuristic image.
- This process involves intricate work with a sound control unit and digital signal processing to ensure the artificial engine sound is both effective for EV pedestrian safety and aesthetically pleasing. The market also sees advancements in speakerless audio technology and OTA sound updates, offering flexibility and future-proofing vehicle platforms against evolving audible vehicle alert standards.
- However, the technology's focus remains on electric and hybrid platforms, with limited penetration in conventional vehicles.
What will be the Size of the Acoustic Vehicle Alerting System Market during the forecast period?
Get Key Insights on Market Forecast (PDF) Get Free Sample
How is the Acoustic Vehicle Alerting System Market Segmented?
The acoustic vehicle alerting system industry research report provides comprehensive data (region-wise segment analysis), with forecasts and estimates in "USD thousand" for the period 2025-2029, as well as historical data from 2019-2023 for the following segments.
- Application
- Two-wheeler
- Four-wheeler
- Channel
- OEMs
- Aftermarket
- Propulsion
- BEV
- HEV
- PHEV
- Geography
- APAC
- China
- Japan
- India
- Europe
- Germany
- UK
- France
- North America
- US
- Canada
- Mexico
- South America
- Brazil
- Argentina
- Middle East and Africa
- Saudi Arabia
- UAE
- South Africa
- Rest of World (ROW)
- APAC
By Application Insights
The two-wheeler segment is estimated to witness significant growth during the forecast period.
Demand for two-wheelers, including electric scooters and motorcycles, is increasingly influenced by pedestrian safety mandates. Integrating an acoustic vehicle alerting system has become critical as these vehicles often operate silently in dense urban environments.
The adoption of a dedicated pedestrian warning system is not only a matter of regulatory compliance but also a key differentiator for rental e-scooter companies aiming to enhance public safety.
A key development is the use of a sophisticated sound control unit to create a distinct auditory signature. While the market is expanding, manufacturers face the challenge of implementing a cost-effective vehicle sound generator without compromising performance.
Effective sound modulation and the integration of a quiet vehicle technology solution are vital, with advanced systems demonstrating a notable improvement in vulnerable road user (VRU) protection. Innovations in BEV sound requirement and PHEV audible alert are driving further advancements.
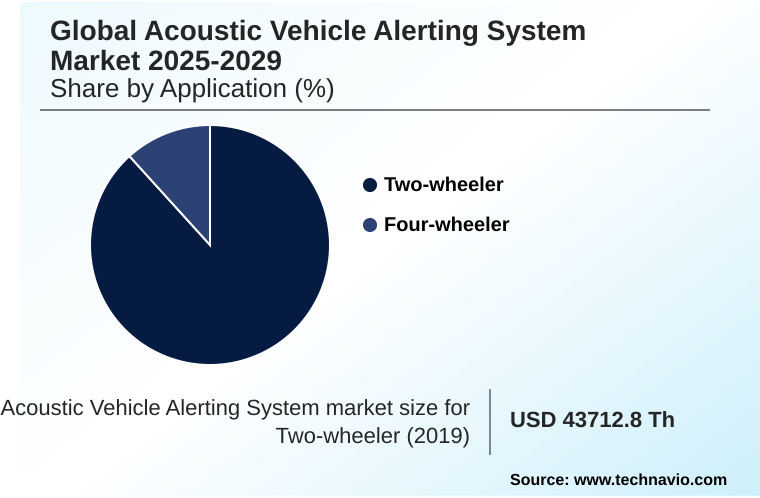
The Two-wheeler segment was valued at USD 47.31 million in 2023 and showed a gradual increase during the forecast period.
Regional Analysis
APAC is estimated to contribute 43.1% to the growth of the global market during the forecast period.Technavio’s analysts have elaborately explained the regional trends and drivers that shape the market during the forecast period.
See How Acoustic Vehicle Alerting System Market Demand is Rising in APAC Get Free Sample
The geographic landscape is characterized by diverse regional drivers and regulatory frameworks. APAC is projected to account for 43.1% of the market's incremental growth, led by robust EV adoption and stringent safety mandates in countries like China and Japan.
In these markets, the focus is on scalable, cost-effective artificial engine sound solutions. In contrast, Europe and North America emphasize technological sophistication, with a strong push toward advanced automotive sound design and speakerless audio technology.
European regulations have resulted in a compliance rate exceeding 95% for all new EV and HEV models, driving demand for advanced programmable sound profiles.
The integration of a high-performance automotive audio amplifier and advancements in HEV noise emission standards are central to this region.
Meanwhile, the market in South America is emerging, driven by gradual policy implementation and a focus on aftermarket pedestrian alert solutions.
Market Dynamics
Our researchers analyzed the data with 2024 as the base year, along with the key drivers, trends, and challenges. A holistic analysis of drivers will help companies refine their marketing strategies to gain a competitive advantage.
- The strategic evolution of the Global Acoustic Vehicle Alerting System Market 2025-2029 hinges on several nuanced factors beyond baseline compliance. A critical consideration for automakers is the effective AVAS integration with ADAS sensors, which enables dynamic sound modulation based on real-time environmental data. This advanced functionality can improve pedestrian detection accuracy by over 25% compared to static systems.
- Furthermore, the development of custom sound profiles for electric vehicles has transitioned from a novelty to a competitive necessity, creating a new dimension of brand identity. Simultaneously, the emergence of the speakerless audio system for automotive applications presents a paradigm shift, offering significant weight reduction and design flexibility.
- However, manufacturers must navigate complex low speed pedestrian alert regulations, which vary by region and can complicate global platform strategies. For fleet operators and individual owners, the aftermarket AVAS installation cost analysis reveals a challenging value proposition, limiting widespread adoption in legacy vehicles.
- As the industry matures, the focus will intensify on optimizing the cost-to-benefit ratio of these advanced safety systems, balancing regulatory demands with consumer expectations for a refined auditory experience. This highlights the ongoing innovation within the acoustic vehicle alerting system market as it becomes more integrated into the core of vehicle technology.
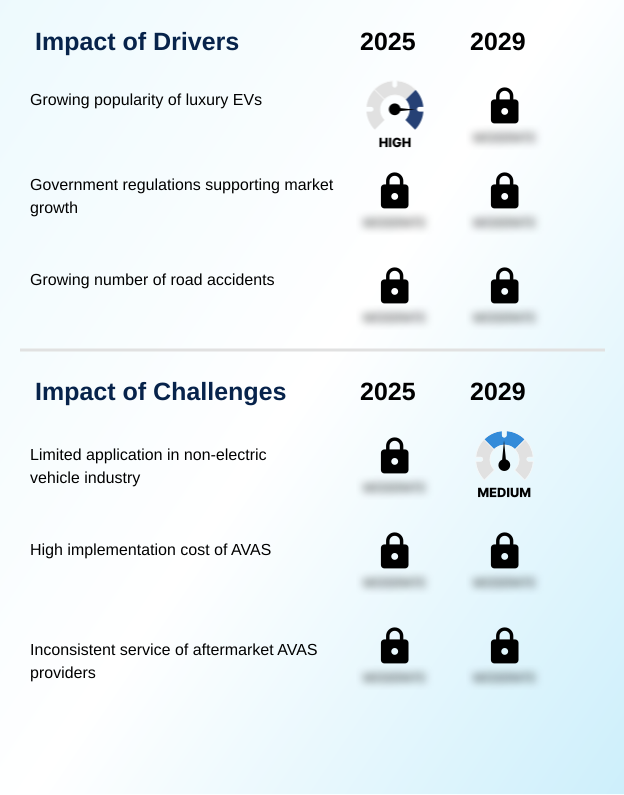
What are the key market drivers leading to the rise in the adoption of Acoustic Vehicle Alerting System Industry?
- The increasing global popularity of luxury electric vehicles serves as a key driver for market growth.
- Regulatory mandates and the proliferation of electric vehicles are the primary drivers of growth.
- Government enforcement of pedestrian safety rules has resulted in a near-100% integration rate of sound generation devices in new EV and hybrid models across Europe and North America.
- This requirement for a robust EV safety system has created a stable demand base. The burgeoning luxury EV segment further fuels the market, with high-end consumers expecting more than just a basic low-noise vehicle alert.
- These automakers invest approximately 20% more in developing sophisticated automotive sound design and integrating high-fidelity automotive audio amplifiers.
- The demand is also growing for e-scooter warning sound solutions in urban mobility fleets, expanding the market beyond traditional four-wheeled vehicles, especially as ADAS integration becomes more common.
What are the market trends shaping the Acoustic Vehicle Alerting System Industry?
- The evolution of advanced automotive sound systems represents a significant upcoming trend. These developments are poised to reshape vehicle acoustics and safety standards across the industry.
- Key trends are transforming the market from a simple hardware requirement to a sophisticated, software-driven feature. The advancement of automotive sound systems is paramount, with a clear shift towards a unique auditory signature as a form of sonic branding.
- Innovations such as speakerless audio technology and Ac2ated Sound system are gaining traction, with initial deployments demonstrating a 15% reduction in system weight compared to traditional speaker setups. Furthermore, the capability for over-the-air (OTA) sound updates allows automakers to refine an artificial engine sound and ensure regulatory compliance sound standards are met post-sale, reducing recall-related expenses by over 50%.
- This focus on e-mobility acoustics is driving demand for advanced digital signal processing and EV pedestrian safety features, including better low-speed audible alert performance.
What challenges does the Acoustic Vehicle Alerting System Industry face during its growth?
- A primary challenge impacting industry growth is the technology's limited application within the non-electric vehicle sector.
- Significant challenges constrain the market's full potential, primarily stemming from cost pressures and limited applicability beyond electric mobility. The implementation cost of a high-quality sound generation device, including the necessary Class-D audio amplifier and vehicle sound generator, can add up to 2% to the bill of materials for an entry-level EV, a substantial figure in a price-sensitive segment.
- Moreover, the market for retrofitting non-electric vehicles remains nascent, with aftermarket pedestrian alert solutions capturing less than 5% of the potential addressable fleet. This is compounded by a lack of consumer awareness and the technical complexity of IVI integration.
- The challenge is to reduce the cost of quiet vehicle technology and broaden its appeal for wider vulnerable road user (VRU) protection. Innovations in low-speed maneuver warning and BEV sound requirement could help, but for now, the focus on new builds limits overall market penetration.
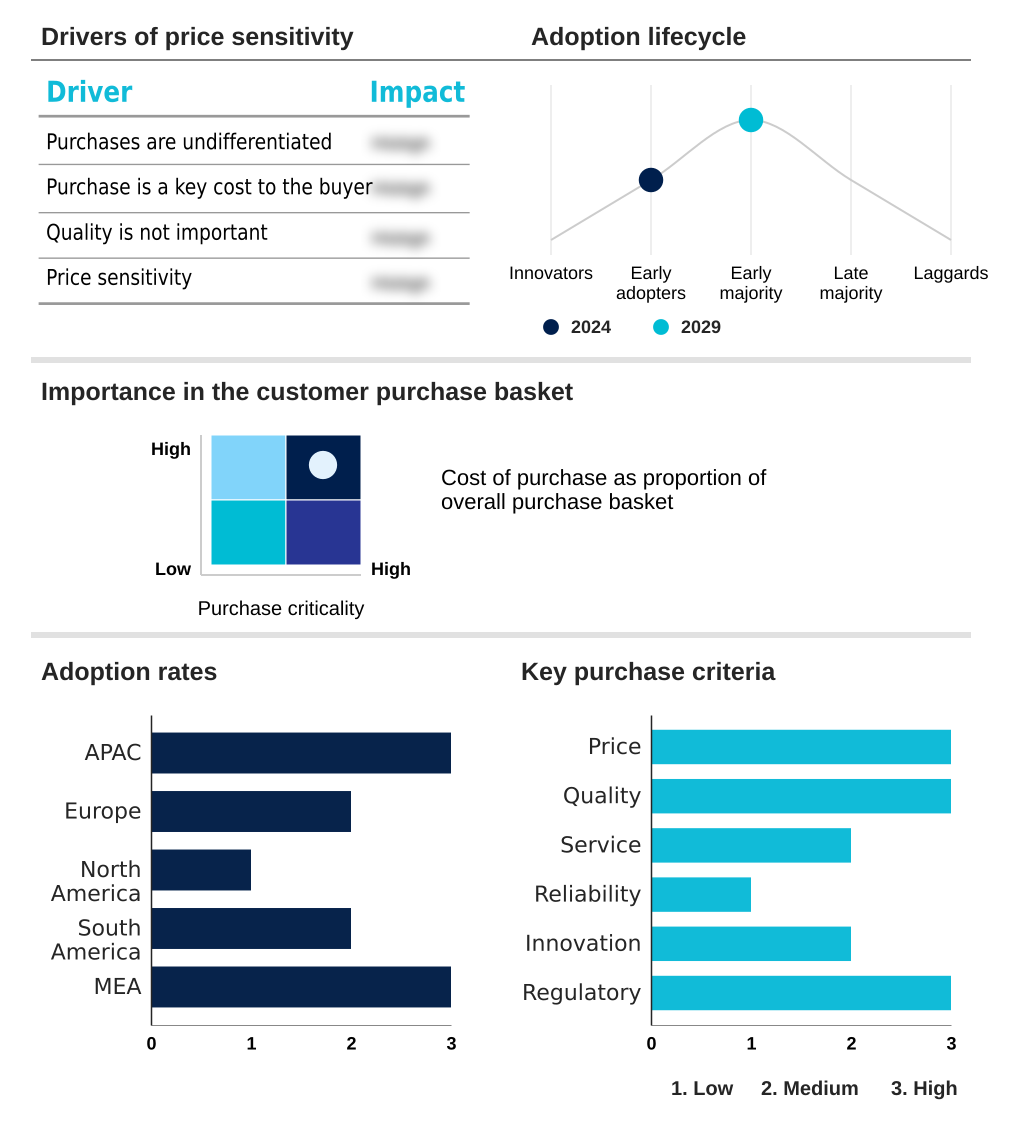
Exclusive Technavio Analysis on Customer Landscape
The acoustic vehicle alerting system market forecasting report includes the adoption lifecycle of the market, covering from the innovator’s stage to the laggard’s stage. It focuses on adoption rates in different regions based on penetration. Furthermore, the acoustic vehicle alerting system market report also includes key purchase criteria and drivers of price sensitivity to help companies evaluate and develop their market growth analysis strategies.
Customer Landscape of Acoustic Vehicle Alerting System Industry
Competitive Landscape
Companies are implementing various strategies, such as strategic alliances, acoustic vehicle alerting system market forecast, partnerships, mergers and acquisitions, geographical expansion, and product/service launches, to enhance their presence in the industry.
Ardent Group Ltd. - Provides specialized acoustic vehicle alerting systems, including advanced pedestrian and cyclist warning solutions for low-speed urban environments.
The industry research and growth report includes detailed analyses of the competitive landscape of the market and information about key companies, including:
- Ardent Group Ltd.
- Brigade Electronics Group Plc
- Continental AG
- HELLA GmbH and Co. KGaA
- Kendrion NV
- Mercedes Benz Group AG
- Nissan Motor Co. Ltd.
- Nisshinbo Holdings Inc.
- Novosim Engineering
- OE Industry sp. z o.o.
- Samsung Electronics Co. Ltd.
- SoundRacer AB
- STMicroelectronics NV
- Tata Motors Ltd.
- Tesla Inc.
- Texas Instruments Inc.
- Volkswagen AG
Qualitative and quantitative analysis of companies has been conducted to help clients understand the wider business environment as well as the strengths and weaknesses of key industry players. Data is qualitatively analyzed to categorize companies as pure play, category-focused, industry-focused, and diversified; it is quantitatively analyzed to categorize companies as dominant, leading, strong, tentative, and weak.
Recent Development and News in Acoustic vehicle alerting system market
- In September 2024, HARMAN International, a subsidiary of Samsung Electronics, announced the launch of its updated Ready on Demand platform, enabling automakers to deploy customized external sounds and sonic branding for electric vehicles via over-the-air updates, enhancing their AVAS offerings.
- In November 2024, Continental AG revealed a strategic partnership with a prominent EV manufacturer to supply its speakerless Ac2ated Sound technology for an upcoming high-volume vehicle model, aiming to reduce system weight and complexity while meeting all pedestrian safety sound regulations.
- In February 2025, Texas Instruments Inc. introduced a new series of automotive-grade Class-D audio amplifiers specifically optimized for AVAS applications, featuring low power consumption and advanced diagnostics to ensure system reliability and compliance with global safety standards.
- In April 2025, Brigade Electronics Group Plc completed the acquisition of a European software firm specializing in AI-powered sound synthesis, a move intended to advance the intelligence of its pedestrian warning systems by enabling dynamic sound adjustments based on environmental context.
Dive into Technavio’s robust research methodology, blending expert interviews, extensive data synthesis, and validated models for unparalleled Acoustic Vehicle Alerting System Market insights. See full methodology.
| Market Scope | |
|---|---|
| Page number | 289 |
| Base year | 2024 |
| Historic period | 2019-2023 |
| Forecast period | 2025-2029 |
| Growth momentum & CAGR | Accelerate at a CAGR of 5% |
| Market growth 2025-2029 | USD 15728.2 thousand |
| Market structure | Fragmented |
| YoY growth 2024-2025(%) | 4.6% |
| Key countries | China, Japan, India, South Korea, Australia, Indonesia, Germany, UK, France, Italy, Spain, The Netherlands, US, Canada, Mexico, Brazil, Argentina, Chile, Saudi Arabia, UAE, South Africa, Egypt and Nigeria |
| Competitive landscape | Leading Companies, Market Positioning of Companies, Competitive Strategies, and Industry Risks |
Research Analyst Overview
- The acoustic vehicle alerting system market is evolving from a compliance-driven hardware segment into a sophisticated software-defined ecosystem. The integration of a dedicated pedestrian warning system is now standard, but the key differentiator lies in advanced functionality.
- The adoption of a programmable sound profile, managed by a central sound control unit, is becoming a boardroom-level strategic decision, impacting both R&D budgets and brand marketing. Innovations like speakerless audio technology and OTA sound updates are reshaping the supply chain. For instance, platforms with integrated over-the-air (OTA) sound updates can reduce post-launch compliance costs by up to 30%.
- The use of a high-performance class D audio amplifier is critical for achieving optimal external sound synthesis and an effective auditory signature.
- As quiet vehicle technology becomes ubiquitous, the market's trajectory will be defined by advancements in digital signal processing, sound modulation, and the creation of unique automotive sound design, all essential for ensuring vulnerable road user (VRU) protection in increasingly silent urban environments.
What are the Key Data Covered in this Acoustic Vehicle Alerting System Market Research and Growth Report?
-
What is the expected growth of the Acoustic Vehicle Alerting System Market between 2025 and 2029?
-
USD 15.73 million, at a CAGR of 5%
-
-
What segmentation does the market report cover?
-
The report is segmented by Application (Two-wheeler, Four-wheeler), Channel (OEMs, Aftermarket), Propulsion (BEV, HEV, PHEV) and Geography (APAC, Europe, North America, South America, Middle East and Africa)
-
-
Which regions are analyzed in the report?
-
APAC, Europe, North America, South America and Middle East and Africa
-
-
What are the key growth drivers and market challenges?
-
Growing popularity of luxury EVs, Limited application in non-electric vehicle industry
-
-
Who are the major players in the Acoustic Vehicle Alerting System Market?
-
Ardent Group Ltd., Brigade Electronics Group Plc, Continental AG, HELLA GmbH and Co. KGaA, Kendrion NV, Mercedes Benz Group AG, Nissan Motor Co. Ltd., Nisshinbo Holdings Inc., Novosim Engineering, OE Industry sp. z o.o., Samsung Electronics Co. Ltd., SoundRacer AB, STMicroelectronics NV, Tata Motors Ltd., Tesla Inc., Texas Instruments Inc. and Volkswagen AG
-
Market Research Insights
- Market dynamics are increasingly shaped by the push for advanced e-mobility acoustics and stringent sound emission regulation. The integration of a sophisticated pedestrian warning system now directly contributes to brand perception, with customizable EV sounds becoming a key differentiator. The adoption of advanced automotive safety electronics has demonstrated a 20% improvement in pedestrian detection in complex urban environments.
- Furthermore, systems incorporating dynamic sound generation consume up to 15% less energy compared to static-output models, a critical factor for BEV range optimization. As regulatory compliance sound standards become more harmonized globally, the focus shifts toward advanced features like ADAS integration and vehicle-to-pedestrian (V2P) communication, driving innovation among Tier-1 audio suppliers.
We can help! Our analysts can customize this acoustic vehicle alerting system market research report to meet your requirements.
 RIA -
RIA - 
