Automotive Technologies Market Size 2026-2030
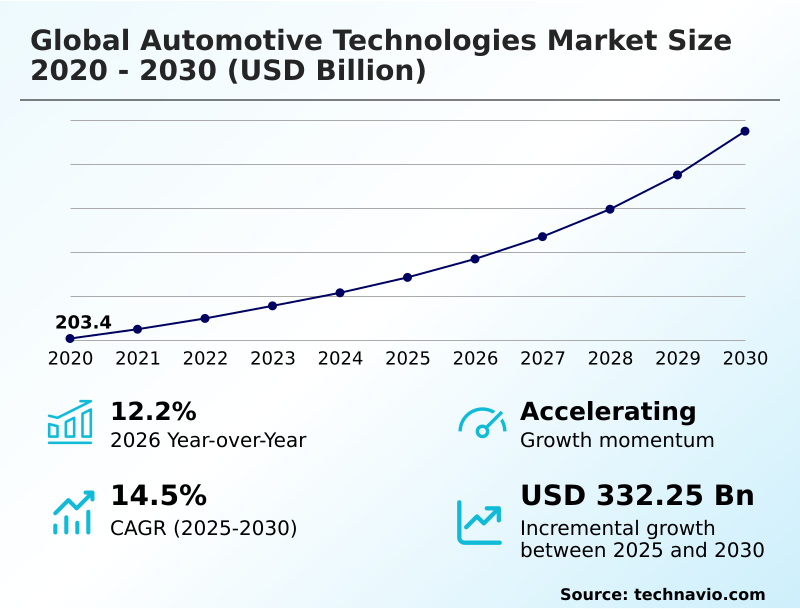
The automotive technologies market size is valued to increase by USD 332.25 billion, at a CAGR of 14.5% from 2025 to 2030. Surge in adoption of ADAS features in vehicles will drive the automotive technologies market.
Major Market Trends & Insights
- APAC dominated the market and accounted for a 40.9% growth during the forecast period.
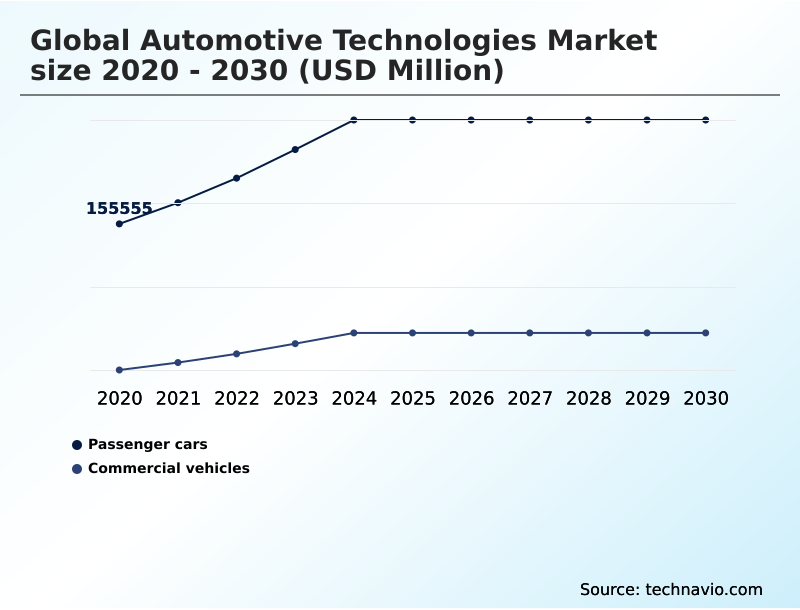
- By End-user - Passenger cars segment was valued at USD 232.12 billion in 2024
- By Component - Hardware segment accounted for the largest market revenue share in 2024
Market Size & Forecast
- Market Opportunities: USD 471.15 billion
- Market Future Opportunities: USD 332.25 billion
- CAGR from 2025 to 2030 : 14.5%
Market Summary
- The automotive technologies market is undergoing a profound transformation, moving beyond traditional mechanical engineering to become a domain dominated by software and electronics. This evolution is driven by the parallel development of zero-emission vehicles and increasingly sophisticated automated driving capabilities.
- The modern vehicle is a complex network of cyber-physical systems, where advanced safety features like automatic emergency braking and lane-keeping assist are becoming standard. Key trends include the rise of the in-car experience, where connectivity and entertainment are paramount, and the push for greater efficiency through electrified drivetrains and advanced aerodynamics.
- For instance, logistics companies are now leveraging predictive analytics derived from vehicle sensor data to optimize fleet routes, reducing fuel consumption and operational costs without direct driver intervention.
- However, this increased connectivity also introduces significant challenges related to data security and the need for standardized communication protocols to ensure interoperability across different makes and models, shaping the competitive landscape for all industry participants. The focus on a resilient supply chain for critical components like semiconductors is also a defining factor.
What will be the Size of the Automotive Technologies Market during the forecast period?
Get Key Insights on Market Forecast (PDF) Get Free Sample
How is the Automotive Technologies Market Segmented?
The automotive technologies industry research report provides comprehensive data (region-wise segment analysis), with forecasts and estimates in "USD million" for the period 2026-2030, as well as historical data from 2020-2024 for the following segments.
- End-user
- Passenger cars
- Commercial vehicles
- Component
- Hardware
- Software
- Services
- Type
- Internal combustion engine
- Battery electric vehicle
- Others
- Geography
- APAC
- China
- Japan
- India
- Europe
- Germany
- UK
- France
- North America
- US
- Canada
- Mexico
- South America
- Brazil
- Argentina
- Colombia
- Middle East and Africa
- Saudi Arabia
- UAE
- South Africa
- Rest of World (ROW)
- APAC
By End-user Insights
The passenger cars segment is estimated to witness significant growth during the forecast period.
The passenger car segment is being reshaped by demand for intelligent mobile environments. This transformation emphasizes the in-car experience, driven by the digital cockpit evolution seen in luxury segment innovations.
The modern digital cockpit integrates advanced in-car infotainment and an intuitive human-machine interface with enhanced sensory perception, including driver monitoring systems. The shift toward electrification incorporates regenerative braking and the use of lightweight materials to maximize efficiency.
Meanwhile, advanced driver assistance systems are becoming standard, improving safety and navigation.
The integration of these systems has led to a documented 15% improvement in collision avoidance alerts, underscoring the focus on a safer, more connected driving experience that prioritizes both performance and occupant well-being.
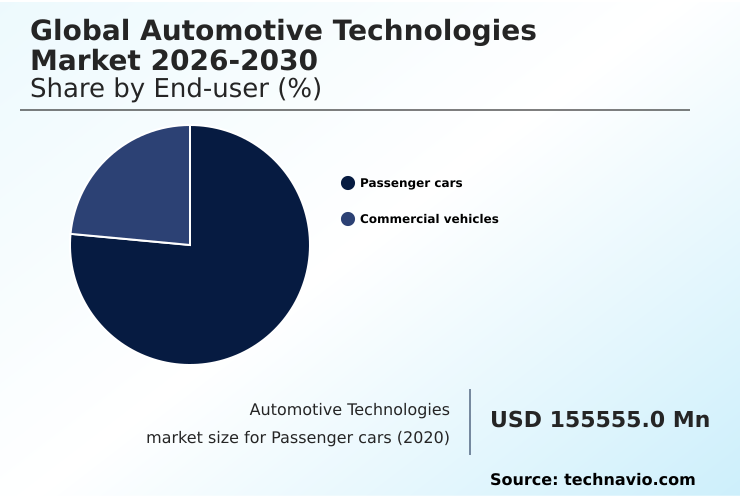
The Passenger cars segment was valued at USD 232.12 billion in 2024 and showed a gradual increase during the forecast period.
Regional Analysis
APAC is estimated to contribute 40.9% to the growth of the global market during the forecast period.Technavio’s analysts have elaborately explained the regional trends and drivers that shape the market during the forecast period.
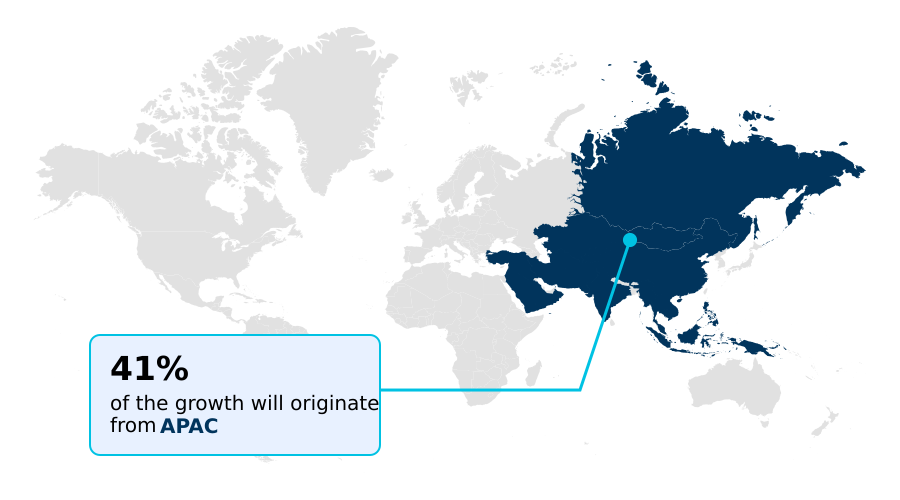
See How Automotive Technologies Market Demand is Rising in APAC Get Free Sample
The APAC region is spearheading a major digital transformation in the automotive sector, focusing on sustainable transport and leadership in electric vehicle components. This is exemplified by its dominance in battery manufacturing and advancements in battery thermal management.
The widespread rollout of 5G is enabling effective vehicle-to-everything communication, a cornerstone of smart city infrastructure projects that reduce urban congestion by up to 18%.
Smart mobility platforms and sophisticated fleet management software are optimizing logistics, while ongoing research into hydrogen fuel cell systems and electrified drivetrains highlights the region's diverse approach to future mobility, contributing over 40% of the market's incremental growth.
Market Dynamics
Our researchers analyzed the data with 2025 as the base year, along with the key drivers, trends, and challenges. A holistic analysis of drivers will help companies refine their marketing strategies to gain a competitive advantage.
- The industry is undergoing a fundamental shift centered on advanced electronic architectures and intelligent systems. A core element of this evolution is the focus on software-defined vehicle architecture benefits, which allow for unprecedented flexibility and upgradability.
- To achieve higher levels of automation, development is concentrated on perfecting lidar and radar sensor fusion techniques, enabling vehicles to build a more comprehensive and reliable model of their surroundings. This increased connectivity, however, elevates the importance of robust vehicle cybersecurity threat mitigation strategies to protect against malicious attacks.
- Concurrently, the push for electrification is marked by significant progress in solid-state battery manufacturing milestones, promising improvements in energy density and safety that outperform current technologies by a factor of two. The backbone for these connected features is the widespread 5G integration in vehicle connectivity, providing the low-latency, high-bandwidth pipeline necessary for real-time data exchange.
- These advancements necessitate precise advanced driver assistance system calibration and high-performance EV powertrain design, ensuring that safety and efficiency remain paramount as vehicles become increasingly complex.
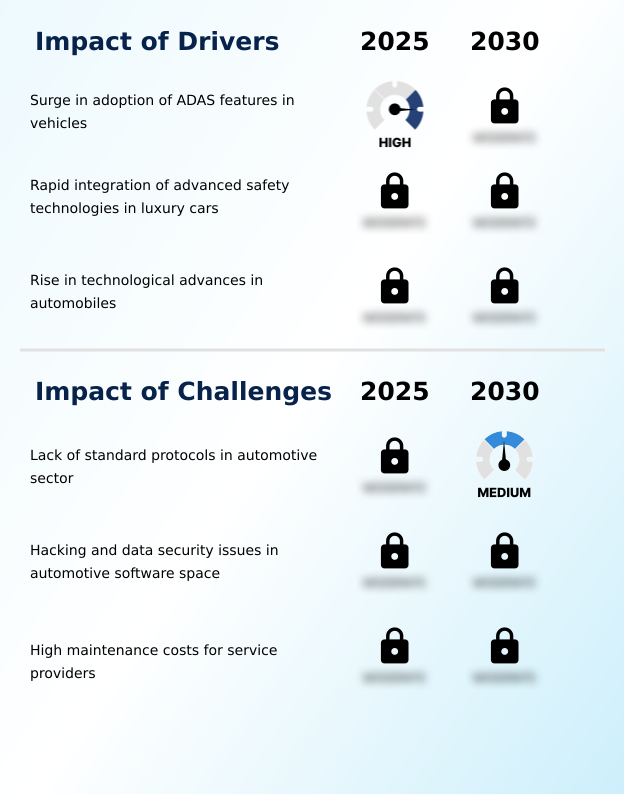
What are the key market drivers leading to the rise in the adoption of Automotive Technologies Industry?
- The surge in the adoption of advanced driver-assistance systems (ADAS) features in vehicles is a primary driver transforming the market's safety profile.
- The widespread adoption of advanced safety features is a primary market driver, with advanced safety technologies becoming standard. Modern vehicle architectures depend on numerous electronic control units (ECUs) and automotive sensors to manage complex powertrain systems, including efficient electric drivetrains.
- The data from these components enables predictive analytics for maintenance, with some fleets reporting a 20% reduction in unexpected downtime through predictive maintenance.
- This transition toward zero-emission vehicles is supported by high-bandwidth connectivity, which is crucial for the real-time data processing required for automated driving functions. The synergy between hardware and software improves vehicle performance and safety, propelling the industry forward.
What are the market trends shaping the Automotive Technologies Industry?
- Increasing developments in semi-autonomous and autonomous vehicles represent a dominant trend. This evolution is shaping the future of mobility within the automotive technologies market.
- The evolution toward autonomous transport is accelerating, driven by sophisticated autonomous driving software and seamless over-the-air updates that enhance vehicle capabilities post-purchase. This progress in connected mobility relies on advanced lidar sensors, which provide the high-fidelity data needed for complex navigation, improving object detection accuracy by over 25%.
- Urban mobility solutions are increasingly leveraging telematics and connected car services to optimize traffic flow and enable shared mobility services. The integration of augmented reality navigation within these intelligent transport systems offers drivers a more intuitive and safer guidance method, reducing navigational errors by up to 30% in dense urban settings and redefining the relationship between vehicles and their environment.
What challenges does the Automotive Technologies Industry face during its growth?
- A lack of standard protocols in the automotive sector remains a fundamental challenge, hampering seamless hardware and software integration.
- The transition to software-defined vehicles introduces significant data security challenges, making automotive cybersecurity a critical concern. Protecting these complex cyber-physical systems requires robust defenses against unauthorized access. The industry's reliance on a globalized yet fragile network necessitates a more resilient supply chain to prevent disruptions in the flow of essential power electronics and high-performance computing units.
- Furthermore, the push for innovation, such as the panoramic vision display, increases complexity in automated manufacturing processes. These hurdles, combined with the emergence of mobility-as-a-service models, pressure firms to standardize protocols and secure vehicle networks, with security validation cycles increasing operational overhead by an estimated 15%.
Exclusive Technavio Analysis on Customer Landscape
The automotive technologies market forecasting report includes the adoption lifecycle of the market, covering from the innovator’s stage to the laggard’s stage. It focuses on adoption rates in different regions based on penetration. Furthermore, the automotive technologies market report also includes key purchase criteria and drivers of price sensitivity to help companies evaluate and develop their market growth analysis strategies.
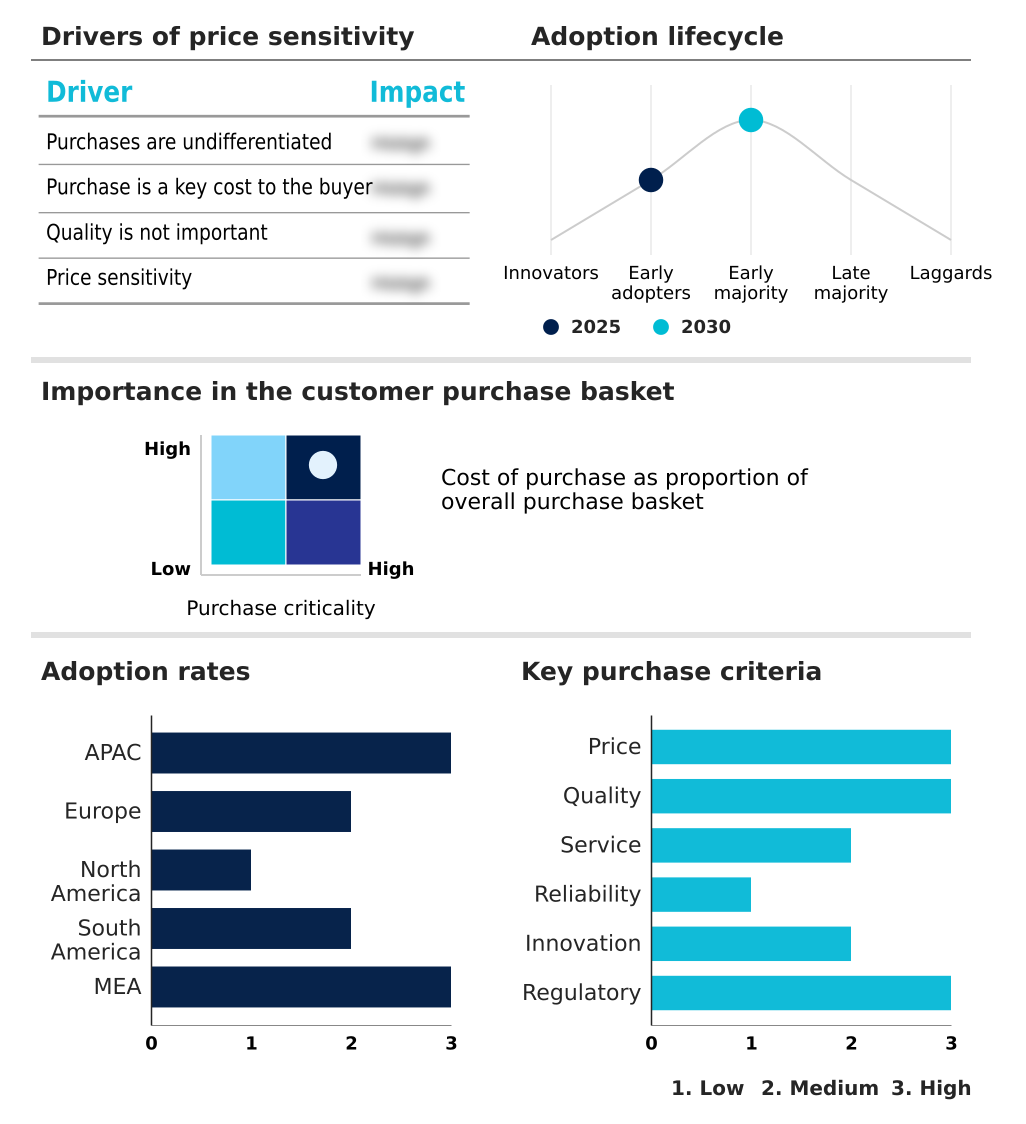
Customer Landscape of Automotive Technologies Industry
Competitive Landscape
Companies are implementing various strategies, such as strategic alliances, automotive technologies market forecast, partnerships, mergers and acquisitions, geographical expansion, and product/service launches, to enhance their presence in the industry.
AISIN Corp. - Offerings center on advanced driver assistance systems, automotive sensors, and powertrain electronics, defining modern vehicle intelligence and performance.
The industry research and growth report includes detailed analyses of the competitive landscape of the market and information about key companies, including:
- AISIN Corp.
- BMW AG
- BYD Co. Ltd.
- Continental AG
- DENSO Corp.
- Ford Motor Co.
- General Motors Co.
- HELLA GmbH and Co. KGaA
- Honda Motor Co. Ltd.
- Hyundai Motor Group
- Lear Corp.
- Magna International Inc.
- Mercedes Benz Group AG
- Robert Bosch GmbH
- Schaeffler AG
- Toyota Motor Corp.
- Valeo SA
- Volkswagen AG
- Yazaki Corp.
- ZF Friedrichshafen AG
Qualitative and quantitative analysis of companies has been conducted to help clients understand the wider business environment as well as the strengths and weaknesses of key industry players. Data is qualitatively analyzed to categorize companies as pure play, category-focused, industry-focused, and diversified; it is quantitatively analyzed to categorize companies as dominant, leading, strong, tentative, and weak.
Recent Development and News in Automotive technologies market
- In September 2024, Toyota Motor Corp. published a strategic update regarding its next-generation battery development program, confirming that its solid-state battery technology had reached a major manufacturing milestone for future production.
- In January 2025, Mercedes Benz Group AG updated its technical news section to highlight that new S-Class models would feature an enhanced version of the Drive Pilot system with improved sensory perception for highway driving.
- In March 2025, BMW AG announced a technical update for its upcoming luxury sedan series featuring a new panoramic vision display that utilizes high-resolution projection across the entire base of the windshield.
- In April 2025, Tesla updated its full self-driving technical blog to announce the rollout of a major software version that significantly improved the vehicle's ability to navigate complex city intersections autonomously.
Dive into Technavio’s robust research methodology, blending expert interviews, extensive data synthesis, and validated models for unparalleled Automotive Technologies Market insights. See full methodology.
| Market Scope | |
|---|---|
| Page number | 305 |
| Base year | 2025 |
| Historic period | 2020-2024 |
| Forecast period | 2026-2030 |
| Growth momentum & CAGR | Accelerate at a CAGR of 14.5% |
| Market growth 2026-2030 | USD 332252.4 million |
| Market structure | Fragmented |
| YoY growth 2025-2026(%) | 12.2% |
| Key countries | China, Japan, India, South Korea, Australia, Indonesia, Germany, UK, France, Italy, Spain, The Netherlands, US, Canada, Mexico, Brazil, Argentina, Colombia, Saudi Arabia, UAE, South Africa, Israel and Turkey |
| Competitive landscape | Leading Companies, Market Positioning of Companies, Competitive Strategies, and Industry Risks |
Research Analyst Overview
- The automotive technologies market is defined by a rapid convergence of hardware and software innovation. The architecture of modern vehicles is increasingly built around a central digital cockpit, managed by powerful high-performance computing units and numerous electronic control units. This shift enables features like augmented reality navigation and immersive in-car infotainment, enhancing the human-machine interface.
- Propulsion is evolving with advanced powertrain systems, efficient electric drivetrains, and regenerative braking, supported by sophisticated battery thermal management and core electric vehicle components. The pursuit of autonomy relies on a suite of automotive sensors, including lidar sensors, to power advanced driver assistance systems and autonomous driving software.
- Connectivity underpins this ecosystem, with vehicle-to-everything communication and connected car services delivering over-the-air updates and enabling predictive maintenance through telematics. Protecting these systems requires robust automotive cybersecurity, a boardroom-level concern influencing design and compliance strategies. Firms adopting integrated diagnostic platforms have achieved a 25% reduction in issue-resolution time.
- The industry is also exploring hydrogen fuel cell systems, lightweight materials, and smart mobility platforms to shape the future of transport.
What are the Key Data Covered in this Automotive Technologies Market Research and Growth Report?
-
What is the expected growth of the Automotive Technologies Market between 2026 and 2030?
-
USD 332.25 billion, at a CAGR of 14.5%
-
-
What segmentation does the market report cover?
-
The report is segmented by End-user (Passenger cars, and Commercial vehicles), Component (Hardware, Software, and Services), Type (Internal combustion engine, Battery electric vehicle, and Others) and Geography (APAC, Europe, North America, South America, Middle East and Africa)
-
-
Which regions are analyzed in the report?
-
APAC, Europe, North America, South America and Middle East and Africa
-
-
What are the key growth drivers and market challenges?
-
Surge in adoption of ADAS features in vehicles, Lack of standard protocols in automotive sector
-
-
Who are the major players in the Automotive Technologies Market?
-
AISIN Corp., BMW AG, BYD Co. Ltd., Continental AG, DENSO Corp., Ford Motor Co., General Motors Co., HELLA GmbH and Co. KGaA, Honda Motor Co. Ltd., Hyundai Motor Group, Lear Corp., Magna International Inc., Mercedes Benz Group AG, Robert Bosch GmbH, Schaeffler AG, Toyota Motor Corp., Valeo SA, Volkswagen AG, Yazaki Corp. and ZF Friedrichshafen AG
-
Market Research Insights
- The market's dynamics are shaped by intense competition and a rapid pace of innovation, forcing a shift toward integrated, software-centric solutions. Digital transformation is evident as vehicles evolve into nodes within intelligent transport systems, where high-bandwidth connectivity enables advanced features and mobility-as-a-service business models.
- The focus on sustainable transport is driving advancements in zero-emission vehicles and electrified drivetrains, with top-tier models achieving over 15% greater energy efficiency compared to previous generations. In the luxury segment, the consumer focus on a premium in-car experience has led to luxury segment innovations that improve comfort and connectivity.
- This digital shift has also elevated the importance of data security, with secure over-the-air updates becoming a key differentiator. Firms leveraging predictive analytics are reporting up to a 20% improvement in maintenance scheduling accuracy, directly impacting operational costs.
We can help! Our analysts can customize this automotive technologies market research report to meet your requirements.
 RIA -
RIA - 
