Advanced Energy Market Analysis APAC, Europe, North America, South America, Middle East and Africa - US, China, Germany, France, Japan - Size and Forecast 2024-2028

Advanced Energy Market Analysis APAC, Europe, North America, South America, Middle East and Africa - US, China, Germany, France, Japan - Size and Forecast 2024-2028

Published: Jul 2024 166 Pages SKU: IRTNTR75575

Market Overview at a Glance

$36.3 B
Market Opportunity
4.25%
CAGR
4.08
YoY growth 2023-2024(%)

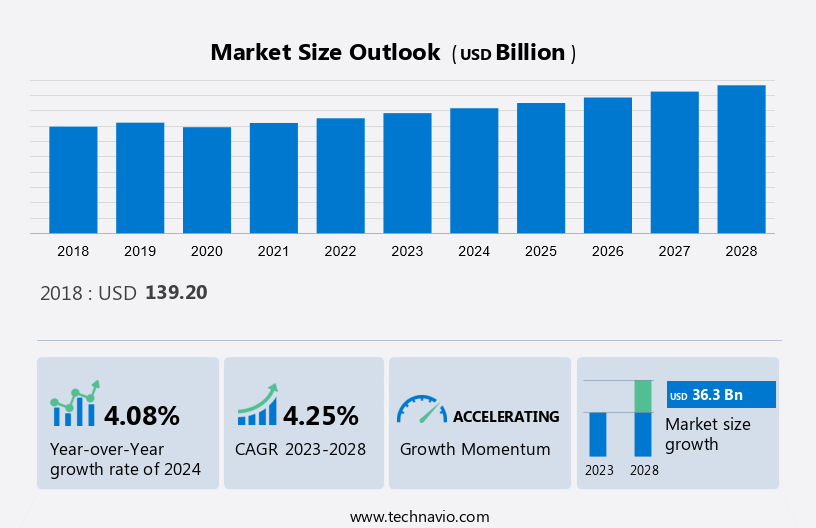
Advanced Energy Market Size 2024-2028

The advanced energy market size is estimated to grow by USD 36.3 billion at a CAGR of 4.25% between 2023 and 2028.  Advanced energy markets are experiencing significant growth due to various factors. Firstly, substantial investments are being made in the development and implementation of clean energy technologies. Secondly, innovative advancements in energy technologies, such as energy storage solutions and renewable energy sources, are driving market expansion. Lastly, increasing government support through incentives and regulations is fostering a favorable environment for the growth of advanced energy markets. These factors are collectively propelling the market forward, ensuring its continued development and progress.

Advanced Energy Market Size

To learn more about this report, View Report Sample

Advanced Energy Market Trends 

A significant trend in the Advanced energy market is the rise of zero-energy buildings (ZEBs). Especially in the residential sector, a substantial portion of electricity, notably in Europe, is consumed for heating. The construction industry is implementing energy-efficient measures such as improved designs and materials to reduce greenhouse gas emissions and fossil fuel energy usage while promoting health and productivity.

ZEBs generate their energy from renewables like solar PV, fuel cells, and energy storage technologies. Supported by interior design strategies, these buildings reduce electricity consumption, aligning with low-carbon energy systems. Government legislation and directives are driving the practical implementation of ZEB concepts in some countries. The increasing adoption of ZEBs is expected to boost the utilization of solar PV systems, driving market growth in the forecast period.

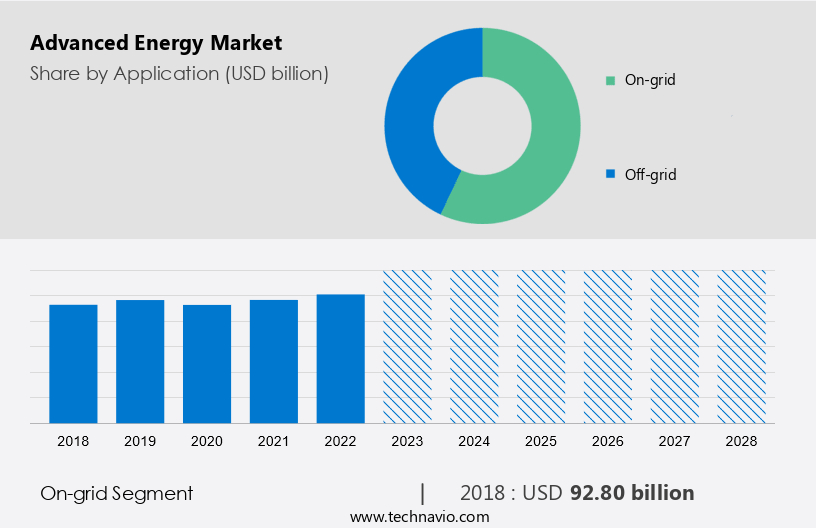
Largest-Growing Segments 

Application Analysis

The market share growth by the On-grid segment will be significant during the market forecast period. The global advanced energy market by application can be segmented into various categories, one of which is the on-grid segment. The advancement of on-grid technologies will primarily focus on coordination between Renewable Energy, efficient energy use, and the Smart Grid. The major driver for the growth of the on-grid segment is the growing adoption of the smart grid and the integration of various clean energy such as solar and wind and technologies, including storage systems.

Advanced Energy Market Size

Get a glance at the market contribution of various segments View the PDF Sample

The growth rate of the on-grid segment has been driven by lower costs for solar PV plants and high levels of Government support, which have made it more feasible to install solar PV systems in a public utility or residential sector. On-grid installation in the residential sector is also expected to drive the growth of the segment during the forecast period. 

Advanced Energy Market Regional Analysis

Advanced Energy Market Share by Geography

For more insights on the market share of various regions Download PDF Sample now!

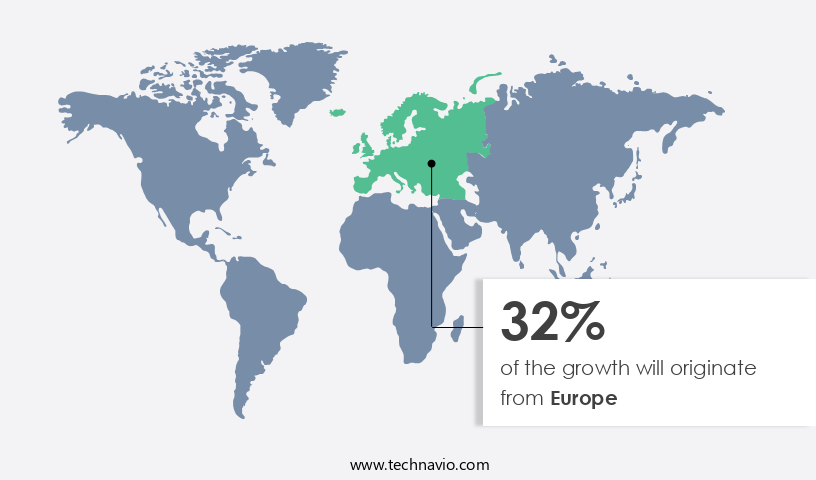
Europe is estimated to contribute 32% to the growth of the global market during the market forecasting period. Technavio’s analysts have elaborately explained the regional trends and drivers that shape the market during the forecast period. The region held the major share of the market in 2023. Another region offering significant growth is APCA. The market in APAC will grow significantly during the forecast period. In 2020, the major leading countries in the region were China, Japan, India, Australia, and South Korea. The major growth of the market in APAC is due to financial incentive programs such as subsidies in China, India, and other countries in the region.

Advanced Energy Market Dynamics

The advanced energy market is witnessing significant growth due to the increasing focus on reducing greenhouse gas emissions and the shift towards renewable energy sources. Natural gas, particularly Renewable Natural Gas (RNG) derived from methane sources, is gaining popularity as a cleaner alternative to coal and oil for power generation and as a transportation fuel. The global supply and demand dynamics of natural gas are being influenced by various factors, including LNG imports, mergers and acquisitions among integrated energy firms, pipeline operators, storage facilities, and local distribution companies. Energy efficiency programs and the adoption of renewable energy sources are also driving the market growth. Green hydrogen production through renewable energy sources is expected to play a crucial role in the future of the energy sector. The use of carbon capture technology is another promising area that can help reduce carbon emissions from traditional energy sources. The residential and commercial sectors are expected to be the major consumers of advanced energy solutions, with a focus on reducing energy consumption and carbon footprint. Overall, the advanced energy market is poised for robust growth in the coming years, driven by the need to address climate change and the increasing demand for cleaner energy solutions.

Key Market Driver

The increasing investments in clean energy technologies are notably driving the market growth analysis. Nearly half of the electricity consumed is provided to commercial and residential buildings across the U.S. One of the main electricity users is the residential sector. Similarly, in Europe, a large part of electricity is consumed for heating purposes in the residential sector. The construction industry is adopting multiple energy efficiency measures, including improved designs and materials that promote a healthy and productive environment, minimize the issues associated with GHG emissions, and reduce fossil fuel-based energy consumption. The concept of ZEBs is an energy-efficient technology where the building generates its own power from renewable sources. To prevent leaks of heating and cooling, ZEBs are built and equipped with the use of specific materials like well-insulated building structures in order to ensure that construction efficiency is increased.

however, To generate the power required by buildings, renewable energy sources such as solar PVs, fuel cells, and energy storage technologies are used. The power required by buildings is generated using low-carbon energy systems, and the interior design mechanism of the building supports reducing the amount of power consumed. The major advantages of ZEBs are on-site renewable energy production and energy efficiency.  In order to achieve a cleaner and greener future, ZEBs are using synergies between these two factors for the purpose of producing emissions less energy. Therefore, these ZEBs help level the peak energy demand by providing clean energy back to the grid. The use of solar PV will increase as more ZEBs become available, which is forecast to fuel the market growth over the coming years.

Major Market Challenge

The lack of standardization is the major challenge faced by the energy market.  As a result of the lack of standardization within the grid system, there is an increased gap between power systems' interoperability. A wide range of advanced energy systems and technologies, such as energy storage that is embedded in the main server, are part of smart grids. The deployment of systems that are interoperable has not yet been completed by utilities. Thus, the implementation of security standards within diverse networking systems is a serious challenge faced by utilities. Authorities can resolve this complexity by enforcing standardized security practices, which can be applied to utilities.

There are technologies that promise various levels of performance, security, cost, and development by adhering to different standards, such as the standards developing organizations, industry user group standards, and proprietary standards.  The resulting divergence in standards results in a significant mismatch of system compatibilities that constitutes an obstacle to the deployment of advanced energy technology, thereby affecting the smooth and secure functioning of the Energy System. Thus, a lack of standardization is expected to hinder the growth of the market during the market research and growth period.

Market Customer Landscape

The market research report includes the adoption lifecycle of the market, covering from the innovator’s stage to the laggard’s stage. It focuses on adoption rates in different regions based on penetration. Furthermore, the report also includes key purchase criteria and drivers of price sensitivity to help companies evaluate and develop their growth strategies.

Advanced Energy Market Share by Geography

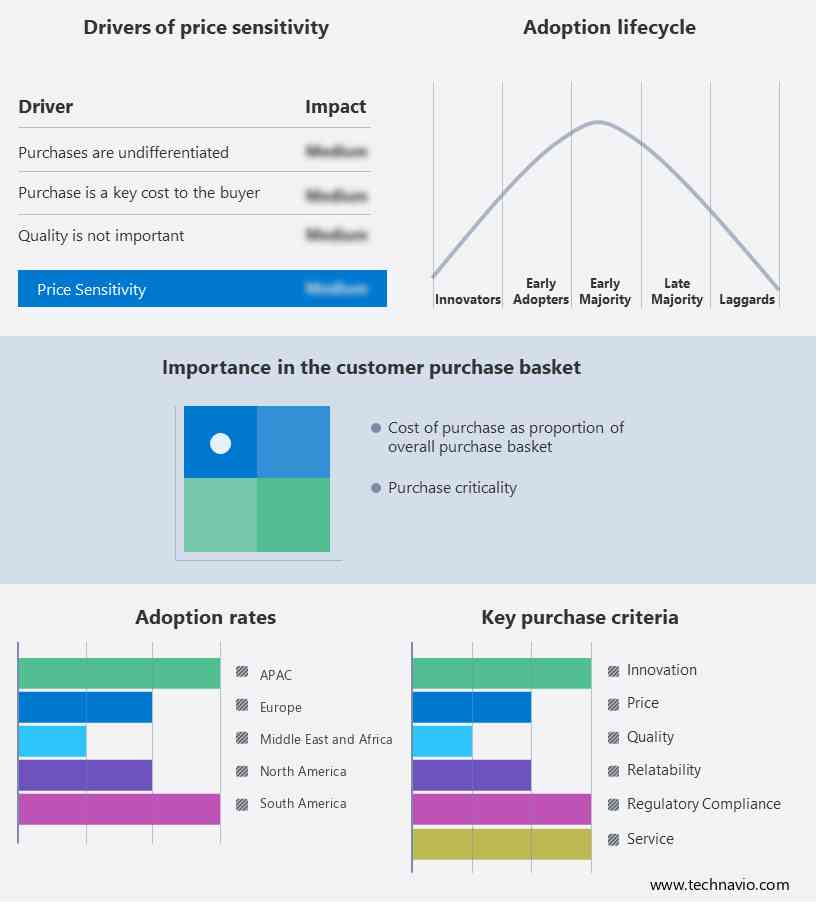
Global Advanced Energy Market Customer Landscape

Major Advanced Energy Market Companies

Companies are implementing various strategies, such as strategic alliances, partnerships, mergers and acquisitions, geographical expansion, and product/service launches, to enhance their presence in the market.

ABB Ltd. - The company offers advanced energy solutions for electrical energy through power plants.

The research report also includes detailed analyses of the competitive landscape of the market and information about 15 market companies, including:

  • ABB Ltd.
  • BYD Co. Ltd.
  • Electricite de France SA
  • EOS Energy Enterprises Inc.
  • General Electric Co.
  • Hitachi Ltd.
  • INEOS Group Holdings SA
  • LG Chem Ltd.
  • LyondellBasell Industries Holdings B.V.
  • NEC Corp.
  • Panasonic Holdings Corp.
  • S and C Electric Co.
  • Samsung SDI Co. Ltd.
  • Schneider Electric SE
  • Sensata Technologies Inc.
  • Tesla Inc.
  • The AES Corp.
  • Toshiba Corp.
  • TotalEnergies SE
  • UCAP Power Inc.

Qualitative and quantitative analysis of companies has been conducted to help clients understand the wider business environment as well as the strengths and weaknesses of key market players. Data is qualitatively analyzed to categorize companies as pure play, category-focused, industry-focused, and diversified; it is quantitatively analyzed to categorize companies as dominant, leading, strong, tentative, and weak.

Segment Overview

The market report provides comprehensive data (region wise segment analysis), with forecasts and estimates in "USD Billion" for the period 2024 to 2028, as well as historical data from 2018 to 2022 for the following segments.

  • Application Outlook
    • On-grid
    • Off-grid
  • End-user Outlook
    • Residential
    • Non-residential
  • Region Outlook
    • North America
      • The U.S.
      • Canada
    • Europe
      • U.K.
      • Germany
      • France
      • Rest of Europe
    • APAC
      • China
      • India
    • Middle East & Africa
      • Saudi Arabia
      • South Africa
      • Rest of the Middle East & Africa
    • South America
      • Brazil
      • Argentina
      • Chile

You may also be interested in:

  • Advanced Energy Storage Systems (AESS) Market Analysis APAC, Europe, North America, South America, Middle East and Africa - US, China, Japan, Germany, France - Size and Forecast 
  • Smart Energy Market Analysis North America, Europe, APAC, South America, Middle East and Africa - US, China, Germany, France, UK - Size and Forecast
  • High Purity Alumina Market Analysis APAC, North America, Europe, South America, Middle East and Africa - China, Taiwan, US, South Korea, Japan - Size and Forecast

Market Analyst Overview

Advanced Energy Marketing: Harnessing the Power of Methane and Renewable Natural Gas (RNG) in the Energy Landscape Methane, a potent greenhouse gas, has emerged as a significant player in the global energy market. Its role extends beyond natural gas to Renewable Natural Gas (RNG), an eco-friendly alternative fuel derived from biodegradable waste. In the residential and commercial sectors, RNG is gaining traction as a power generating source and transportation fuel. The energy industry's demand dynamics are influenced by various factors, including global supply, geopolitical dependence, national security, and emerging economies. The supply-demand chain for conventional fuels like coal and oil faces challenges from increasing energy efficiency programs and the adoption of renewable energy sources. Business expansion methods, technology advancements, mergers, and partnerships among integrated energy firms, pipeline operators, storage facilities, and local distribution companies are shaping the energy landscape. RNG production from biogas and landfills is a promising area for cleantech firms, leveraging data analytics, AI, and machine learning for optimized production. RNG's role in power generation and transportation fuel is on the rise, with LNG imports playing a crucial role in meeting the demand. The use of RNG in place of conventional fuels reduces greenhouse gas emissions significantly. Furthermore, green hydrogen production, carbon capture, and storage are emerging areas for RNG's application. The energy market's future lies in the integration of renewable energy sources, energy efficiency, alternative fuels, and advanced technologies to create a sustainable, efficient, and low-carbon energy ecosystem.

Market Scope

Report Coverage

Details

Page number

166

Base year

2023

Historic period

2018 - 2022

Forecast period

2024-2028

Growth momentum & CAGR

Accelerate at a CAGR of 4.25%

Market growth 2024-2028

USD 36.3 billion

Market structure

USD Fragmented

YoY growth 2023-2024(%)

4.08

Regional analysis

APAC, Europe, North America, South America, and Middle East and Africa

Performing market contribution

Europe at 32%

Key countries

US, China, Germany, France, and Japan

Competitive landscape

Leading Companies, Market Positioning of Companies, Competitive Strategies, and Industry Risks

Key companies profiled

ABB Ltd., BYD Co. Ltd., Electricite de France SA, EOS Energy Enterprises Inc., General Electric Co., Hitachi Ltd., INEOS AG, LG Chem Ltd., LyondellBasell Industries N.V., NEC Corp., Panasonic Holdings Corp., S and C Electric Co., Samsung SDI Co. Ltd., Schneider Electric SE, Sensata Technologies Inc., Tesla Inc., The AES Corp., Toshiba Corp., TotalEnergies SE, and UCAP Power Inc.

Market dynamics

Parent market analysis, Market growth inducers and obstacles, Fast-growing and slow-growing segment analysis, Market growth and Forecasting, COVID 19 impact and recovery analysis and future consumer dynamics, Market condition analysis for forecast period

Customization purview

If our report has not included the data that you are looking for, you can reach out to our analysts and get segments customized.

View PDF Sample

What are the Key Data Covered in this Advanced Energy Market Research Report?

  • CAGR of the market during the forecast period
  • Detailed information on factors that will drive the growth of the market between 2023 and 2027
  • Precise estimation of the size of the market  size and its contribution of the market in focus to the parent market
  • Accurate predictions about upcoming trends and changes in consumer behavior
  • Growth of the market industry across APAC, Europe, North America, South America, and Middle East and Africa
  • Thorough analysis of the market’s competitive landscape and detailed information about companies
  • Comprehensive analysis of factors that will challenge the growth of market companies

We can help! Our analysts can customize this market research report to meet your requirements. 

Get in touch

1 Executive Summary

  • 1.1 Market overview
    • Executive Summary - Chart on Market Overview
    • Executive Summary - Data Table on Market Overview
    • Executive Summary - Chart on Global Market Characteristics
    • Executive Summary - Chart on Market by Geography
    • Executive Summary - Chart on Market Segmentation by Application
    • Executive Summary - Chart on Market Segmentation by End-user
    • Executive Summary - Chart on Incremental Growth
    • Executive Summary - Data Table on Incremental Growth
    • Executive Summary - Chart on Company Market Positioning

2 Market Landscape

  • 2.1 Market ecosystem
    • Parent Market
    • Data Table on - Parent Market
  • 2.2 Market characteristics
    • Market characteristics analysis
  • 2.3 Value chain analysis
    • Value Chain Analysis

3 Market Sizing

  • 3.1 Market definition
    • Offerings of companies included in the market definition
  • 3.2 Market segment analysis
    • Market segments
  • 3.3 Market size 2023
    • 3.4 Market outlook: Forecast for 2023-2028
      • Chart on Global - Market size and forecast 2023-2028 ($ billion)
      • Data Table on Global - Market size and forecast 2023-2028 ($ billion)
      • Chart on Global Market: Year-over-year growth 2023-2028 (%)
      • Data Table on Global Market: Year-over-year growth 2023-2028 (%)

    4 Historic Market Size

    • 4.1 Global Advanced Energy Market 2018 - 2022
      • Historic Market Size - Data Table on Global Advanced Energy Market 2018 - 2022 ($ billion)
    • 4.2 Application segment analysis 2018 - 2022
      • Historic Market Size - Application Segment 2018 - 2022 ($ billion)
    • 4.3 End-user segment analysis 2018 - 2022
      • Historic Market Size - End-user Segment 2018 - 2022 ($ billion)
    • 4.4 Geography segment analysis 2018 - 2022
      • Historic Market Size - Geography Segment 2018 - 2022 ($ billion)
    • 4.5 Country segment analysis 2018 - 2022
      • Historic Market Size - Country Segment 2018 - 2022 ($ billion)

    5 Five Forces Analysis

    • 5.1 Five forces summary
      • Five forces analysis - Comparison between 2023 and 2028
    • 5.2 Bargaining power of buyers
      • Bargaining power of buyers - Impact of key factors 2023 and 2028
    • 5.3 Bargaining power of suppliers
      • Bargaining power of suppliers - Impact of key factors in 2023 and 2028
    • 5.4 Threat of new entrants
      • Threat of new entrants - Impact of key factors in 2023 and 2028
    • 5.5 Threat of substitutes
      • Threat of substitutes - Impact of key factors in 2023 and 2028
    • 5.6 Threat of rivalry
      • Threat of rivalry - Impact of key factors in 2023 and 2028
    • 5.7 Market condition
      • Chart on Market condition - Five forces 2023 and 2028

    6 Market Segmentation by Application

    • 6.1 Market segments
      • Chart on Application - Market share 2023-2028 (%)
      • Data Table on Application - Market share 2023-2028 (%)
    • 6.2 Comparison by Application
      • Chart on Comparison by Application
      • Data Table on Comparison by Application
    • 6.3 On-grid - Market size and forecast 2023-2028
      • Chart on On-grid - Market size and forecast 2023-2028 ($ billion)
      • Data Table on On-grid - Market size and forecast 2023-2028 ($ billion)
      • Chart on On-grid - Year-over-year growth 2023-2028 (%)
      • Data Table on On-grid - Year-over-year growth 2023-2028 (%)
    • 6.4 Off-grid - Market size and forecast 2023-2028
      • Chart on Off-grid - Market size and forecast 2023-2028 ($ billion)
      • Data Table on Off-grid - Market size and forecast 2023-2028 ($ billion)
      • Chart on Off-grid - Year-over-year growth 2023-2028 (%)
      • Data Table on Off-grid - Year-over-year growth 2023-2028 (%)
    • 6.5 Market opportunity by Application
      • Market opportunity by Application ($ billion)
      • Data Table on Market opportunity by Application ($ billion)

    7 Market Segmentation by End-user

    • 7.1 Market segments
      • Chart on End-user - Market share 2023-2028 (%)
      • Data Table on End-user - Market share 2023-2028 (%)
    • 7.2 Comparison by End-user
      • Chart on Comparison by End-user
      • Data Table on Comparison by End-user
    • 7.3 Residential - Market size and forecast 2023-2028
      • Chart on Residential - Market size and forecast 2023-2028 ($ billion)
      • Data Table on Residential - Market size and forecast 2023-2028 ($ billion)
      • Chart on Residential - Year-over-year growth 2023-2028 (%)
      • Data Table on Residential - Year-over-year growth 2023-2028 (%)
    • 7.4 Non-residential - Market size and forecast 2023-2028
      • Chart on Non-residential - Market size and forecast 2023-2028 ($ billion)
      • Data Table on Non-residential - Market size and forecast 2023-2028 ($ billion)
      • Chart on Non-residential - Year-over-year growth 2023-2028 (%)
      • Data Table on Non-residential - Year-over-year growth 2023-2028 (%)
    • 7.5 Market opportunity by End-user
      • Market opportunity by End-user ($ billion)
      • Data Table on Market opportunity by End-user ($ billion)

    8 Customer Landscape

    • 8.1 Customer landscape overview
      • Analysis of price sensitivity, lifecycle, customer purchase basket, adoption rates, and purchase criteria

    9 Geographic Landscape

    • 9.1 Geographic segmentation
      • Chart on Market share by geography 2023-2028 (%)
      • Data Table on Market share by geography 2023-2028 (%)
    • 9.2 Geographic comparison
      • Chart on Geographic comparison
      • Data Table on Geographic comparison
    • 9.3 APAC - Market size and forecast 2023-2028
      • Chart on APAC - Market size and forecast 2023-2028 ($ billion)
      • Data Table on APAC - Market size and forecast 2023-2028 ($ billion)
      • Chart on APAC - Year-over-year growth 2023-2028 (%)
      • Data Table on APAC - Year-over-year growth 2023-2028 (%)
    • 9.4 Europe - Market size and forecast 2023-2028
      • Chart on Europe - Market size and forecast 2023-2028 ($ billion)
      • Data Table on Europe - Market size and forecast 2023-2028 ($ billion)
      • Chart on Europe - Year-over-year growth 2023-2028 (%)
      • Data Table on Europe - Year-over-year growth 2023-2028 (%)
    • 9.5 North America - Market size and forecast 2023-2028
      • Chart on North America - Market size and forecast 2023-2028 ($ billion)
      • Data Table on North America - Market size and forecast 2023-2028 ($ billion)
      • Chart on North America - Year-over-year growth 2023-2028 (%)
      • Data Table on North America - Year-over-year growth 2023-2028 (%)
    • 9.6 South America - Market size and forecast 2023-2028
      • Chart on South America - Market size and forecast 2023-2028 ($ billion)
      • Data Table on South America - Market size and forecast 2023-2028 ($ billion)
      • Chart on South America - Year-over-year growth 2023-2028 (%)
      • Data Table on South America - Year-over-year growth 2023-2028 (%)
    • 9.7 Middle East and Africa - Market size and forecast 2023-2028
      • Chart on Middle East and Africa - Market size and forecast 2023-2028 ($ billion)
      • Data Table on Middle East and Africa - Market size and forecast 2023-2028 ($ billion)
      • Chart on Middle East and Africa - Year-over-year growth 2023-2028 (%)
      • Data Table on Middle East and Africa - Year-over-year growth 2023-2028 (%)
    • 9.8 US - Market size and forecast 2023-2028
      • Chart on US - Market size and forecast 2023-2028 ($ billion)
      • Data Table on US - Market size and forecast 2023-2028 ($ billion)
      • Chart on US - Year-over-year growth 2023-2028 (%)
      • Data Table on US - Year-over-year growth 2023-2028 (%)
    • 9.9 China - Market size and forecast 2023-2028
      • Chart on China - Market size and forecast 2023-2028 ($ billion)
      • Data Table on China - Market size and forecast 2023-2028 ($ billion)
      • Chart on China - Year-over-year growth 2023-2028 (%)
      • Data Table on China - Year-over-year growth 2023-2028 (%)
    • 9.10 Germany - Market size and forecast 2023-2028
      • Chart on Germany - Market size and forecast 2023-2028 ($ billion)
      • Data Table on Germany - Market size and forecast 2023-2028 ($ billion)
      • Chart on Germany - Year-over-year growth 2023-2028 (%)
      • Data Table on Germany - Year-over-year growth 2023-2028 (%)
    • 9.11 France - Market size and forecast 2023-2028
      • Chart on France - Market size and forecast 2023-2028 ($ billion)
      • Data Table on France - Market size and forecast 2023-2028 ($ billion)
      • Chart on France - Year-over-year growth 2023-2028 (%)
      • Data Table on France - Year-over-year growth 2023-2028 (%)
    • 9.12 Japan - Market size and forecast 2023-2028
      • Chart on Japan - Market size and forecast 2023-2028 ($ billion)
      • Data Table on Japan - Market size and forecast 2023-2028 ($ billion)
      • Chart on Japan - Year-over-year growth 2023-2028 (%)
      • Data Table on Japan - Year-over-year growth 2023-2028 (%)
    • 9.13 Market opportunity by geography
      • Market opportunity by geography ($ billion)
      • Data Tables on Market opportunity by geography ($ billion)

    10 Drivers, Challenges, and Opportunity/Restraints

    • 10.1 Market drivers
      • 10.2 Market challenges
        • 10.3 Impact of drivers and challenges
          • Impact of drivers and challenges in 2023 and 2028
        • 10.4 Market opportunities/restraints

          11 Competitive Landscape

          • 11.1 Overview
            • 11.2 Competitive Landscape
              • Overview on criticality of inputs and factors of differentiation
            • 11.3 Landscape disruption
              • Overview on factors of disruption
            • 11.4 Industry risks
              • Impact of key risks on business

            12 Competitive Analysis

            • 12.1 Companies profiled
              • Companies covered
            • 12.2 Market positioning of companies
              • Matrix on companies position and classification
            • 12.3 ABB Ltd.
              • ABB Ltd. - Overview
              • ABB Ltd. - Business segments
              • ABB Ltd. - Key news
              • ABB Ltd. - Key offerings
              • ABB Ltd. - Segment focus
            • 12.4 Electricite de France SA
              • Electricite de France SA - Overview
              • Electricite de France SA - Business segments
              • Electricite de France SA - Key offerings
              • Electricite de France SA - Segment focus
            • 12.5 EOS Energy Enterprises Inc.
              • EOS Energy Enterprises Inc. - Overview
              • EOS Energy Enterprises Inc. - Product / Service
              • EOS Energy Enterprises Inc. - Key offerings
            • 12.6 General Electric Co.
              • General Electric Co. - Overview
              • General Electric Co. - Business segments
              • General Electric Co. - Key news
              • General Electric Co. - Key offerings
              • General Electric Co. - Segment focus
            • 12.7 INEOS AG
              • INEOS AG - Overview
              • INEOS AG - Product / Service
              • INEOS AG - Key news
              • INEOS AG - Key offerings
            • 12.8 LG Chem Ltd.
              • LG Chem Ltd. - Overview
              • LG Chem Ltd. - Business segments
              • LG Chem Ltd. - Key news
              • LG Chem Ltd. - Key offerings
              • LG Chem Ltd. - Segment focus
            • 12.9 LyondellBasell Industries N.V.
              • LyondellBasell Industries N.V. - Overview
              • LyondellBasell Industries N.V. - Business segments
              • LyondellBasell Industries N.V. - Key news
              • LyondellBasell Industries N.V. - Key offerings
              • LyondellBasell Industries N.V. - Segment focus
            • 12.10 NEC Corp.
              • NEC Corp. - Overview
              • NEC Corp. - Business segments
              • NEC Corp. - Key news
              • NEC Corp. - Key offerings
              • NEC Corp. - Segment focus
            • 12.11 S and C Electric Co.
              • S and C Electric Co. - Overview
              • S and C Electric Co. - Product / Service
              • S and C Electric Co. - Key offerings
            • 12.12 Schneider Electric SE
              • Schneider Electric SE - Overview
              • Schneider Electric SE - Business segments
              • Schneider Electric SE - Key news
              • Schneider Electric SE - Key offerings
              • Schneider Electric SE - Segment focus
            • 12.13 Sensata Technologies Inc.
              • Sensata Technologies Inc. - Overview
              • Sensata Technologies Inc. - Business segments
              • Sensata Technologies Inc. - Key news
              • Sensata Technologies Inc. - Key offerings
              • Sensata Technologies Inc. - Segment focus
            • 12.14 Tesla Inc.
              • Tesla Inc. - Overview
              • Tesla Inc. - Business segments
              • Tesla Inc. - Key news
              • Tesla Inc. - Key offerings
              • Tesla Inc. - Segment focus
            • 12.15 The AES Corp.
              • The AES Corp. - Overview
              • The AES Corp. - Business segments
              • The AES Corp. - Key offerings
              • The AES Corp. - Segment focus
            • 12.16 TotalEnergies SE
              • TotalEnergies SE - Overview
              • TotalEnergies SE - Business segments
              • TotalEnergies SE - Key news
              • TotalEnergies SE - Key offerings
              • TotalEnergies SE - Segment focus
            • 12.17 UCAP Power Inc.
              • UCAP Power Inc. - Overview
              • UCAP Power Inc. - Product / Service
              • UCAP Power Inc. - Key offerings

            13 Appendix

            • 13.1 Scope of the report
              • 13.2 Inclusions and exclusions checklist
                • Inclusions checklist
                • Exclusions checklist
              • 13.3 Currency conversion rates for US$
                • Currency conversion rates for US$
              • 13.4 Research methodology
                • Research methodology
              • 13.5 Data procurement
                • Information sources
              • 13.6 Data validation
                • Data validation
              • 13.7 Validation techniques employed for market sizing
                • Validation techniques employed for market sizing
              • 13.8 Data synthesis
                • Data synthesis
              • 360 degree market analysis
                • 360 degree market analysis
              • 13.10 List of abbreviations
                • List of abbreviations

              Research Methodology

              Technavio presents a detailed picture of the market by way of study, synthesis, and summation of data from multiple sources. The analysts have presented the various facets of the market with a particular focus on identifying the key industry influencers. The data thus presented is comprehensive, reliable, and the result of extensive research, both primary and secondary.

              INFORMATION SOURCES

              Primary sources

              • Manufacturers and suppliers
              • Channel partners
              • Industry experts
              • Strategic decision makers

              Secondary sources

              • Industry journals and periodicals
              • Government data
              • Financial reports of key industry players
              • Historical data
              • Press releases

              DATA ANALYSIS

              Data Synthesis

              • Collation of data
              • Estimation of key figures
              • Analysis of derived insights

              Data Validation

              • Triangulation with data models
              • Reference against proprietary databases
              • Corroboration with industry experts

              REPORT WRITING

              Qualitative

              • Market drivers
              • Market challenges
              • Market trends
              • Five forces analysis

              Quantitative

              • Market size and forecast
              • Market segmentation
              • Geographical insights
              • Competitive landscape

              Interested in this report?

              Get your sample now to see our research methodology and insights!

              Download Now

              Frequently Asked Questions

              Advanced Energy market growth will increase by $ 36.3 bn during 2024-2028 .

              The Advanced Energy market is expected to grow at a CAGR of 4.25% during 2024-2028 .

              Advanced Energy market is segmented by Application( On-grid, Off-grid) End-user( Residential, Non-residential)

              ABB Ltd., BYD Co. Ltd., Electricite de France SA, EOS Energy Enterprises Inc., General Electric Co., Hitachi Ltd., INEOS AG, LG Chem Ltd., LyondellBasell Industries N.V., NEC Corp., Panasonic Holdings Corp., S and C Electric Co., Samsung SDI Co. Ltd., Schneider Electric SE, Sensata Technologies Inc., Tesla Inc., The AES Corp., Toshiba Corp., TotalEnergies SE, UCAP Power Inc. are a few of the key vendors in the Advanced Energy market.

              Europe will register the highest growth rate of 32% among the other regions. Therefore, the Advanced Energy market in Europe is expected to garner significant business opportunities for the vendors during the forecast period.

              US, China, Germany, France, Japan

              • Increasing investments in clean energy technologiesOwing to government regulations on the reduction of carbon emissions is the driving factor this market.
              • the adoption of advanced energy across the world has increased. The proliferation of advanced energy is driven by the increasing number of investments in clean energy. According to the International Energy Agency (IEA) is the driving factor this market.
              • in 2022 is the driving factor this market.
              • investment in solar PV increased to record levels is the driving factor this market.
              • and the share of solar PV deployment in countries such as China and India continued to grow. In the same year is the driving factor this market.
              • new global offshore wind farm investments grew to record levels. Europe has the largest floating wind market is the driving factor this market.
              • with a 47% global market share is the driving factor this market.
              • closely followed by Asia (45%) and North America (8%). Also is the driving factor this market.
              • the share of low-carbon energy sources is the driving factor this market.
              • such as renewables and nuclear energy is the driving factor this market.
              • in the global power generation investment accounted for almost 90% in 2023. According to the IEA is the driving factor this market.
              • in 2022 is the driving factor this market.
              • China was the highest investor in energy and accounted for more than one-third of the global energy investment. Furthermore is the driving factor this market.
              • China's energy investment is being driven primarily toward achieving low-carbon electricity supply and networks as well as energy efficiency. According to the IEA is the driving factor this market.
              • in 2021 is the driving factor this market.
              • annual global energy investment increased to $1.9 trillion is the driving factor this market.
              • rebounding 10% from 2020 and bringing the total investment volume back toward pre-crisis levels. China accounted for the largest share of grid investment is the driving factor this market.
              • driven by the technologies designed to enhance the flexibility of power systems and support the integration of renewables and new sources of demand.Hence is the driving factor this market.
              • significant investments in clean energy is the driving factor this market.
              • such as solar energy power generation is the driving factor this market.
              • are expected to drive the growth of the global advanced energy market during the forecast period. is the driving factor this market.

              The Advanced Energy market vendors should focus on grabbing business opportunities from the On-grid segment as it accounted for the largest market share in the base year.