Smart Energy Market Analysis, Size, and Forecast 2024-2028: North America (US and Canada), Europe (France, Germany, Italy, UK), APAC (China, India, Japan), South America (Argentina and Brazil), and Middle East and Africa (Egypt, KSA, Oman, UAE)

Smart Energy Market Analysis, Size, and Forecast 2024-2028:
North America (US and Canada), Europe (France, Germany, Italy, UK), APAC (China, India, Japan), South America (Argentina and Brazil), and Middle East and Africa (Egypt, KSA, Oman, UAE)

Published: Nov 2023 191 Pages SKU: IRTNTR70185

Market Overview at a Glance

$7.26 B
Market Opportunity
19.1%
CAGR
18.19
YoY growth 2023-2024(%)

Smart Energy Market Size 2024-2028

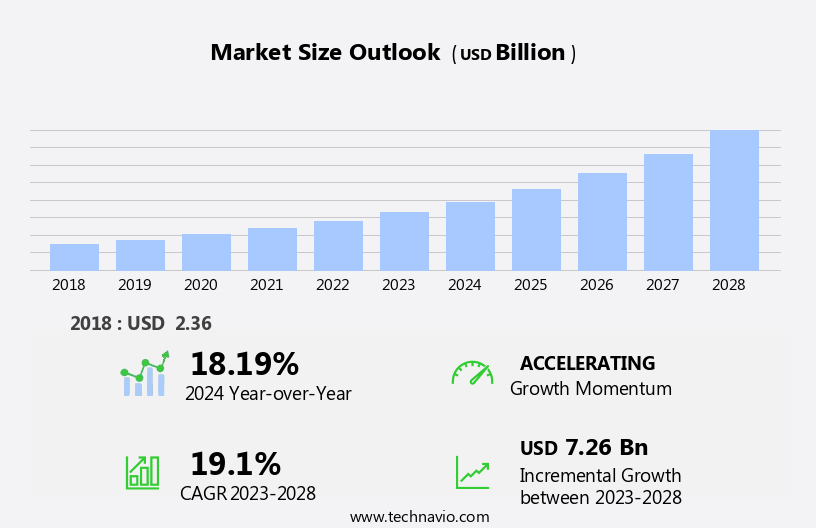
The smart energy market size is forecast to increase by USD 7.26 billion at a CAGR of 19.1% between 2023 and 2028.

  • The market is experiencing significant growth, driven by the increasing adoption of smart grid technologies and the rising investment in smart cities and smart homes. These trends are transforming the energy sector by enabling more efficient energy management and consumption. However, the intermittency in solar energy remains a challenge, as renewable energy sources become an increasingly larger part of the energy mix. To capitalize on market opportunities and navigate challenges effectively, companies must stay abreast of technological advancements and regulatory developments.
  • Strategic partnerships and collaborations can also help organizations expand their reach and enhance their offerings. By focusing on innovation and flexibility, companies can position themselves to thrive in this dynamic market.

What will be the Size of the Smart Energy Market during the forecast period?

Smart Energy Market Size

 Request Free Sample

  • The market encompasses a range of technologies and services aimed at optimizing energy production and consumption, reducing carbon footprints, and integrating renewable energy sources into the grid. Key components include smart meters, distribution automation systems, and advanced metering devices for homes, offices, and industrial plants. Capital expenditures in this sector are driven by the adoption of smart grid technologies, such as solar energy, wind energy, and smart thermal grids. Consulting services play a crucial role in the development and implementation of these solutions, ensuring regulatory compliance and work management efficiency. The market's growth is fueled by the increasing importance of energy efficiency, the rise of renewable energy sources, and the integration of smart electricity grids.
  • Hardware, including smart sensors and communication networks, are essential for enabling real-time monitoring and control of energy usage. Overall, the market is experiencing significant growth as businesses and consumers seek to minimize their carbon footprints and improve energy management.

How is this Smart Energy Industry segmented?

The smart energy industry research report provides comprehensive data (region-wise segment analysis), with forecasts and estimates in "USD billion" for the period 2024-2028, as well as historical data from 2018-2022 for the following segments.
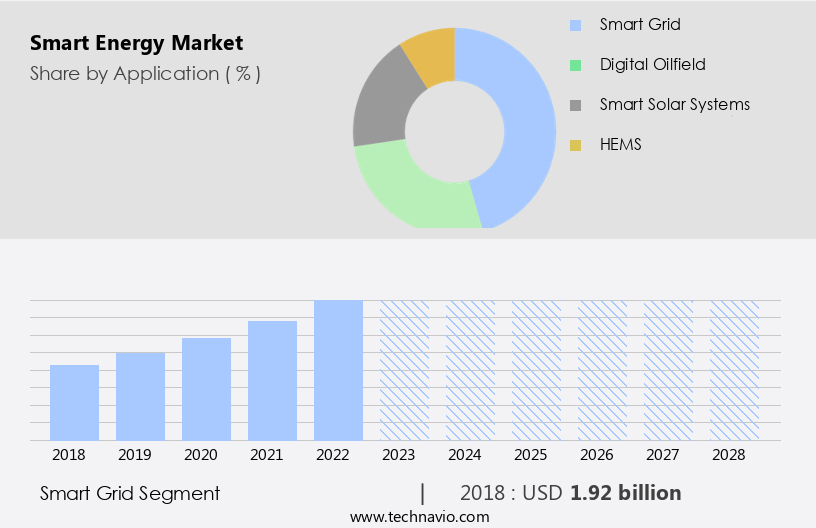
  • Application
    • Smart grid
    • Digital oilfield
    • Smart solar systems
    • HEMS
  • End-user
    • Industrial
    • Commercial
    • Residential
  • Component
    • Solution
    • Services
  • Geography
    • North America
      • US
      • Canada
    • Europe
      • France
      • Germany
      • Italy
      • UK
    • APAC
      • China
      • India
      • Japan
    • South America
      • Argentina
      • Brazil
    • Middle East and Africa
      • Egypt
      • KSA
      • Oman
      • UAE
    • Rest of World (ROW)

By Application Insights

The smart grid segment is estimated to witness significant growth during the forecast period. The market encompasses the deployment of intelligent electricity meters, solar energy, and renewable energy sources in homes, offices, and industrial plants. Smart grids, a significant segment of this market, leverage advanced metering devices, network infrastructure, and system integration services to optimize energy supply security. The US is a pioneer in this field, with substantial investments in smart grid technology. In 2022, the US allocated USD 84 billion for grid investments, making it the global leader. China follows with USD 75 billion, and other countries invest USD 63 billion. The smart grid market consists of electric grid equipment and services, including distribution automation systems, network management software, and hardware.

This technology integration aids in the efficient management of renewable power sources, such as solar and wind, and reduces carbon footprints while adhering to regulatory standards. Smart thermal grids and work management systems further enhance industrial processes, ensuring energy efficiency and cost savings. Smart gas and steam turbines are also integral components of the market, contributing to the overall growth and development of renewable energy sources.

Smart Energy Market Size

Get a glance at the market report of share of various segments Request Free Sample

The Smart grid segment was valued at USD 1.92 billion in 2018 and showed a gradual increase during the forecast period.

Regional Analysis

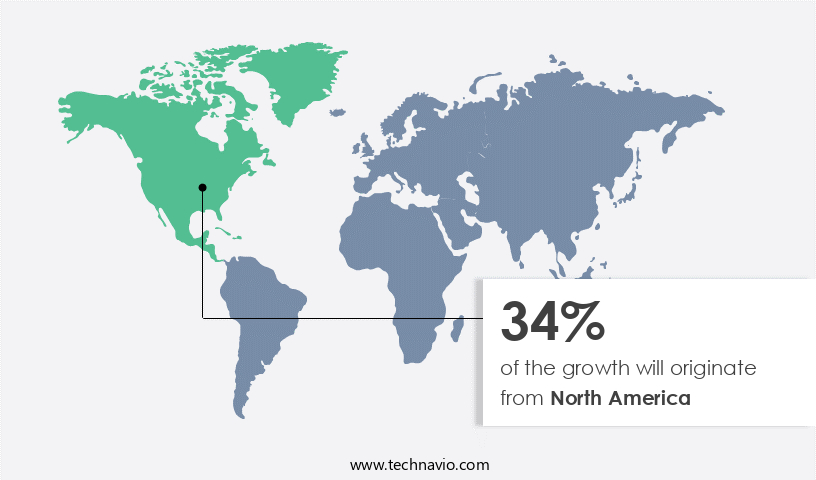
North America is estimated to contribute 34% to the growth of the global market during the forecast period. Technavio's analysts have elaborately explained the regional trends and drivers that shape the market during the forecast period.

Smart Energy Market Share by Geography

For more insights on the market size of various regions, Request Free Sample

In North America, the growing emphasis on smart electricity and the expansion of intelligent electricity meters in homes and offices are key drivers for the market. The region's smart grid technology development, including solar energy and renewable power sources, is a significant factor. Advanced metering devices, network management software, and distribution automation systems are integral components of this growth. Industrial plants and commercial establishments are also investing in smart grid technologies, such as steam turbines and smart thermal grids, to optimize energy supply security and reduce carbon footprints. Utility service providers are integrating hardware, system integration services, and consulting services to ensure regulatory standards are met.

The digital oilfield is also adopting smart grid technologies for improved efficiency. The US, as a leading investor in smart energy solutions, is poised for market growth due to extensive smart grid deployment. The region's smart grid projects, including large-scale deployments and smart solar initiatives, are expected to present attractive data analytics projections during the forecast period. Utility service providers are actively implementing these projects, having completed various pilot programs and initiating rollouts.

Market Dynamics

Our researchers analyzed the data with 2023 as the base year, along with the key drivers, trends, and challenges. A holistic analysis of drivers will help companies refine their marketing strategies to gain a competitive advantage.

What are the key market drivers leading to the rise in the adoption of Smart Energy Industry?

  • Rising adoption of smart grid technologies is the key driver of the market. The global adoption of smart grids is driving the demand for smart energy solutions. Utility providers are integrating advanced technologies, such as remote terminal units, intelligent electronic devices, and supervisory control and data acquisition systems, into their transmission and distribution networks. These technologies enhance grid reliability and promote energy efficiency. In addition, the installation of smart meters in consumer households is increasing. Smart meters serve as a bridge between utilities and homeowners, enabling real-time or near real-time energy consumption data exchange.
  • This information empowers consumers to monitor their energy usage effectively. The integration of smart grids and smart meters is transforming the energy sector, offering numerous benefits to both utilities and consumers.

What are the market trends shaping the Smart Energy Industry?

  • Growing investment in smart cities and smart homes is the upcoming market trend. The smart home market is experiencing significant growth as consumers increasingly prioritize convenience and efficiency in their daily lives. This trend is transforming the residential real estate sector, with the primary objective being to enhance comfort, convenience, security, entertainment, and sustainability. Advanced sensor technologies are making smart home solutions more accessible and affordable for the average household. Homeowners can now connect various appliances, including heating modules, lighting systems, air conditioning units, computers, television sets, entertainment systems, security devices, and camera systems, using their smartphones and tablets.
  • Artificial intelligence is integrated into home appliances to accurately predict consumer preferences based on historical data, offering personalized experiences. The adoption of these technologies is driven by the desire for energy savings, improved security, and enhanced convenience.

What challenges does the Smart Energy Industry face during its growth?

  • Intermittency in solar energy is a key challenge affecting the industry growth. Smart solar systems are gaining significance in the renewable energy market due to the intermittency associated with solar energy. Solar energy's dependence on weather and climatic conditions makes it an unreliable energy source, producing varying amounts of power. This volatility affects the entire power system and grid stability. To mitigate these issues, solar power plants require additional equipment to regulate power production and maintain grid stability. The demand for smart solar systems is driven by the need to address these challenges and optimize energy production.
  • These systems use advanced technologies such as energy storage and predictive analytics to manage power generation and distribution effectively. The integration of smart solar systems can help ensure a consistent power supply, improve grid reliability, and enhance overall energy efficiency.

Exclusive Customer Landscape

The smart energy market forecasting report includes the adoption lifecycle of the market, covering from the innovator's stage to the laggard's stage. It focuses on adoption rates in different regions based on penetration. Furthermore, the smart energy market report also includes key purchase criteria and drivers of price sensitivity to help companies evaluate and develop their market growth analysis strategies.
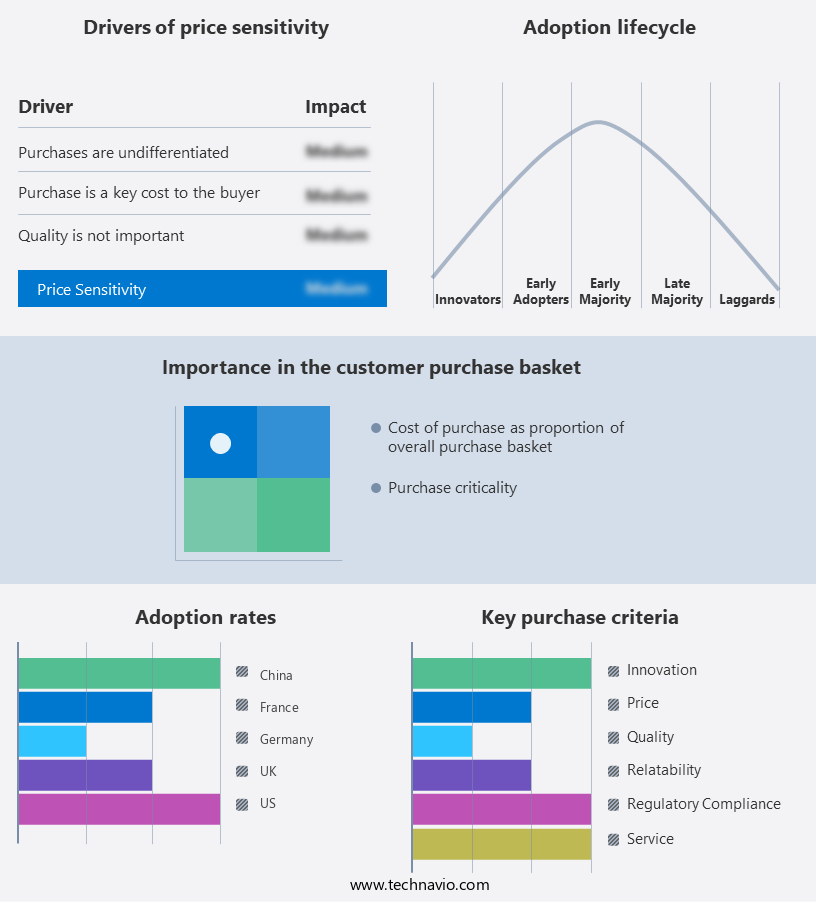
Smart Energy Market Share by Geography

 Customer Landscape

Key Companies & Market Insights

Companies are implementing various strategies, such as strategic alliances, smart energy market forecast, partnerships, mergers and acquisitions, geographical expansion, and product/service launches, to enhance their presence in the industry.

ABB Ltd. - ABB Electrification delivers advanced energy solutions, integrating technology and sustainability for optimized power management.

The industry research and growth report includes detailed analyses of the competitive landscape of the market and information about key companies, including:

  • ABB Ltd.
  • Cisco Systems Inc.
  • Delta Electronics Inc.
  • Enphase Energy Inc.
  • General Electric Co.
  • Honeywell International Inc.
  • International Business Machines Corp.
  • Itron Inc.
  • Kontron AG
  • Larsen and Toubro Ltd.
  • Mitsubishi Electric Corp.
  • Nextera Energy Inc.
  • Robert Bosch GmbH
  • Rockwell Automation Inc.
  • SAP SE
  • Schneider Electric SE
  • Siemens AG
  • SMART Energy Solutions
  • Toshiba Corp.
  • Xylem Inc.

Qualitative and quantitative analysis of companies has been conducted to help clients understand the wider business environment as well as the strengths and weaknesses of key industry players. Data is qualitatively analyzed to categorize companies as pure play, category-focused, industry-focused, and diversified; it is quantitatively analyzed to categorize companies as dominant, leading, strong, tentative, and weak.

Research Analyst Overview

The market encompasses the development, implementation, and management of intelligent electricity systems for various sectors, including homes and offices. These systems rely on advanced metering devices, network infrastructure, and software components to optimize energy consumption and distribution. The integration of renewable energy sources, such as solar energy, into smart grids is a significant trend in this market. Intelligent electricity meters play a crucial role in smart energy systems by providing real-time data on energy usage. This data enables network management software to optimize energy distribution and consumption, reducing overall energy waste and improving energy supply security. The residential sector is a major focus of smart energy development due to the growing importance of reducing carbon footprints and the increasing adoption of renewable power sources.

The industrial sector also benefits from smart energy systems, with steam turbines and other energy-intensive equipment being optimized through the use of advanced metering devices and distribution automation systems. The integration of smart grid technologies in industrial plants allows for more efficient energy management and reduces the reliance on fossil fuels. The development of smart energy systems requires significant capital expenditures for hardware and system integration services. Consulting services are also essential for ensuring technical expertise and regulatory compliance. The digital oilfield is another area where smart energy technologies are being applied to optimize energy production and reduce costs.

Smart thermal grids are another emerging trend in the market. These systems enable the efficient management of heating and cooling systems in commercial and residential buildings, reducing energy waste and improving overall energy efficiency. The integration of renewable energy sources into smart grids is a key challenge in the market. The intermittent nature of renewable energy sources requires advanced network management software to optimize energy distribution and ensure grid stability. The development of smart solar and other renewable power sources is a major focus of research and development efforts in the market. The market is characterized by the development and implementation of intelligent electricity systems for various sectors.

These systems rely on advanced metering devices, network infrastructure, and software components to optimize energy consumption and distribution. The integration of renewable energy sources and the optimization of industrial energy production are major trends in this market. The development of smart energy systems requires significant capital expenditures and technical expertise, making consulting services and system integration essential. The optimization of energy usage in commercial and residential buildings through smart thermal grids is another emerging trend in the market.

Market Scope

Report Coverage

Details

Page number

191

Base year

2023

Historic period

2018-2022

Forecast period

2024-2028

Growth momentum & CAGR

Accelerate at a CAGR of 19.1%

Market growth 2024-2028

USD 7.26 billion

Market structure

Fragmented

YoY growth 2023-2024(%)

18.19

Key countries

US, Canada, Germany, UK, Italy, France, China, India, Japan, Brazil, Egypt, UAE, Oman, Argentina, KSA, UAE, Brazil, and Rest of World (ROW)

Competitive landscape

Leading Companies, Market Positioning of Companies, Competitive Strategies, and Industry Risks

Request Free Sample

What are the Key Data Covered in this Smart Energy Market Research and Growth Report?

  • CAGR of the Smart Energy industry during the forecast period
  • Detailed information on factors that will drive the growth and forecasting between 2024 and 2028
  • Precise estimation of the size of the market and its contribution of the industry in focus to the parent market
  • Accurate predictions about upcoming growth and trends and changes in consumer behaviour
  • Growth of the market across North America, Europe, APAC, South America, and Middle East and Africa
  • Thorough analysis of the market's competitive landscape and detailed information about companies
  • Comprehensive analysis of factors that will challenge the smart energy market growth of industry companies

We can help! Our analysts can customize this smart energy market research report to meet your requirements.

Get in touch

1 Executive Summary

  • 1.1 Market overview
    • Exhibit 01: Executive Summary – Chart on Market Overview
    • Exhibit 02: Executive Summary – Data Table on Market Overview
    • Exhibit 03: Executive Summary – Chart on Global Market Characteristics
    • Exhibit 04: Executive Summary – Chart on Market by Geography
    • Exhibit 05: Executive Summary – Chart on Market Segmentation by Application
    • Exhibit 06: Executive Summary – Chart on Market Segmentation by End-user
    • Exhibit 07: Executive Summary – Chart on Incremental Growth
    • Exhibit 08: Executive Summary – Data Table on Incremental Growth
    • Exhibit 09: Executive Summary – Chart on Vendor Market Positioning

2 Market Landscape

  • 2.1 Market ecosystem
    • Exhibit 10: Parent market
    • Exhibit 11: Market Characteristics

3 Market Sizing

  • 3.1 Market definition
    • Exhibit 12: Offerings of vendors included in the market definition
  • 3.2 Market segment analysis
    • Exhibit 13: Market segments
  • 3.3 Market size 2023
    • 3.4 Market outlook: Forecast for 2023-2028
      • Exhibit 14: Chart on Global - Market size and forecast 2023-2028 ($ million)
      • Exhibit 15: Data Table on Global - Market size and forecast 2023-2028 ($ million)
      • Exhibit 16: Chart on Global Market: Year-over-year growth 2023-2028 (%)
      • Exhibit 17: Data Table on Global Market: Year-over-year growth 2023-2028 (%)

    4 Historic Market Size

    • 4.1 Global smart energy market 2018 - 2022
      • Exhibit 18: Historic Market Size – Data Table on global smart energy market 2018 - 2022 ($ million)
    • 4.2 Application Segment Analysis 2018 - 2022
      • Exhibit 19: Historic Market Size – Application Segment 2018 - 2022 ($ million)
    • 4.3 End-user Segment Analysis 2018 - 2022
      • Exhibit 20: Historic Market Size – End-user Segment 2018 - 2022 ($ million)
    • 4.4 Geography Segment Analysis 2018 - 2022
      • Exhibit 21: Historic Market Size – Geography Segment 2018 - 2022 ($ million)
    • 4.5 Country Segment Analysis 2018 - 2022
      • Exhibit 22: Historic Market Size – Country Segment 2018 - 2022 ($ million)

    5 Five Forces Analysis

    • 5.1 Five forces summary
      • Exhibit 23: Five forces analysis - Comparison between 2023 and 2028
    • 5.2 Bargaining power of buyers
      • Exhibit 24: Chart on Bargaining power of buyers – Impact of key factors 2023 and 2028
    • 5.3 Bargaining power of suppliers
      • Exhibit 25: Bargaining power of suppliers – Impact of key factors in 2023 and 2028
    • 5.4 Threat of new entrants
      • Exhibit 26: Threat of new entrants – Impact of key factors in 2023 and 2028
    • 5.5 Threat of substitutes
      • Exhibit 27: Threat of substitutes – Impact of key factors in 2023 and 2028
    • 5.6 Threat of rivalry
      • Exhibit 28: Threat of rivalry – Impact of key factors in 2023 and 2028
    • 5.7 Market condition
      • Exhibit 29: Chart on Market condition - Five forces 2023 and 2028

    6 Market Segmentation by Application

    • 6.1 Market segments
      • Chart on Application - Market share (2023-2028) (%)
      • Data Table on Application - Market share (2023-2028) (%)
    • 6.2 Comparison by Application
      • Chart on Comparison by Application
      • Data Table on Comparison by Application
    • 6.3 Smart grid - Market size and forecast (2023-2028)
      • Chart on Smart grid - Market size and forecast (2023-2028) ($ million)
      • Data Table on Smart grid - Market size and forecast (2023-2028) ($ million)
      • Chart on Smart grid - Year-over-year growth (2023-2028) (%)
      • Data Table on Smart grid - Year-over-year growth (2023-2028) (%)
    • 6.4 Digital oilfield - Market size and forecast (2023-2028)
      • Chart on Digital oilfield - Market size and forecast (2023-2028) ($ million)
      • Data Table on Digital oilfield - Market size and forecast (2023-2028) ($ million)
      • Chart on Digital oilfield - Year-over-year growth (2023-2028) (%)
      • Data Table on Digital oilfield - Year-over-year growth (2023-2028) (%)
    • 6.5 Smart solar systems - Market size and forecast (2023-2028)
      • Chart on Smart solar systems - Market size and forecast (2023-2028) ($ million)
      • Data Table on Smart solar systems - Market size and forecast (2023-2028) ($ million)
      • Chart on Smart solar systems - Year-over-year growth (2023-2028) (%)
      • Data Table on Smart solar systems - Year-over-year growth (2023-2028) (%)
    • 6.6 HEMS - Market size and forecast (2023-2028)
      • Chart on HEMS - Market size and forecast (2023-2028) ($ million)
      • Data Table on HEMS - Market size and forecast (2023-2028) ($ million)
      • Chart on HEMS - Year-over-year growth (2023-2028) (%)
      • Data Table on HEMS - Year-over-year growth (2023-2028) (%)
    • 6.7 Market opportunity by Application
      • Market opportunity by Application ($ million)
      • Data Table on Market opportunity by Application ($ million)

    7 Market Segmentation by End-user

    • 7.1 Market segments
      • Chart on End-user - Market share (2023-2028) (%)
      • Data Table on End-user - Market share (2023-2028) (%)
    • 7.2 Comparison by End-user
      • Chart on Comparison by End-user
      • Data Table on Comparison by End-user
    • 7.3 Industrial - Market size and forecast (2023-2028)
      • Chart on Industrial - Market size and forecast (2023-2028) ($ million)
      • Data Table on Industrial - Market size and forecast (2023-2028) ($ million)
      • Chart on Industrial - Year-over-year growth (2023-2028) (%)
      • Data Table on Industrial - Year-over-year growth (2023-2028) (%)
    • 7.4 Commercial - Market size and forecast (2023-2028)
      • Chart on Commercial - Market size and forecast (2023-2028) ($ million)
      • Data Table on Commercial - Market size and forecast (2023-2028) ($ million)
      • Chart on Commercial - Year-over-year growth (2023-2028) (%)
      • Data Table on Commercial - Year-over-year growth (2023-2028) (%)
    • 7.5 Residential - Market size and forecast (2023-2028)
      • Chart on Residential - Market size and forecast (2023-2028) ($ million)
      • Data Table on Residential - Market size and forecast (2023-2028) ($ million)
      • Chart on Residential - Year-over-year growth (2023-2028) (%)
      • Data Table on Residential - Year-over-year growth (2023-2028) (%)
    • 7.6 Market opportunity by End-user
      • Market opportunity by End-user ($ million)
      • Data Table on Market opportunity by End-user ($ million)

    8 Market Segmentation by Component

    • 8.1 Market segments
      • Chart on Component - Market share (2023-2028) (%)
      • Data Table on Component - Market share (2023-2028) (%)
    • 8.2 Comparison by Component
      • Chart on Comparison by Component
      • Data Table on Comparison by Component
    • 8.3 Solution - Market size and forecast (2023-2028)
      • Chart on Solution - Market size and forecast (2023-2028) ($ million)
      • Data Table on Solution - Market size and forecast (2023-2028) ($ million)
      • Chart on Solution - Year-over-year growth (2023-2028) (%)
      • Data Table on Solution - Year-over-year growth (2023-2028) (%)
    • 8.4 Services - Market size and forecast (2023-2028)
      • Chart on Services - Market size and forecast (2023-2028) ($ million)
      • Data Table on Services - Market size and forecast (2023-2028) ($ million)
      • Chart on Services - Year-over-year growth (2023-2028) (%)
      • Data Table on Services - Year-over-year growth (2023-2028) (%)
    • 8.5 Market opportunity by Component
      • Market opportunity by Component ($ million)
      • Data Table on Market opportunity by Component ($ million)

    8 Customer Landscape

    • 8.1 Customer landscape overview
      • Exhibit 70: Analysis of price sensitivity, lifecycle, customer purchase basket, adoption rates, and purchase criteria

    9 Geographic Landscape

    • 9.1 Geographic segmentation
      • Exhibit 71: Chart on Market share by geography 2023-2028 (%)
      • Exhibit 72: Data Table on Market share by geography 2023-2028 (%)
    • 9.2 Geographic comparison
      • Exhibit 73: Chart on Geographic comparison
      • Exhibit 74: Data Table on Geographic comparison
    • 9.3 North America - Market size and forecast 2023-2028
      • Exhibit 75: Chart on North America - Market size and forecast 2023-2028 ($ million)
      • Exhibit 76: Data Table on North America - Market size and forecast 2023-2028 ($ million)
      • Exhibit 77: Chart on North America - Year-over-year growth 2023-2028 (%)
      • Exhibit 78: Data Table on North America - Year-over-year growth 2023-2028 (%)
    • 9.4 Europe - Market size and forecast 2023-2028
      • Exhibit 79: Chart on Europe - Market size and forecast 2023-2028 ($ million)
      • Exhibit 80: Data Table on Europe - Market size and forecast 2023-2028 ($ million)
      • Exhibit 81: Chart on Europe - Year-over-year growth 2023-2028 (%)
      • Exhibit 82: Data Table on Europe - Year-over-year growth 2023-2028 (%)
    • 9.5 APAC - Market size and forecast 2023-2028
      • Exhibit 83: Chart on APAC - Market size and forecast 2023-2028 ($ million)
      • Exhibit 84: Data Table on APAC - Market size and forecast 2023-2028 ($ million)
      • Exhibit 85: Chart on APAC - Year-over-year growth 2023-2028 (%)
      • Exhibit 86: Data Table on APAC - Year-over-year growth 2023-2028 (%)
    • 9.6 South America - Market size and forecast 2023-2028
      • Exhibit 87: Chart on South America - Market size and forecast 2023-2028 ($ million)
      • Exhibit 88: Data Table on South America - Market size and forecast 2023-2028 ($ million)
      • Exhibit 89: Chart on South America - Year-over-year growth 2023-2028 (%)
      • Exhibit 90: Data Table on South America - Year-over-year growth 2023-2028 (%)
    • 9.7 Middle East and Africa - Market size and forecast 2023-2028
      • Exhibit 91: Chart on Middle East and Africa - Market size and forecast 2023-2028 ($ million)
      • Exhibit 92: Data Table on Middle East and Africa - Market size and forecast 2023-2028 ($ million)
      • Exhibit 93: Chart on Middle East and Africa - Year-over-year growth 2023-2028 (%)
      • Exhibit 94: Data Table on Middle East and Africa - Year-over-year growth 2023-2028 (%)
    • 9.8 US - Market size and forecast 2023-2028
      • Exhibit 95: Chart on US - Market size and forecast 2023-2028 ($ million)
      • Exhibit 96: Data Table on US - Market size and forecast 2023-2028 ($ million)
      • Exhibit 97: Chart on US - Year-over-year growth 2023-2028 (%)
      • Exhibit 98: Data Table on US - Year-over-year growth 2023-2028 (%)
    • 9.9 China - Market size and forecast 2023-2028
      • Exhibit 99: Chart on China - Market size and forecast 2023-2028 ($ million)
      • Exhibit 100: Data Table on China - Market size and forecast 2023-2028 ($ million)
      • Exhibit 101: Chart on China - Year-over-year growth 2023-2028 (%)
      • Exhibit 102: Data Table on China - Year-over-year growth 2023-2028 (%)
    • 9.10 Germany - Market size and forecast 2023-2028
      • Exhibit 103: Chart on Germany - Market size and forecast 2023-2028 ($ million)
      • Exhibit 104: Data Table on Germany - Market size and forecast 2023-2028 ($ million)
      • Exhibit 105: Chart on Germany - Year-over-year growth 2023-2028 (%)
      • Exhibit 106: Data Table on Germany - Year-over-year growth 2023-2028 (%)
    • 9.11 France - Market size and forecast 2023-2028
      • Exhibit 107: Chart on France - Market size and forecast 2023-2028 ($ million)
      • Exhibit 108: Data Table on France - Market size and forecast 2023-2028 ($ million)
      • Exhibit 109: Chart on France - Year-over-year growth 2023-2028 (%)
      • Exhibit 110: Data Table on France - Year-over-year growth 2023-2028 (%)
    • 9.12 UK - Market size and forecast 2023-2028
      • Exhibit 111: Chart on UK - Market size and forecast 2023-2028 ($ million)
      • Exhibit 112: Data Table on UK - Market size and forecast 2023-2028 ($ million)
      • Exhibit 113: Chart on UK - Year-over-year growth 2023-2028 (%)
      • Exhibit 114: Data Table on UK - Year-over-year growth 2023-2028 (%)
    • 9.13 Market opportunity by geography
      • Exhibit 115: Market opportunity by geography ($ million)
      • Exhibit 116: Data Tables on Market opportunity by geography ($ million)
    • 10.14 Canada - Market size and forecast (2023-2028)
      • Chart on Canada - Market size and forecast (2023-2028) ($ million)
      • Data Table on Canada - Market size and forecast (2023-2028) ($ million)
      • Chart on Canada - Year-over-year growth (2023-2028) (%)
      • Data Table on Canada - Year-over-year growth (2023-2028) (%)
    • 10.15 Italy - Market size and forecast (2023-2028)
      • Chart on Italy - Market size and forecast (2023-2028) ($ million)
      • Data Table on Italy - Market size and forecast (2023-2028) ($ million)
      • Chart on Italy - Year-over-year growth (2023-2028) (%)
      • Data Table on Italy - Year-over-year growth (2023-2028) (%)
    • 10.16 India - Market size and forecast (2023-2028)
      • Chart on India - Market size and forecast (2023-2028) ($ million)
      • Data Table on India - Market size and forecast (2023-2028) ($ million)
      • Chart on India - Year-over-year growth (2023-2028) (%)
      • Data Table on India - Year-over-year growth (2023-2028) (%)
    • 10.17 Japan - Market size and forecast (2023-2028)
      • Chart on Japan - Market size and forecast (2023-2028) ($ million)
      • Data Table on Japan - Market size and forecast (2023-2028) ($ million)
      • Chart on Japan - Year-over-year growth (2023-2028) (%)
      • Data Table on Japan - Year-over-year growth (2023-2028) (%)
    • 10.18 Egypt - Market size and forecast (2023-2028)
      • Chart on Egypt - Market size and forecast (2023-2028) ($ million)
      • Data Table on Egypt - Market size and forecast (2023-2028) ($ million)
      • Chart on Egypt - Year-over-year growth (2023-2028) (%)
      • Data Table on Egypt - Year-over-year growth (2023-2028) (%)
    • 10.19 Oman - Market size and forecast (2023-2028)
      • Chart on Oman - Market size and forecast (2023-2028) ($ million)
      • Data Table on Oman - Market size and forecast (2023-2028) ($ million)
      • Chart on Oman - Year-over-year growth (2023-2028) (%)
      • Data Table on Oman - Year-over-year growth (2023-2028) (%)
    • 10.20 Argentina - Market size and forecast (2023-2028)
      • Chart on Argentina - Market size and forecast (2023-2028) ($ million)
      • Data Table on Argentina - Market size and forecast (2023-2028) ($ million)
      • Chart on Argentina - Year-over-year growth (2023-2028) (%)
      • Data Table on Argentina - Year-over-year growth (2023-2028) (%)
    • 10.21 KSA - Market size and forecast (2023-2028)
      • Chart on KSA - Market size and forecast (2023-2028) ($ million)
      • Data Table on KSA - Market size and forecast (2023-2028) ($ million)
      • Chart on KSA - Year-over-year growth (2023-2028) (%)
      • Data Table on KSA - Year-over-year growth (2023-2028) (%)
    • 10.22 UAE - Market size and forecast (2023-2028)
      • Chart on UAE - Market size and forecast (2023-2028) ($ million)
      • Data Table on UAE - Market size and forecast (2023-2028) ($ million)
      • Chart on UAE - Year-over-year growth (2023-2028) (%)
      • Data Table on UAE - Year-over-year growth (2023-2028) (%)
    • 10.23 Brazil - Market size and forecast (2023-2028)
      • Chart on Brazil - Market size and forecast (2023-2028) ($ million)
      • Data Table on Brazil - Market size and forecast (2023-2028) ($ million)
      • Chart on Brazil - Year-over-year growth (2023-2028) (%)
      • Data Table on Brazil - Year-over-year growth (2023-2028) (%)
    • 10.24 Rest of World (ROW) - Market size and forecast (2023-2028)
      • Chart on Rest of World (ROW) - Market size and forecast (2023-2028) ($ million)
      • Data Table on Rest of World (ROW) - Market size and forecast (2023-2028) ($ million)
      • Chart on Rest of World (ROW) - Year-over-year growth (2023-2028) (%)
      • Data Table on Rest of World (ROW) - Year-over-year growth (2023-2028) (%)

    10 Drivers, Challenges, and Trends

    • 10.1 Market drivers
      • 10.2 Market challenges
        • 10.3 Impact of drivers and challenges
          • Exhibit 117: Impact of drivers and challenges in 2023 and 2028
        • 10.4 Market trends

          11 Vendor Landscape

          • 11.1 Overview
            • 11.2 Vendor landscape
              • Exhibit 118: Overview on Criticality of inputs and Factors of differentiation
            • 11.3 Landscape disruption
              • Exhibit 119: Overview on factors of disruption
            • 11.4 Industry risks
              • Exhibit 120: Impact of key risks on business

            12 Vendor Analysis

            • 12.1 Vendors covered
              • Exhibit 121: Vendors covered
            • 12.2 Market positioning of vendors
              • Exhibit 122: Matrix on vendor position and classification
            • 12.3 ABB Ltd.
              • Exhibit 123: ABB Ltd. - Overview
              • Exhibit 124: ABB Ltd. - Business segments
              • Exhibit 125: ABB Ltd. - Key offerings
              • Exhibit 126: ABB Ltd. - Segment focus
            • 12.4 General Electric Co.
              • Exhibit 127: General Electric Co. - Overview
              • Exhibit 128: General Electric Co. - Business segments
              • Exhibit 129: General Electric Co. - Key news
              • Exhibit 130: General Electric Co. - Key offerings
              • Exhibit 131: General Electric Co. - Segment focus
            • 12.5 Honeywell International Inc.
              • Exhibit 132: Honeywell International Inc. - Overview
              • Exhibit 133: Honeywell International Inc. - Business segments
              • Exhibit 134: Honeywell International Inc. - Key news
              • Exhibit 135: Honeywell International Inc. - Key offerings
              • Exhibit 136: Honeywell International Inc. - Segment focus
            • 12.6 International Business Machines Corp.
              • Exhibit 137: International Business Machines Corp. - Overview
              • Exhibit 138: International Business Machines Corp. - Business segments
              • Exhibit 139: International Business Machines Corp. - Key news
              • Exhibit 140: International Business Machines Corp. - Key offerings
              • Exhibit 141: International Business Machines Corp. - Segment focus
            • 12.7 Itron Inc.
              • Exhibit 142: Itron Inc. - Overview
              • Exhibit 143: Itron Inc. - Business segments
              • Exhibit 144: Itron Inc. - Key offerings
              • Exhibit 145: Itron Inc. - Segment focus
            • 12.8 Kontron AG
              • Exhibit 146: Kontron AG - Overview
              • Exhibit 147: Kontron AG - Business segments
              • Exhibit 148: Kontron AG - Key offerings
              • Exhibit 149: Kontron AG - Segment focus
            • 12.9 Larsen and Toubro Ltd.
              • Exhibit 150: Larsen and Toubro Ltd. - Overview
              • Exhibit 151: Larsen and Toubro Ltd. - Business segments
              • Exhibit 152: Larsen and Toubro Ltd. - Key news
              • Exhibit 153: Larsen and Toubro Ltd. - Key offerings
              • Exhibit 154: Larsen and Toubro Ltd. - Segment focus
            • 12.10 Mitsubishi Electric Corp.
              • Exhibit 155: Mitsubishi Electric Corp. - Overview
              • Exhibit 156: Mitsubishi Electric Corp. - Business segments
              • Exhibit 157: Mitsubishi Electric Corp. - Key news
              • Exhibit 158: Mitsubishi Electric Corp. - Key offerings
              • Exhibit 159: Mitsubishi Electric Corp. - Segment focus
            • 12.11 Robert Bosch GmbH
              • Exhibit 160: Robert Bosch GmbH - Overview
              • Exhibit 161: Robert Bosch GmbH - Business segments
              • Exhibit 162: Robert Bosch GmbH - Key news
              • Exhibit 163: Robert Bosch GmbH - Key offerings
              • Exhibit 164: Robert Bosch GmbH - Segment focus
            • 12.12 Rockwell Automation Inc.
              • Exhibit 165: Rockwell Automation Inc. - Overview
              • Exhibit 166: Rockwell Automation Inc. - Business segments
              • Exhibit 167: Rockwell Automation Inc. - Key news
              • Exhibit 168: Rockwell Automation Inc. - Key offerings
              • Exhibit 169: Rockwell Automation Inc. - Segment focus
            • 12.13 SAP SE
              • Exhibit 170: SAP SE - Overview
              • Exhibit 171: SAP SE - Business segments
              • Exhibit 172: SAP SE - Key news
              • Exhibit 173: SAP SE - Key offerings
              • Exhibit 174: SAP SE - Segment focus
            • 12.14 Schneider Electric SE
              • Exhibit 175: Schneider Electric SE - Overview
              • Exhibit 176: Schneider Electric SE - Business segments
              • Exhibit 177: Schneider Electric SE - Key news
              • Exhibit 178: Schneider Electric SE - Key offerings
              • Exhibit 179: Schneider Electric SE - Segment focus
            • 12.15 Siemens AG
              • Exhibit 180: Siemens AG - Overview
              • Exhibit 181: Siemens AG - Business segments
              • Exhibit 182: Siemens AG - Key news
              • Exhibit 183: Siemens AG - Key offerings
              • Exhibit 184: Siemens AG - Segment focus
            • 12.16 Toshiba Corp.
              • Exhibit 185: Toshiba Corp. - Overview
              • Exhibit 186: Toshiba Corp. - Business segments
              • Exhibit 187: Toshiba Corp. - Key news
              • Exhibit 188: Toshiba Corp. - Key offerings
              • Exhibit 189: Toshiba Corp. - Segment focus
            • 12.17 Xylem Inc.
              • Exhibit 190: Xylem Inc. - Overview
              • Exhibit 191: Xylem Inc. - Business segments
              • Exhibit 192: Xylem Inc. - Key offerings
              • Exhibit 193: Xylem Inc. - Segment focus

            13 Appendix

            • 13.1 Scope of the report
              • 13.2 Inclusions and exclusions checklist
                • Exhibit 194: Inclusions checklist
                • Exhibit 195: Exclusions checklist
              • 13.3 Currency conversion rates for US$
                • Exhibit 196: Currency conversion rates for US$
              • 13.4 Research methodology
                • Exhibit 197: Research methodology
                • Exhibit 198: Validation techniques employed for market sizing
                • Exhibit 199: Information sources
              • 13.5 List of abbreviations
                • Exhibit 200: List of abbreviations

              Research Methodology

              Technavio presents a detailed picture of the market by way of study, synthesis, and summation of data from multiple sources. The analysts have presented the various facets of the market with a particular focus on identifying the key industry influencers. The data thus presented is comprehensive, reliable, and the result of extensive research, both primary and secondary.

              INFORMATION SOURCES

              Primary sources

              • Manufacturers and suppliers
              • Channel partners
              • Industry experts
              • Strategic decision makers

              Secondary sources

              • Industry journals and periodicals
              • Government data
              • Financial reports of key industry players
              • Historical data
              • Press releases

              DATA ANALYSIS

              Data Synthesis

              • Collation of data
              • Estimation of key figures
              • Analysis of derived insights

              Data Validation

              • Triangulation with data models
              • Reference against proprietary databases
              • Corroboration with industry experts

              REPORT WRITING

              Qualitative

              • Market drivers
              • Market challenges
              • Market trends
              • Five forces analysis

              Quantitative

              • Market size and forecast
              • Market segmentation
              • Geographical insights
              • Competitive landscape

              Interested in this report?

              Get your sample now to see our research methodology and insights!

              Download Now

              Frequently Asked Questions

              Smart Energy market growth will increase by $ 7.26 bn during 2024-2028.

              The Smart Energy market is expected to grow at a CAGR of 19.1% during 2024-2028.

              Smart Energy market is segmented by Application( Smart grid, Digital oilfield, Smart solar systems, HEMS) End-user( Industrial, Commercial, Residential, HEMS, MEA)

              ABB Ltd., Cisco Systems Inc., Delta Electronics Inc., Enphase Energy Inc., General Electric Co., Honeywell International Inc., International Business Machines Corp., Itron Inc., Kontron AG, Larsen and Toubro Ltd., Mitsubishi Electric Corp., Nextera Energy Inc., Robert Bosch GmbH, Rockwell Automation Inc., SAP SE, Schneider Electric SE, Siemens AG, SMART Energy Solutions, Toshiba Corp., Xylem Inc. are a few of the key vendors in the Smart Energy market.

              North America will register the highest growth rate of 34% among the other regions. Therefore, the Smart Energy market in North America is expected to garner significant business opportunities for the vendors during the forecast period.

              US, Canada, Germany, UK, Italy, France, China, India, Japan, Brazil, Egypt, UAE, Oman, Argentina, KSA, UAE, Brazil, Rest of World (ROW)

              • Rising adoption of smart grid technologiesThe growing adoption of smart grids is one of the critical factors for an increase in demand for smart energy solutions. Globally is the driving factor this market.
              • utility service providers are adopting smart grid technologies to improve the reliability of the grid and achieve energy efficiency. Technologies such as remote terminal units is the driving factor this market.
              • intelligent electronic devices is the driving factor this market.
              • and other supervisory control and data acquisition systems are being adopted in the transmission and distribution infrastructure. At the same time is the driving factor this market.
              • smart meters are being installed in consumer homes. Smart meters are the essential link between utilities and homeowners; they enable utilities to have bi-directional communication with their customers. Smart meters provide real-time or near real-time energy consumption is the driving factor this market.
              • allowing the consumers to evaluate or know the level of energy consumption. The information provided helps consumers adopt energy conservation measures such as the use of smart thermostats. Some utility service providers offer an in-home display (IHD) when they install a smart meter. The IHD provides information on energy costs is the driving factor this market.
              • enabling consumers to make better decisions about their energy consumption and how to control it. The governments in countries such as the US is the driving factor this market.
              • the UK is the driving factor this market.
              • and Canada is the driving factor this market.
              • and countries in the EU such as the UK and Germany is the driving factor this market.
              • are installing smart meters. For instance is the driving factor this market.
              • in the UK is the driving factor this market.
              • in 2012 is the driving factor this market.
              • the government announced that smart meters would be fitted in all homes and businesses by the end of 2019 is the driving factor this market.
              • and this decline was extended to 2024. However is the driving factor this market.
              • energy suppliers now have until mid-2025 to implement this change. Around 135 is the driving factor this market.
              • 000 smart meters were fitted from April 2020 to June 2020 in the UK. As the installation of smart meters continues is the driving factor this market.
              • consumers are expected to be encouraged to adopt HEMS to participate in demand response (DR) and improve energy efficiency at the household level. Such factors will fuel the growth of the global smart energy market during the forecast period. is the driving factor this market.

              The Smart Energy market vendors should focus on grabbing business opportunities from the Smart grid segment as it accounted for the largest market share in the base year.
              RIA - Research AI Assistant
              Ask RIA