High Purity Alumina Market Analysis, Size, and Forecast 2026-2030: APAC (China, South Korea, and Japan), North America (US, Canada, and Mexico), Europe (Germany, France, and UK), South America (Brazil, Argentina, and Colombia), Middle East and Africa (Saudi Arabia, UAE, and South Africa), and Rest of World (ROW)

High Purity Alumina Market Analysis, Size, and Forecast 2026-2030:
APAC (China, South Korea, and Japan), North America (US, Canada, and Mexico), Europe (Germany, France, and UK), South America (Brazil, Argentina, and Colombia), Middle East and Africa (Saudi Arabia, UAE, and South Africa), and Rest of World (ROW)

Published: Apr 2026 308 Pages SKU: IRTNTR41567

Market Overview at a Glance

$10.45 B
Market Opportunity
32.5%
CAGR 2025 - 2030
72.5%
APAC Growth
$1.56 B
LEDs segment 2024

High Purity Alumina Market Size 2026-2030

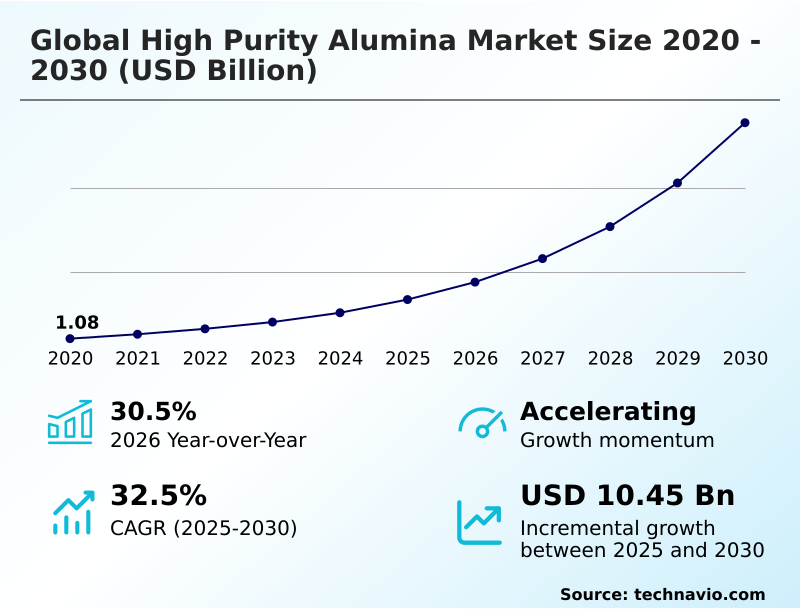
The high purity alumina market size is valued to increase by USD 10.45 billion, at a CAGR of 32.5% from 2025 to 2030. Rising integration within lithium-ion battery supply chain will drive the high purity alumina market.

Major Market Trends & Insights

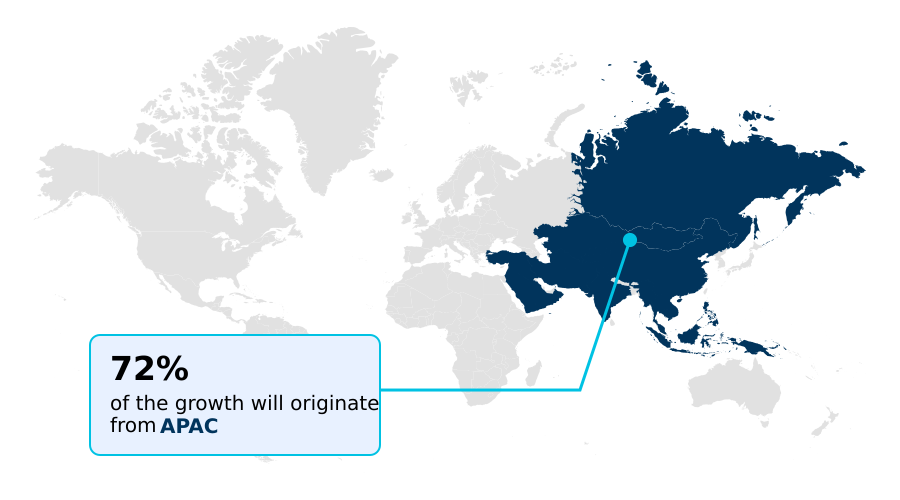
  • APAC dominated the market and accounted for a 72.5% growth during the forecast period.
  • By Application - LEDs segment was valued at USD 1.56 billion in 2024
  • By Type - 4N HPA segment accounted for the largest market revenue share in 2024

Market Size & Forecast

  • Market Opportunities: USD 12.76 billion
  • Market Future Opportunities: USD 10.45 billion
  • CAGR from 2025 to 2030 : 32.5%

Market Summary

  • The high purity alumina market is defined by its critical role in high-technology sectors. Demand is propelled by its use as a coating for the lithium-ion battery separator to ensure thermal runaway prevention in electric vehicles, as a light emitting diode substrate for energy-efficient lighting, and in semiconductor processing components that withstand corrosive environments.
  • A significant trend reshaping the industry is the pivot toward sustainable production methods, with producers exploring kaolin clay feedstock and innovative refining to reduce carbon footprints. However, achieving ultra-high purity alumina specifications involves substantial capital investment and high operational costs, a persistent challenge for market participants.
  • For a manufacturer of advanced microchips, this presents a strategic dilemma: investing in higher-cost, five-nines pure alumina for chemical mechanical planarization slurries could improve wafer yields by a few percentage points, justifying the expense, whereas a lower-grade material risks costly defects in advanced nodes.
  • This trade-off between performance, cost, and supply chain resilience, amid a push for supply chain regionalization, dictates strategic planning and investment decisions across the ecosystem, highlighting the balance required for operational expenditure reduction.

What will be the Size of the High Purity Alumina Market during the forecast period?

Get Key Insights on Market Forecast (PDF) Request Free Sample

How is the High Purity Alumina Market Segmented?

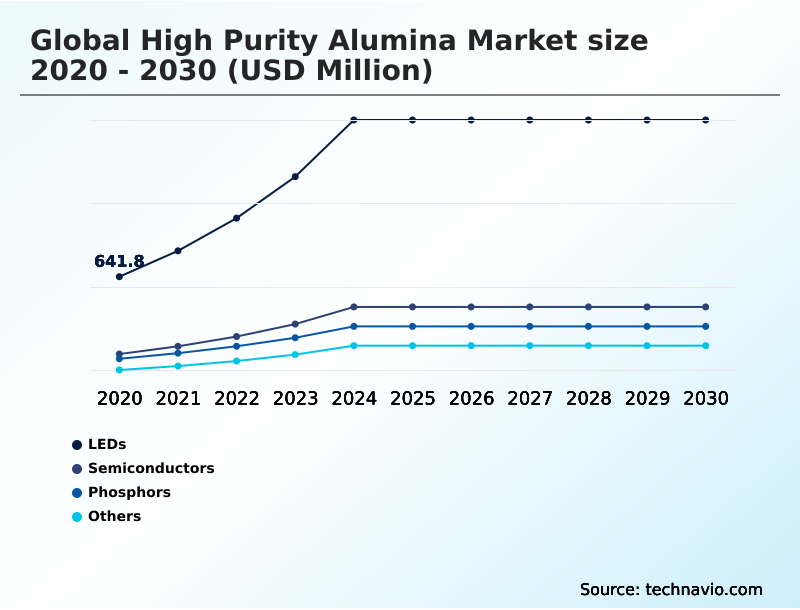
The high purity alumina industry research report provides comprehensive data (region-wise segment analysis), with forecasts and estimates in "USD million" for the period 2026-2030, as well as historical data from 2020-2024 for the following segments.

  • Application
    • LEDs
    • Semiconductors
    • Phosphors
    • Others
  • Type
    • 4N HPA
    • 5N HPA
    • 6N HPA
  • Technology
    • Hydrolysis
    • Hydrochloric acid leaching
    • Others
  • Geography
    • APAC
      • China
      • South Korea
      • Japan
    • North America
      • US
      • Canada
      • Mexico
    • Europe
      • Germany
      • France
      • UK
    • South America
      • Brazil
      • Argentina
      • Colombia
    • Middle East and Africa
      • Saudi Arabia
      • UAE
      • South Africa
    • Rest of World (ROW)

By Application Insights

The leds segment is estimated to witness significant growth during the forecast period.

The light emitting diode segment is a foundational application area, where high purity alumina serves as the primary precursor for producing synthetic sapphire substrates. This is achieved via high-temperature processes like the verneuil method or czochralski method.

The transition toward energy-efficient lighting and high-performance displays drives demand for this light emitting diode substrate. As consumer electronics evolve with micro-led display technology and the need for high-brightness leds, the requirement for pristine material for sapphire ingot growth intensifies.

The material's optical transparency and thermal stability are critical, with material customization enabling performance in advanced applications like high-frequency 5g infrastructure.

This demand for high-performance optical components has pushed the industry toward a specialty chemicals model where purity directly improves manufacturing yields, reducing downstream defects by over 20%.

Request Free Sample

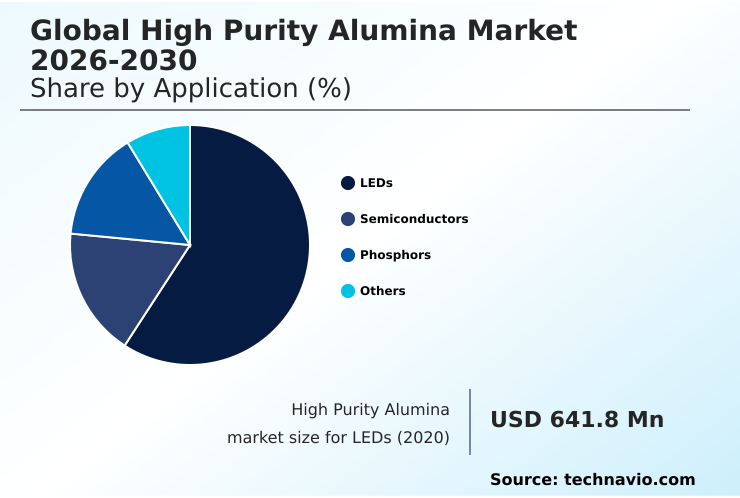
The LEDs segment was valued at USD 1.56 billion in 2024 and showed a gradual increase during the forecast period.

Request Free Sample

Regional Analysis

APAC is estimated to contribute 72.5% to the growth of the global market during the forecast period.Technavio’s analysts have elaborately explained the regional trends and drivers that shape the market during the forecast period.

See How High Purity Alumina Market Demand is Rising in APAC Request Free Sample

The APAC region dominates the geographic landscape, driven by its massive electronics and battery manufacturing sectors. Countries like China, Japan, and South Korea are epicenters for producing the ceramic separator coating essential for lithium-ion batteries.

This region accounts for over 72% of the market's incremental growth, reflecting its central role in the critical mineral supply chain. China's market is more than three times larger than Taiwan's, showcasing its scale.

The regional industry is addressing geopolitical supply risk by investing in local refining capabilities for materials used in applications from bioceramic medical implants to extreme ultraviolet lithography equipment, aligning with industrial electrification goals.

This concentration underscores APAC's influence on global supply and demand dynamics.

Market Dynamics

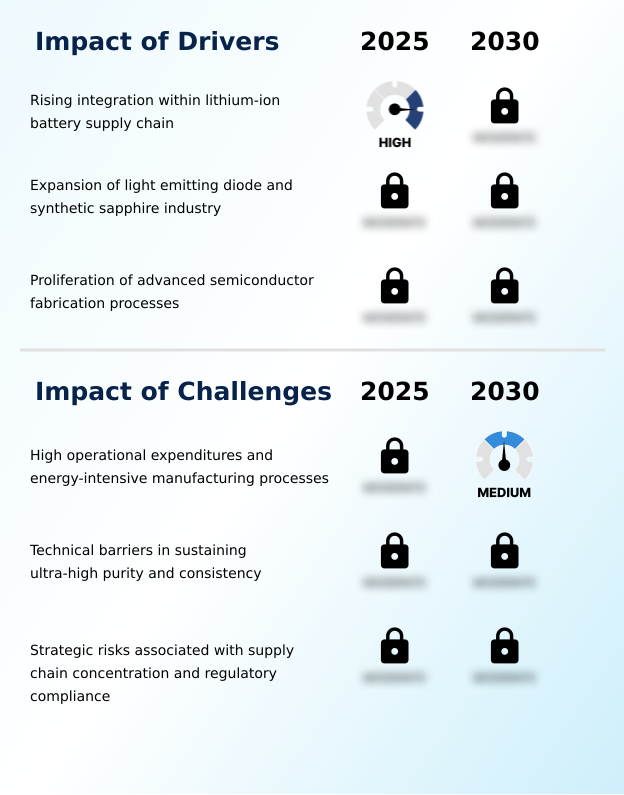
Our researchers analyzed the data with 2025 as the base year, along with the key drivers, trends, and challenges. A holistic analysis of drivers will help companies refine their marketing strategies to gain a competitive advantage.

  • The market is evolving as demand for high purity alumina for leds continues to grow, driven by energy efficiency mandates. The material's role is also central to hpa in lithium-ion batteries, where hpa coated battery separators are standard for safety, directly addressing hpa's role in thermal runaway prevention.
  • For next-generation power, hpa in solid state batteries is a key research area. The electronics industry relies on semiconductor grade alumina powder, especially low soda alumina for electronics, and uses nano alumina for cmp slurries to achieve perfect wafer finishes. The quest for higher purity is met with materials like 5n alumina for plasma etching components.
  • Producers are innovating with sustainable hpa production methods, including the hydrochloric acid leaching process hpa which uses high purity alumina from kaolin. The industry is exploring high purity alumina recycling technologies to create a circular economy. The cost of 4n high purity alumina remains a key consideration for mass-market applications, while demand for synthetic sapphire crystal growth precursors is unwavering.
  • The diverse high purity alumina market applications extend to biocompatible alumina for medical implants, transparent ceramics from high purity alumina for defense, and using spherical alumina for thermal management in electronics.
  • This complexity requires careful analysis; for instance, adopting the hydrochloric acid leaching process hpa can lower carbon emissions by over 50% compared to traditional smelting routes, a crucial metric for compliance and supply chain planning. Finally, the use of HPA as doping agents for phosphors hpa highlights its versatility.

What are the key market drivers leading to the rise in the adoption of High Purity Alumina Industry?

  • The rising integration of high purity alumina within the lithium-ion battery supply chain, driven by the needs of the electric vehicle market, serves as a primary driver for industry growth.

  • Market expansion is fundamentally driven by the material’s critical role in the green and digital transitions.
  • The proliferation of high-energy-density cells for electric vehicle battery safety relies on ceramic separator coating for the lithium-ion battery separator, which offers thermal runaway prevention by enhancing thermal stability by over 30%. This aligns with global industrial electrification goals.
  • Concurrently, the demand for light emitting diode substrate materials for high-brightness leds is unwavering.
  • In the semiconductor sector, the move to advanced process nodes requires plasma-resistant ceramics for semiconductor processing components, where ultra-pure materials are credited with improving high-yield semiconductor fabrication by reducing defect-related failures by up to 25%.

What are the market trends shaping the High Purity Alumina Industry?

  • The market is undergoing a strategic shift toward sustainable and low-carbon production methodologies. This transition is guided by environmental mandates and evolving supply chain priorities across global technology sectors.

  • A primary trend is the strategic shift toward sustainable and low-carbon production of specialty alumina chemicals, utilizing feedstocks like aluminous chemical byproducts instead of energy-intensive primary aluminum. These innovative refining pathways can reduce electricity consumption by up to 70% compared to legacy methods. Simultaneously, demand for specialized particle characteristics is reshaping the industry.
  • Advanced ceramic materials with controlled morphology, such as spherical particles, improve packing density by over 15% in coatings. This raw material diversification and focus on inorganic material science extends to nano-structuring for applications from bioceramic medical implants to quantum computing components and improving wafer surface planarity in chemical mechanical planarization.

What challenges does the High Purity Alumina Industry face during its growth?

  • High operational expenditures coupled with energy-intensive manufacturing processes represent a key challenge that affects the industry's growth and profitability.

  • Key challenges temper market growth, led by high operational expenditures and technical complexity. The processes for achieving ultra-high purity alumina, such as hydrochloric acid leaching or solvent extraction purification, are capital-intensive, with energy costs often representing over 40% of the total production outlay, complicating operational expenditure reduction goals.
  • Maintaining purity is a technical hurdle; trace impurity contamination at the parts-per-billion level can cause catastrophic device failure, reducing yields by more than 50% in sensitive applications.
  • Furthermore, the critical mineral supply chain faces geopolitical supply risk, with a significant portion of refining capacity concentrated in a few regions, which complicates efforts toward supply chain regionalization and ensuring stable supply lines.

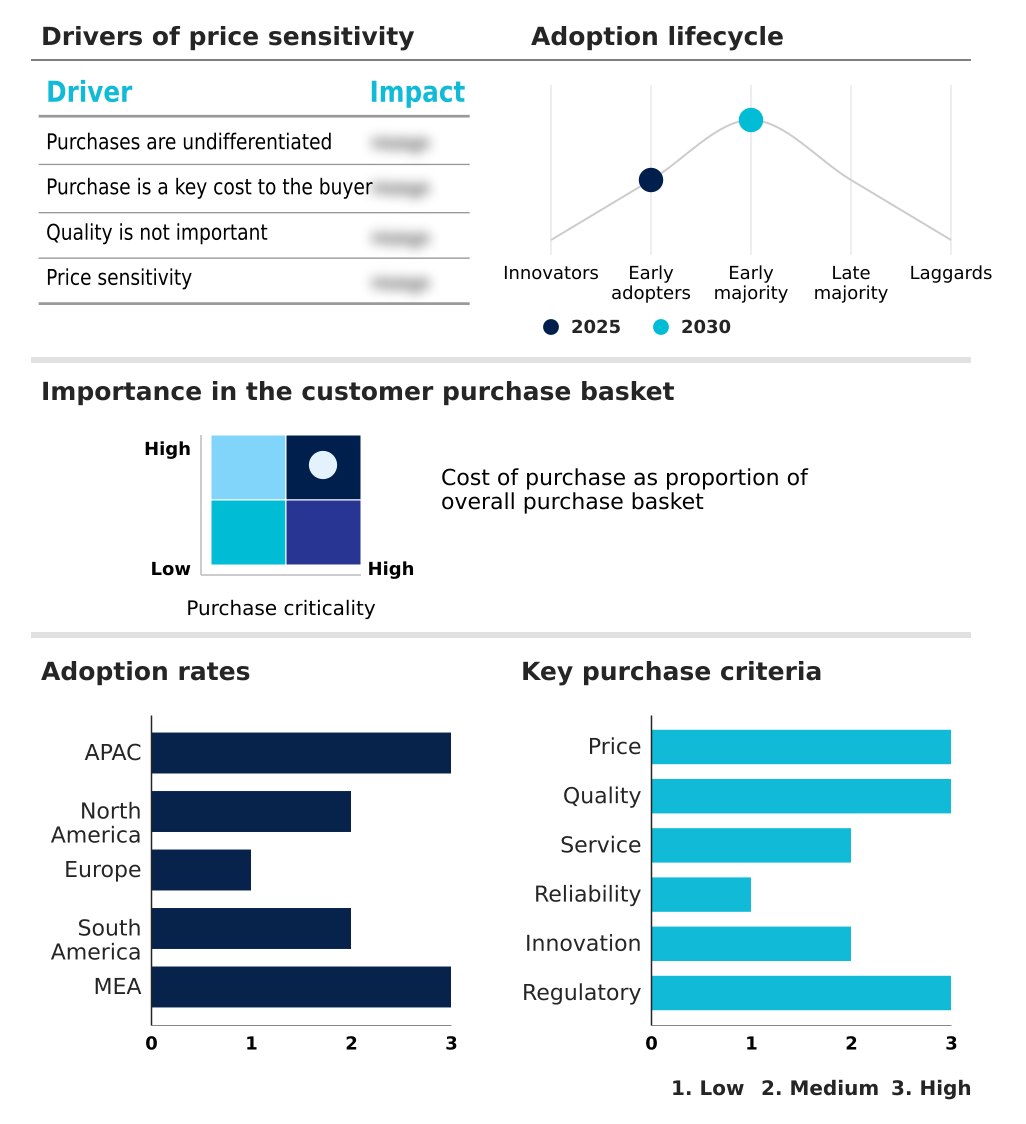
Exclusive Technavio Analysis on Customer Landscape

The high purity alumina market forecasting report includes the adoption lifecycle of the market, covering from the innovator’s stage to the laggard’s stage. It focuses on adoption rates in different regions based on penetration. Furthermore, the high purity alumina market report also includes key purchase criteria and drivers of price sensitivity to help companies evaluate and develop their market growth analysis strategies.

Customer Landscape of High Purity Alumina Industry

Competitive Landscape

Companies are implementing various strategies, such as strategic alliances, high purity alumina market forecast, partnerships, mergers and acquisitions, geographical expansion, and product/service launches, to enhance their presence in the industry.

AEM High Purity Alumina - Specializes in producing ultra-high purity alumina grades tailored for critical, high-performance technological applications demanding stringent material specifications.

The industry research and growth report includes detailed analyses of the competitive landscape of the market and information about key companies, including:

  • AEM High Purity Alumina
  • ALB Materials Inc.
  • Alcoa Corp.
  • American Elements
  • Baikowski SA
  • Cabot Corp.
  • Compagnie de Saint Gobain SA
  • Denka Co. Ltd.
  • Evonik Industries AG
  • Inframat Corp.
  • Merck KGaA
  • Nippon Light Metal Holdings
  • Polar Sapphire Ltd.
  • Resonac Holdings Corp.
  • Sasol Ltd.
  • Stanford Advanced Materials
  • Sumitomo Chemical Co. Ltd.
  • Taimei Chemicals Co. Ltd.
  • Thermo Fisher Scientific Inc.
  • Zibo Honghe Chemical Co. Ltd.

Qualitative and quantitative analysis of companies has been conducted to help clients understand the wider business environment as well as the strengths and weaknesses of key industry players. Data is qualitatively analyzed to categorize companies as pure play, category-focused, industry-focused, and diversified; it is quantitatively analyzed to categorize companies as dominant, leading, strong, tentative, and weak.

Recent Development and News in High purity alumina market

  • In April, 2025, Alpha HPA finalized a long-term supply agreement with a major European electric vehicle battery manufacturer, securing the provision of high purity alumina for critical separator coating applications.
  • In August, 2025, Altech Batteries Limited announced the successful construction of its pilot plant in Saxony, Germany, a facility designed to produce high purity alumina-coated silicon anodes to support the European automotive sector.
  • In September, 2025, Alpha HPA achieved the successful commencement of the first commercial-scale production cycle at its newly expanded high purity alumina refinery in Queensland, Australia, mitigating risks associated with supply chain concentration.
  • In September, 2025, Nippon Light Metal Holdings Company Limited introduced a refined purification sequence at its research center, aiming to reduce the environmental impact of aluminum hydrate processing and enhance production sustainability.

Dive into Technavio’s robust research methodology, blending expert interviews, extensive data synthesis, and validated models for unparalleled High Purity Alumina Market insights. See full methodology.

Market Scope
Page number 308
Base year 2025
Historic period 2020-2024
Forecast period 2026-2030
Growth momentum & CAGR Accelerate at a CAGR of 32.5%
Market growth 2026-2030 USD 10452.1 million
Market structure Fragmented
YoY growth 2025-2026(%) 30.5%
Key countries China, Taiwan, South Korea, Japan, India, Australia, US, Canada, Mexico, Germany, France, UK, The Netherlands, Italy, Spain, Brazil, Argentina, Colombia, Saudi Arabia, UAE, South Africa, Egypt and Turkey
Competitive landscape Leading Companies, Market Positioning of Companies, Competitive Strategies, and Industry Risks

Request Free Sample

Research Analyst Overview

  • The market for ultra-high purity alumina is defined by its critical role in advanced manufacturing, where materials like 4n high purity alumina and 5n high purity alumina are essential.
  • Its applications span from being a light emitting diode substrate made from synthetic sapphire substrate grown via the verneuil method or czochralski method, to being a key part of the lithium-ion battery separator. The use of a ceramic separator coating offers thermal runaway prevention, a non-negotiable for modern batteries, including future solid-state battery electrolyte designs.
  • In electronics, semiconductor processing components and plasma-resistant ceramics rely on its purity, especially for extreme ultraviolet lithography and micro-led display technology. For a boardroom deliberating on capital expenditure, the decision to invest in low-carbon alumina production using hydrochloric acid leaching of kaolin clay feedstock over traditional bayer process refinement or aluminum alkoxide hydrolysis is now a strategic imperative.
  • This shift, driven by ESG targets, can reduce energy consumption by over 40%, securing a competitive advantage despite initial costs. The material's versatility is seen in chemical mechanical planarization slurries, phosphor host lattice structures, and even bioceramic medical implants, showcasing inorganic material science innovation with specialty alumina chemicals and advanced ceramic materials.
  • Producers are now focused on particle morphology control to create spherical alumina particles and nano-structured alumina powder from feedstocks like aluminous chemical byproducts, expanding the use of transparent alumina ceramic and high-k dielectric material, while managing the critical mineral supply chain.
  • The precision needed for sapphire ingot growth and creating sub-micron alumina particles through methods like solvent extraction purification underscores the market's technical complexity.

What are the Key Data Covered in this High Purity Alumina Market Research and Growth Report?

  • What is the expected growth of the High Purity Alumina Market between 2026 and 2030?

    • USD 10.45 billion, at a CAGR of 32.5%

  • What segmentation does the market report cover?

    • The report is segmented by Application (LEDs, Semiconductors, Phosphors, and Others), Type (4N HPA, 5N HPA, and 6N HPA), Technology (Hydrolysis, Hydrochloric acid leaching, and Others) and Geography (APAC, North America, Europe, South America, Middle East and Africa)

  • Which regions are analyzed in the report?

    • APAC, North America, Europe, South America and Middle East and Africa

  • What are the key growth drivers and market challenges?

    • Rising integration within lithium-ion battery supply chain, High operational expenditures and energy-intensive manufacturing processes

  • Who are the major players in the High Purity Alumina Market?

    • AEM High Purity Alumina, ALB Materials Inc., Alcoa Corp., American Elements, Baikowski SA, Cabot Corp., Compagnie de Saint Gobain SA, Denka Co. Ltd., Evonik Industries AG, Inframat Corp., Merck KGaA, Nippon Light Metal Holdings, Polar Sapphire Ltd., Resonac Holdings Corp., Sasol Ltd., Stanford Advanced Materials, Sumitomo Chemical Co. Ltd., Taimei Chemicals Co. Ltd., Thermo Fisher Scientific Inc. and Zibo Honghe Chemical Co. Ltd.

Market Research Insights

  • The market's dynamic nature is shaped by the rigorous demands of high-tech industries. A focus on electric vehicle battery safety has made high purity alumina coatings essential, achieving over a 95% reduction in separator shrinkage during thermal stress tests. This thermal stability enhancement is paramount.
  • In parallel, the push toward advanced process nodes in semiconductor manufacturing necessitates ultra-pure materials to support high-yield semiconductor fabrication, with some processes showing a 15% decrease in wafer defects. These technical demands are set against a backdrop of strategic supply chain regionalization and raw material diversification to mitigate geopolitical risks and ensure stable supply for critical end-users.

We can help! Our analysts can customize this high purity alumina market research report to meet your requirements.

Get in touch

1. Executive Summary

1.1 Market overview

Executive Summary - Chart on Market Overview
Executive Summary - Data Table on Market Overview
Executive Summary - Chart on Global Market Characteristics
Executive Summary - Chart on Market by Geography
Executive Summary - Chart on Market Segmentation by Application
Executive Summary - Chart on Market Segmentation by Type
Executive Summary - Chart on Market Segmentation by Technology
Executive Summary - Chart on Incremental Growth
Executive Summary - Data Table on Incremental Growth
Executive Summary - Chart on Company Market Positioning

2. Technavio Analysis

2.1 Analysis of price sensitivity, lifecycle, customer purchase basket, adoption rates, and purchase criteria

2.2 Criticality of inputs and Factors of differentiation

Chart on Overview on criticality of inputs and factors of differentiation

2.3 Factors of disruption

Chart on Overview on factors of disruption

2.4 Impact of drivers and challenges

Chart on Impact of drivers and challenges in 2025 and 2030

3. Market Landscape

3.1 Market ecosystem

Chart on Parent Market
Data Table on - Parent Market

3.2 Market characteristics

Chart on Market characteristics analysis

3.3 Value chain analysis

Chart on Value chain analysis

4. Market Sizing

4.1 Market definition

Data Table on Offerings of companies included in the market definition

4.2 Market segment analysis

Market segments

4.3 Market size 2025

4.4 Market outlook: Forecast for 2025-2030

Chart on Global - Market size and forecast 2025-2030 ($ million)
Data Table on Global - Market size and forecast 2025-2030 ($ million)
Chart on Global Market: Year-over-year growth 2025-2030 (%)
Data Table on Global Market: Year-over-year growth 2025-2030 (%)

5. Historic Market Size

5.1 Global High Purity Alumina Market 2020 - 2024

Historic Market Size - Data Table on Global High Purity Alumina Market 2020 - 2024 ($ million)

5.2 Application segment analysis 2020 - 2024

Historic Market Size - Application Segment 2020 - 2024 ($ million)

5.3 Type segment analysis 2020 - 2024

Historic Market Size - Type Segment 2020 - 2024 ($ million)

5.4 Technology segment analysis 2020 - 2024

Historic Market Size - Technology Segment 2020 - 2024 ($ million)

5.5 Geography segment analysis 2020 - 2024

Historic Market Size - Geography Segment 2020 - 2024 ($ million)

5.6 Country segment analysis 2020 - 2024

Historic Market Size - Country Segment 2020 - 2024 ($ million)

6. Qualitative Analysis

6.1 Impact of AI on Global High Purity Alumina Market

6.2 Impact of geopolitical conflicts on Global High Purity Alumina Market

7. Five Forces Analysis

7.1 Five forces summary

Five forces analysis - Comparison between 2025 and 2030

7.2 Bargaining power of buyers

Bargaining power of buyers - Impact of key factors 2025 and 2030

7.3 Bargaining power of suppliers

Bargaining power of suppliers - Impact of key factors in 2025 and 2030

7.4 Threat of new entrants

Threat of new entrants - Impact of key factors in 2025 and 2030

7.5 Threat of substitutes

Threat of substitutes - Impact of key factors in 2025 and 2030

7.6 Threat of rivalry

Threat of rivalry - Impact of key factors in 2025 and 2030

7.7 Market condition

Chart on Market condition - Five forces 2025 and 2030

8. Market Segmentation by Application

8.1 Market segments

Chart on Application - Market share 2025-2030 (%)
Data Table on Application - Market share 2025-2030 (%)

8.2 Comparison by Application

Chart on Comparison by Application
Data Table on Comparison by Application

8.3 LEDs - Market size and forecast 2025-2030

Chart on LEDs - Market size and forecast 2025-2030 ($ million)
Data Table on LEDs - Market size and forecast 2025-2030 ($ million)
Chart on LEDs - Year-over-year growth 2025-2030 (%)
Data Table on LEDs - Year-over-year growth 2025-2030 (%)

8.4 Semiconductors - Market size and forecast 2025-2030

Chart on Semiconductors - Market size and forecast 2025-2030 ($ million)
Data Table on Semiconductors - Market size and forecast 2025-2030 ($ million)
Chart on Semiconductors - Year-over-year growth 2025-2030 (%)
Data Table on Semiconductors - Year-over-year growth 2025-2030 (%)

8.5 Phosphors - Market size and forecast 2025-2030

Chart on Phosphors - Market size and forecast 2025-2030 ($ million)
Data Table on Phosphors - Market size and forecast 2025-2030 ($ million)
Chart on Phosphors - Year-over-year growth 2025-2030 (%)
Data Table on Phosphors - Year-over-year growth 2025-2030 (%)

8.6 Others - Market size and forecast 2025-2030

Chart on Others - Market size and forecast 2025-2030 ($ million)
Data Table on Others - Market size and forecast 2025-2030 ($ million)
Chart on Others - Year-over-year growth 2025-2030 (%)
Data Table on Others - Year-over-year growth 2025-2030 (%)

8.7 Market opportunity by Application

Market opportunity by Application ($ million)
Data Table on Market opportunity by Application ($ million)

9. Market Segmentation by Type

9.1 Market segments

Chart on Type - Market share 2025-2030 (%)
Data Table on Type - Market share 2025-2030 (%)

9.2 Comparison by Type

Chart on Comparison by Type
Data Table on Comparison by Type

9.3 4N HPA - Market size and forecast 2025-2030

Chart on 4N HPA - Market size and forecast 2025-2030 ($ million)
Data Table on 4N HPA - Market size and forecast 2025-2030 ($ million)
Chart on 4N HPA - Year-over-year growth 2025-2030 (%)
Data Table on 4N HPA - Year-over-year growth 2025-2030 (%)

9.4 5N HPA - Market size and forecast 2025-2030

Chart on 5N HPA - Market size and forecast 2025-2030 ($ million)
Data Table on 5N HPA - Market size and forecast 2025-2030 ($ million)
Chart on 5N HPA - Year-over-year growth 2025-2030 (%)
Data Table on 5N HPA - Year-over-year growth 2025-2030 (%)

9.5 6N HPA - Market size and forecast 2025-2030

Chart on 6N HPA - Market size and forecast 2025-2030 ($ million)
Data Table on 6N HPA - Market size and forecast 2025-2030 ($ million)
Chart on 6N HPA - Year-over-year growth 2025-2030 (%)
Data Table on 6N HPA - Year-over-year growth 2025-2030 (%)

9.6 Market opportunity by Type

Market opportunity by Type ($ million)
Data Table on Market opportunity by Type ($ million)

10. Market Segmentation by Technology

10.1 Market segments

Chart on Technology - Market share 2025-2030 (%)
Data Table on Technology - Market share 2025-2030 (%)

10.2 Comparison by Technology

Chart on Comparison by Technology
Data Table on Comparison by Technology

10.3 Hydrolysis - Market size and forecast 2025-2030

Chart on Hydrolysis - Market size and forecast 2025-2030 ($ million)
Data Table on Hydrolysis - Market size and forecast 2025-2030 ($ million)
Chart on Hydrolysis - Year-over-year growth 2025-2030 (%)
Data Table on Hydrolysis - Year-over-year growth 2025-2030 (%)

10.4 Hydrochloric acid leaching - Market size and forecast 2025-2030

Chart on Hydrochloric acid leaching - Market size and forecast 2025-2030 ($ million)
Data Table on Hydrochloric acid leaching - Market size and forecast 2025-2030 ($ million)
Chart on Hydrochloric acid leaching - Year-over-year growth 2025-2030 (%)
Data Table on Hydrochloric acid leaching - Year-over-year growth 2025-2030 (%)

10.5 Others - Market size and forecast 2025-2030

Chart on Others - Market size and forecast 2025-2030 ($ million)
Data Table on Others - Market size and forecast 2025-2030 ($ million)
Chart on Others - Year-over-year growth 2025-2030 (%)
Data Table on Others - Year-over-year growth 2025-2030 (%)

10.6 Market opportunity by Technology

Market opportunity by Technology ($ million)
Data Table on Market opportunity by Technology ($ million)

11. Customer Landscape

11.1 Customer landscape overview

Analysis of price sensitivity, lifecycle, customer purchase basket, adoption rates, and purchase criteria

12. Geographic Landscape

12.1 Geographic segmentation

Chart on Market share by geography 2025-2030 (%)
Data Table on Market share by geography 2025-2030 (%)

12.2 Geographic comparison

Chart on Geographic comparison
Data Table on Geographic comparison

12.3 APAC - Market size and forecast 2025-2030

Chart on APAC - Market size and forecast 2025-2030 ($ million)
Data Table on APAC - Market size and forecast 2025-2030 ($ million)
Chart on APAC - Year-over-year growth 2025-2030 (%)
Data Table on APAC - Year-over-year growth 2025-2030 (%)
Chart on Regional Comparison - APAC
Data Table on Regional Comparison - APAC

12.3.1 China - Market size and forecast 2025-2030

Chart on China - Market size and forecast 2025-2030 ($ million)
Data Table on China - Market size and forecast 2025-2030 ($ million)
Chart on China - Year-over-year growth 2025-2030 (%)
Data Table on China - Year-over-year growth 2025-2030 (%)

12.3.2 Taiwan - Market size and forecast 2025-2030

Chart on Taiwan - Market size and forecast 2025-2030 ($ million)
Data Table on Taiwan - Market size and forecast 2025-2030 ($ million)
Chart on Taiwan - Year-over-year growth 2025-2030 (%)
Data Table on Taiwan - Year-over-year growth 2025-2030 (%)

12.3.3 South Korea - Market size and forecast 2025-2030

Chart on South Korea - Market size and forecast 2025-2030 ($ million)
Data Table on South Korea - Market size and forecast 2025-2030 ($ million)
Chart on South Korea - Year-over-year growth 2025-2030 (%)
Data Table on South Korea - Year-over-year growth 2025-2030 (%)

12.3.4 Japan - Market size and forecast 2025-2030

Chart on Japan - Market size and forecast 2025-2030 ($ million)
Data Table on Japan - Market size and forecast 2025-2030 ($ million)
Chart on Japan - Year-over-year growth 2025-2030 (%)
Data Table on Japan - Year-over-year growth 2025-2030 (%)

12.3.5 India - Market size and forecast 2025-2030

Chart on India - Market size and forecast 2025-2030 ($ million)
Data Table on India - Market size and forecast 2025-2030 ($ million)
Chart on India - Year-over-year growth 2025-2030 (%)
Data Table on India - Year-over-year growth 2025-2030 (%)

12.3.6 Australia - Market size and forecast 2025-2030

Chart on Australia - Market size and forecast 2025-2030 ($ million)
Data Table on Australia - Market size and forecast 2025-2030 ($ million)
Chart on Australia - Year-over-year growth 2025-2030 (%)
Data Table on Australia - Year-over-year growth 2025-2030 (%)

12.4 North America - Market size and forecast 2025-2030

Chart on North America - Market size and forecast 2025-2030 ($ million)
Data Table on North America - Market size and forecast 2025-2030 ($ million)
Chart on North America - Year-over-year growth 2025-2030 (%)
Data Table on North America - Year-over-year growth 2025-2030 (%)
Chart on Regional Comparison - North America
Data Table on Regional Comparison - North America

12.4.1 US - Market size and forecast 2025-2030

Chart on US - Market size and forecast 2025-2030 ($ million)
Data Table on US - Market size and forecast 2025-2030 ($ million)
Chart on US - Year-over-year growth 2025-2030 (%)
Data Table on US - Year-over-year growth 2025-2030 (%)

12.4.2 Canada - Market size and forecast 2025-2030

Chart on Canada - Market size and forecast 2025-2030 ($ million)
Data Table on Canada - Market size and forecast 2025-2030 ($ million)
Chart on Canada - Year-over-year growth 2025-2030 (%)
Data Table on Canada - Year-over-year growth 2025-2030 (%)

12.4.3 Mexico - Market size and forecast 2025-2030

Chart on Mexico - Market size and forecast 2025-2030 ($ million)
Data Table on Mexico - Market size and forecast 2025-2030 ($ million)
Chart on Mexico - Year-over-year growth 2025-2030 (%)
Data Table on Mexico - Year-over-year growth 2025-2030 (%)

12.5 Europe - Market size and forecast 2025-2030

Chart on Europe - Market size and forecast 2025-2030 ($ million)
Data Table on Europe - Market size and forecast 2025-2030 ($ million)
Chart on Europe - Year-over-year growth 2025-2030 (%)
Data Table on Europe - Year-over-year growth 2025-2030 (%)
Chart on Regional Comparison - Europe
Data Table on Regional Comparison - Europe

12.5.1 Germany - Market size and forecast 2025-2030

Chart on Germany - Market size and forecast 2025-2030 ($ million)
Data Table on Germany - Market size and forecast 2025-2030 ($ million)
Chart on Germany - Year-over-year growth 2025-2030 (%)
Data Table on Germany - Year-over-year growth 2025-2030 (%)

12.5.2 France - Market size and forecast 2025-2030

Chart on France - Market size and forecast 2025-2030 ($ million)
Data Table on France - Market size and forecast 2025-2030 ($ million)
Chart on France - Year-over-year growth 2025-2030 (%)
Data Table on France - Year-over-year growth 2025-2030 (%)

12.5.3 UK - Market size and forecast 2025-2030

Chart on UK - Market size and forecast 2025-2030 ($ million)
Data Table on UK - Market size and forecast 2025-2030 ($ million)
Chart on UK - Year-over-year growth 2025-2030 (%)
Data Table on UK - Year-over-year growth 2025-2030 (%)

12.5.4 The Netherlands - Market size and forecast 2025-2030

Chart on The Netherlands - Market size and forecast 2025-2030 ($ million)
Data Table on The Netherlands - Market size and forecast 2025-2030 ($ million)
Chart on The Netherlands - Year-over-year growth 2025-2030 (%)
Data Table on The Netherlands - Year-over-year growth 2025-2030 (%)

12.5.5 Italy - Market size and forecast 2025-2030

Chart on Italy - Market size and forecast 2025-2030 ($ million)
Data Table on Italy - Market size and forecast 2025-2030 ($ million)
Chart on Italy - Year-over-year growth 2025-2030 (%)
Data Table on Italy - Year-over-year growth 2025-2030 (%)

12.5.6 Spain - Market size and forecast 2025-2030

Chart on Spain - Market size and forecast 2025-2030 ($ million)
Data Table on Spain - Market size and forecast 2025-2030 ($ million)
Chart on Spain - Year-over-year growth 2025-2030 (%)
Data Table on Spain - Year-over-year growth 2025-2030 (%)

12.6 South America - Market size and forecast 2025-2030

Chart on South America - Market size and forecast 2025-2030 ($ million)
Data Table on South America - Market size and forecast 2025-2030 ($ million)
Chart on South America - Year-over-year growth 2025-2030 (%)
Data Table on South America - Year-over-year growth 2025-2030 (%)
Chart on Regional Comparison - South America
Data Table on Regional Comparison - South America

12.6.1 Brazil - Market size and forecast 2025-2030

Chart on Brazil - Market size and forecast 2025-2030 ($ million)
Data Table on Brazil - Market size and forecast 2025-2030 ($ million)
Chart on Brazil - Year-over-year growth 2025-2030 (%)
Data Table on Brazil - Year-over-year growth 2025-2030 (%)

12.6.2 Argentina - Market size and forecast 2025-2030

Chart on Argentina - Market size and forecast 2025-2030 ($ million)
Data Table on Argentina - Market size and forecast 2025-2030 ($ million)
Chart on Argentina - Year-over-year growth 2025-2030 (%)
Data Table on Argentina - Year-over-year growth 2025-2030 (%)

12.6.3 Colombia - Market size and forecast 2025-2030

Chart on Colombia - Market size and forecast 2025-2030 ($ million)
Data Table on Colombia - Market size and forecast 2025-2030 ($ million)
Chart on Colombia - Year-over-year growth 2025-2030 (%)
Data Table on Colombia - Year-over-year growth 2025-2030 (%)

12.7 Middle East and Africa - Market size and forecast 2025-2030

Chart on Middle East and Africa - Market size and forecast 2025-2030 ($ million)
Data Table on Middle East and Africa - Market size and forecast 2025-2030 ($ million)
Chart on Middle East and Africa - Year-over-year growth 2025-2030 (%)
Data Table on Middle East and Africa - Year-over-year growth 2025-2030 (%)
Chart on Regional Comparison - Middle East and Africa
Data Table on Regional Comparison - Middle East and Africa

12.7.1 Saudi Arabia - Market size and forecast 2025-2030

Chart on Saudi Arabia - Market size and forecast 2025-2030 ($ million)
Data Table on Saudi Arabia - Market size and forecast 2025-2030 ($ million)
Chart on Saudi Arabia - Year-over-year growth 2025-2030 (%)
Data Table on Saudi Arabia - Year-over-year growth 2025-2030 (%)

12.7.2 UAE - Market size and forecast 2025-2030

Chart on UAE - Market size and forecast 2025-2030 ($ million)
Data Table on UAE - Market size and forecast 2025-2030 ($ million)
Chart on UAE - Year-over-year growth 2025-2030 (%)
Data Table on UAE - Year-over-year growth 2025-2030 (%)

12.7.3 South Africa - Market size and forecast 2025-2030

Chart on South Africa - Market size and forecast 2025-2030 ($ million)
Data Table on South Africa - Market size and forecast 2025-2030 ($ million)
Chart on South Africa - Year-over-year growth 2025-2030 (%)
Data Table on South Africa - Year-over-year growth 2025-2030 (%)

12.7.4 Egypt - Market size and forecast 2025-2030

Chart on Egypt - Market size and forecast 2025-2030 ($ million)
Data Table on Egypt - Market size and forecast 2025-2030 ($ million)
Chart on Egypt - Year-over-year growth 2025-2030 (%)
Data Table on Egypt - Year-over-year growth 2025-2030 (%)

12.7.5 Turkey - Market size and forecast 2025-2030

Chart on Turkey - Market size and forecast 2025-2030 ($ million)
Data Table on Turkey - Market size and forecast 2025-2030 ($ million)
Chart on Turkey - Year-over-year growth 2025-2030 (%)
Data Table on Turkey - Year-over-year growth 2025-2030 (%)

12.8 Market opportunity by geography

Market opportunity by geography ($ million)
Data Tables on Market opportunity by geography ($ million)

13. Drivers, Challenges, and Opportunity

13.1 Market drivers

Rising integration within lithium-ion battery supply chain
Expansion of light emitting diode and synthetic sapphire industry
Proliferation of advanced semiconductor fabrication processes

13.2 Market challenges

High operational expenditures and energy-intensive manufacturing processes
Technical barriers in sustaining ultra-high purity and consistency
Strategic risks associated with supply chain concentration and regulatory compliance

13.3 Impact of drivers and challenges

Impact of drivers and challenges in 2025 and 2030

13.4 Market opportunities

Strategic shift toward sustainable and low-carbon production methodologies
Advancements in particle morphology and nano-structuring for high-performance applications
Regionalization of supply chains and rise of integrated refining facilities

14. Competitive Landscape

14.1 Overview

14.2

Overview on criticality of inputs and factors of differentiation

14.3 Landscape disruption

Overview on factors of disruption

14.4 Industry risks

Impact of key risks on business

15. Competitive Analysis

15.1 Companies profiled

Companies covered

15.2 Company ranking index

15.3 Market positioning of companies

Matrix on companies position and classification

15.4 ALB Materials Inc.

ALB Materials Inc. - Overview
ALB Materials Inc. - Product / Service
ALB Materials Inc. - Key offerings
SWOT

15.5 Alcoa Corp.

Alcoa Corp. - Overview
Alcoa Corp. - Business segments
Alcoa Corp. - Key news
Alcoa Corp. - Key offerings
Alcoa Corp. - Segment focus
SWOT

15.6 American Elements

American Elements - Overview
American Elements - Product / Service
American Elements - Key offerings
SWOT

15.7 Baikowski SA

Baikowski SA - Overview
Baikowski SA - Product / Service
Baikowski SA - Key offerings
SWOT

15.8 Cabot Corp.

Cabot Corp. - Overview
Cabot Corp. - Business segments
Cabot Corp. - Key news
Cabot Corp. - Key offerings
Cabot Corp. - Segment focus
SWOT

15.9 Compagnie de Saint Gobain SA

Compagnie de Saint Gobain SA - Overview
Compagnie de Saint Gobain SA - Business segments
Compagnie de Saint Gobain SA - Key offerings
Compagnie de Saint Gobain SA - Segment focus
SWOT

15.10 Denka Co. Ltd.

Denka Co. Ltd. - Overview
Denka Co. Ltd. - Business segments
Denka Co. Ltd. - Key offerings
Denka Co. Ltd. - Segment focus
SWOT

15.11 Evonik Industries AG

Evonik Industries AG - Overview
Evonik Industries AG - Business segments
Evonik Industries AG - Key offerings
Evonik Industries AG - Segment focus
SWOT

15.12 Merck KGaA

Merck KGaA - Overview
Merck KGaA - Business segments
Merck KGaA - Key news
Merck KGaA - Key offerings
Merck KGaA - Segment focus
SWOT

15.13 Nippon Light Metal Holdings

Nippon Light Metal Holdings - Overview
Nippon Light Metal Holdings - Product / Service
Nippon Light Metal Holdings - Key offerings
SWOT

15.14 Resonac Holdings Corp.

Resonac Holdings Corp. - Overview
Resonac Holdings Corp. - Business segments
Resonac Holdings Corp. - Key offerings
Resonac Holdings Corp. - Segment focus
SWOT

15.15 Stanford Advanced Materials

Stanford Advanced Materials - Overview
Stanford Advanced Materials - Product / Service
Stanford Advanced Materials - Key offerings
SWOT

15.16 Sumitomo Chemical Co. Ltd.

Sumitomo Chemical Co. Ltd. - Overview
Sumitomo Chemical Co. Ltd. - Business segments
Sumitomo Chemical Co. Ltd. - Key offerings
Sumitomo Chemical Co. Ltd. - Segment focus
SWOT

15.17 Taimei Chemicals Co. Ltd.

Taimei Chemicals Co. Ltd. - Overview
Taimei Chemicals Co. Ltd. - Product / Service
Taimei Chemicals Co. Ltd. - Key offerings
SWOT

15.18 Thermo Fisher Scientific Inc.

Thermo Fisher Scientific Inc. - Overview
Thermo Fisher Scientific Inc. - Business segments
Thermo Fisher Scientific Inc. - Key news
Thermo Fisher Scientific Inc. - Key offerings
Thermo Fisher Scientific Inc. - Segment focus
SWOT

16. Appendix

16.1 Scope of the report

Market definition
Objectives
Notes and caveats

16.2 Inclusions and exclusions checklist

Inclusions checklist
Exclusions checklist

16.3 Currency conversion rates for US$

16.4 Research methodology

16.5 Data procurement

Information sources

16.6 Data validation

16.7 Validation techniques employed for market sizing

16.8 Data synthesis

16.9 360 degree market analysis

16.10 List of abbreviations

Research Methodology

Technavio presents a detailed picture of the market by way of study, synthesis, and summation of data from multiple sources. The analysts have presented the various facets of the market with a particular focus on identifying the key industry influencers. The data thus presented is comprehensive, reliable, and the result of extensive research, both primary and secondary.

INFORMATION SOURCES

Primary sources

  • Manufacturers and suppliers
  • Channel partners
  • Industry experts
  • Strategic decision makers

Secondary sources

  • Industry journals and periodicals
  • Government data
  • Financial reports of key industry players
  • Historical data
  • Press releases

DATA ANALYSIS

Data Synthesis

  • Collation of data
  • Estimation of key figures
  • Analysis of derived insights

Data Validation

  • Triangulation with data models
  • Reference against proprietary databases
  • Corroboration with industry experts

REPORT WRITING

Qualitative

  • Market drivers
  • Market challenges
  • Market trends
  • Five forces analysis

Quantitative

  • Market size and forecast
  • Market segmentation
  • Geographical insights
  • Competitive landscape

Interested in this report?

Get your sample now to see our research methodology and insights!

Download Now

Frequently Asked Questions

High Purity Alumina market growth will increase by USD 10452.1 million during 2026-2030.

The High Purity Alumina market is expected to grow at a CAGR of 32.5% during 2026-2030.

High Purity Alumina market is segmented by Application (LEDs, Semiconductors, Phosphors, Others) Type (4N HPA, 5N HPA, 6N HPA) Technology (Hydrolysis, Hydrochloric acid leaching, Others)

AEM High Purity Alumina, ALB Materials Inc., Alcoa Corp., American Elements, Baikowski SA, Cabot Corp., Compagnie de Saint Gobain SA, Denka Co. Ltd., Evonik Industries AG, Inframat Corp., Merck KGaA, Nippon Light Metal Holdings, Polar Sapphire Ltd., Resonac Holdings Corp., Sasol Ltd., Stanford Advanced Materials, Sumitomo Chemical Co. Ltd., Taimei Chemicals Co. Ltd., Thermo Fisher Scientific Inc., Zibo Honghe Chemical Co. Ltd. are a few of the key vendors in the High Purity Alumina market.

APAC will register the highest growth rate of 72.5% among the other regions. Therefore, the High Purity Alumina market in APAC is expected to garner significant business opportunities for the vendors during the forecast period.

China, Taiwan, South Korea, Japan, India, Australia, US, Canada, Mexico, Germany, France, UK, The Netherlands, Italy, Spain, Brazil, Argentina, Colombia, Saudi Arabia, UAE, South Africa, Egypt, Turkey

  • Rising integration within lithium-ion battery supply chain is the driving factor this market.

The High Purity Alumina market vendors should focus on grabbing business opportunities from the Application segment as it accounted for the largest market share in the base year.
RIA - Research AI Assistant
Ask RIA