Agricultural Films Market Analysis, Size, and Forecast 2026-2030: APAC (China, India, and Japan), North America (US, Canada, and Mexico), Europe (Spain, France, and Germany), South America (Brazil and Argentina), Middle East and Africa (South Africa, UAE, and Turkey), and Rest of World (ROW)

Agricultural Films Market Analysis, Size, and Forecast 2026-2030:
APAC (China, India, and Japan), North America (US, Canada, and Mexico), Europe (Spain, France, and Germany), South America (Brazil and Argentina), Middle East and Africa (South Africa, UAE, and Turkey), and Rest of World (ROW)

Published: May 2026 300 Pages SKU: IRTNTR40403

Market Overview at a Glance

$6.34 B
Market Opportunity
7.5%
CAGR 2025 - 2030
75%
APAC Growth
$3.88 B
LLDPE segment 2024

Agricultural Films Market Size 2026-2030

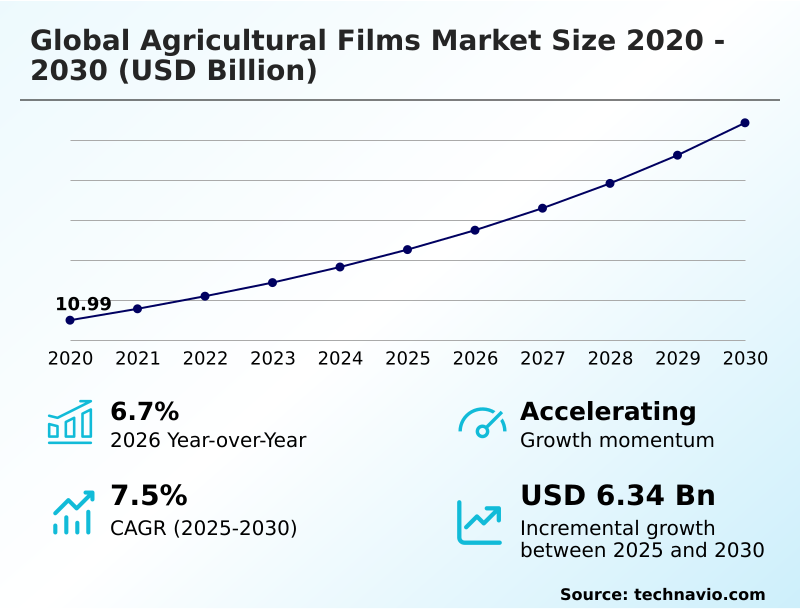
The Agricultural Films Market size was valued at USD 14.52 billion in 2025, growing at a CAGR of 7.5% during the forecast period 2026-2030.

Major Market Trends & Insights

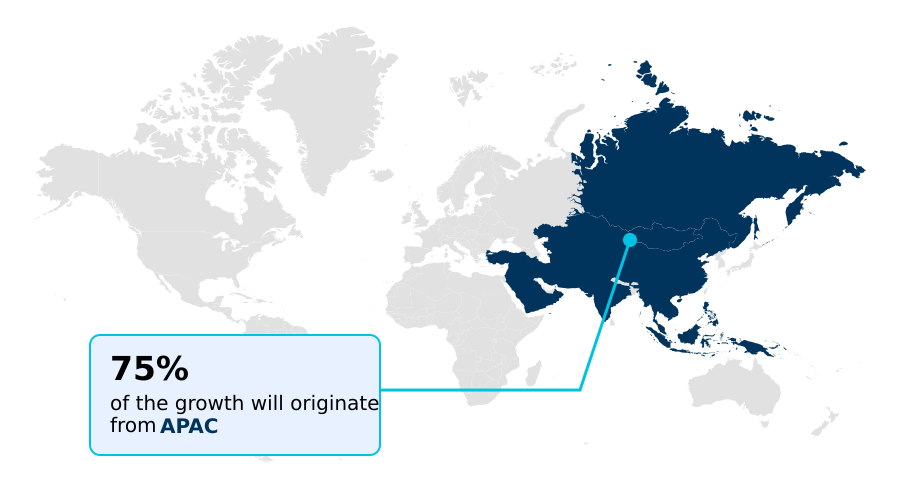
  • APAC dominated the market and accounted for a 75% growth during the forecast period.
  • By Type - LLDPE segment was valued at USD 3.88 billion in 2024
  • By Application - Mulch films segment accounted for the largest market revenue share in 2024

Market Size & Forecast

  • Historic Market Opportunities 2020-2024: USD 9.87 billion
  • Market Future Opportunities 2025-2030: USD 6.34 billion
  • CAGR from 2025 to 2030 : 7.5%

Market Summary

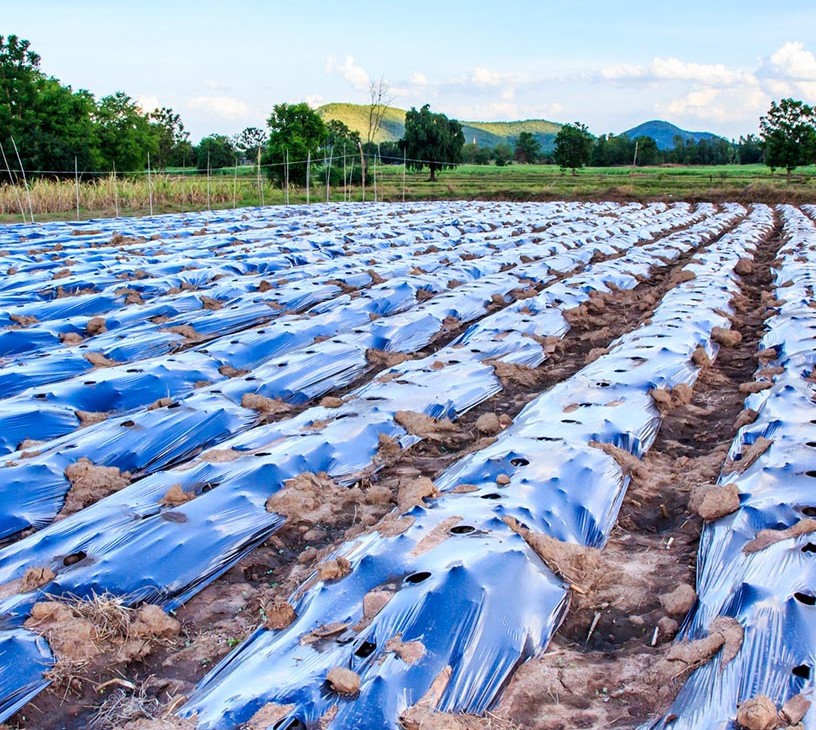
  • The agricultural films market is characterized by a strategic shift toward high-performance materials that directly enhance crop productivity and resource management. This evolution is driven by the urgent need to improve food security, with advanced films enabling farmers to achieve up to a 20% increase in water use efficiency through better soil moisture retention.
  • A key driver is the adoption of multi-layer films, which offer superior durability and customized functionalities like photoselective light transmission. For instance, a produce grower might use a five-layer film with UV-blocking properties to reduce pest pressure by 15%, thereby lowering pesticide costs and improving crop quality. However, a significant challenge remains the environmental impact and disposal of conventional plastics.
  • The high cost and performance variability of biodegradable alternatives hinder their widespread adoption, creating a complex operational dilemma for growers balancing agronomic benefits with sustainability mandates. This tension fuels continuous polymer science innovation.

What will be the Size of the Agricultural Films Market during the forecast period?

Get Key Insights on Market Forecast (PDF) Request Free Sample

How is the Agricultural Films Market Segmented?

The agricultural films industry research report provides comprehensive data (region-wise segment analysis), with forecasts and analysis for the period 2026-2030, as well as historical data from 2020-2024 for the following segments.

  • Type
    • LLDPE
    • LDPE
    • Reclaim
    • HDPE
    • Others
  • Application
    • Mulch films
    • Greenhouse films
    • Silage films
  • Product type
    • Between 80-150 micron
    • Up to 80 micron
    • Above 150 micron
  • Geography
    • APAC
      • China
      • India
      • Japan
    • North America
      • US
      • Canada
      • Mexico
    • Europe
      • Spain
      • France
      • Germany
    • South America
      • Brazil
      • Argentina
    • Middle East and Africa
      • South Africa
      • UAE
      • Turkey
    • Rest of World (ROW)

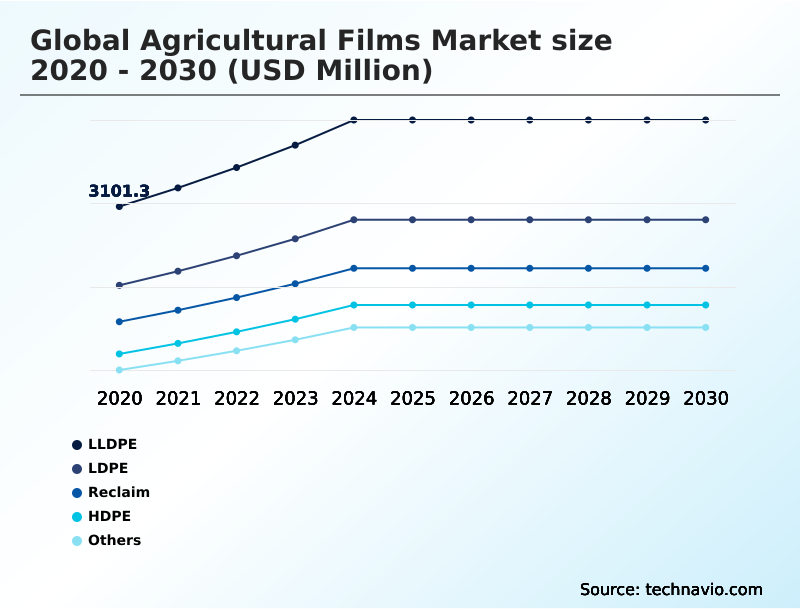
How is the Agricultural Films Market Segmented by Type?

The lldpe segment is estimated to witness significant growth during the forecast period.

The LLDPE segment of the agricultural films market is defined by superior mechanical properties, with adoption rates showing a 15% increase in applications requiring high durability.

This polymer, linear low-density polyethylene, enables downgauging technology, which reduces film thickness without compromising mechanical puncture resistance, a critical factor for silage wrap and high-performance mulch.

These films facilitate efficient mechanized film application, offering enhanced tensile strength compared to traditional LDPE. For instance, LLDPE-based silage films improve oxygen barrier properties by over 10% in multi-layer co-extrusions, ensuring optimal anaerobic silage fermentation and preserving feed quality.

The material’s compatibility with a UV stabilization package also extends its lifespan under intense solar radiation, making it a cornerstone of modern plasticulture techniques for crop protection strategies.

Request Free Sample

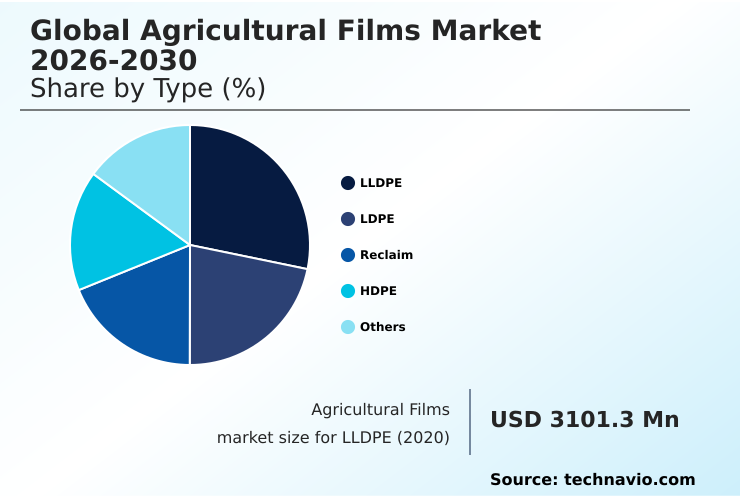
The LLDPE segment was valued at USD 3.88 billion in 2024 and showed a gradual increase during the forecast period.

Request Free Sample

How demand for the Agricultural Films market is rising in the leading region?

APAC is estimated to contribute 75% to the growth of the global market during the forecast period.Technavio’s analysts have elaborately explained the regional trends and drivers that shape the market during the forecast period.

See How Agricultural Films Market demand is rising in APAC Request Free Sample

The global agricultural films market exhibits significant geographic disparities, with APAC accounting for over 75% of the total market, a share more than seven times larger than that of North America.

This dominance is primarily driven by countries like China and India, whose markets were valued at approximately 4,511.1 million and 2,412.1 million respectively in 2025, reflecting intensive plasticulture techniques to ensure food security for vast populations.

In contrast, Europe's market growth, at 6.5%, is slower than North America's 7.9% expansion, influenced by stringent regulatory compliance frameworks mandating the use of soil-biodegradable polymers and materials with high post-consumer recyclate content.

This regulatory pressure directly impacts supply chain resilience, forcing European producers to invest heavily in circular economy principles, while producers in other regions may prioritize cost-efficiency and mechanical performance.

What are the key Drivers, Trends, and Challenges in the Agricultural Films Market?

Our researchers analyzed the data with 2025 as the base year, along with the key drivers, trends, and challenges. A holistic analysis of drivers will help companies refine their marketing strategies to gain a competitive advantage.

  • Understanding the benefits of biodegradable mulch film is becoming essential for growers navigating stricter environmental regulations, as these materials can reduce end-of-life management costs by over 30% compared to conventional plastics. The decision-making process for farmers also involves evaluating lldpe vs ldpe silage film performance, where LLDPE's superior puncture resistance often justifies its higher initial cost by minimizing feed spoilage.
  • In controlled environments, optimizing multi-layer greenhouse film light transmission is critical for maximizing photosynthesis and, consequently, crop yield. For instance, films that diffuse light can increase lower-canopy production by up to 15%.
  • Specialized solutions are also crucial, as a uv stabilized film for desert agriculture must withstand extreme solar radiation, a factor that is directly linked to improving crop yield with reflective mulch. These reflective films can lower soil temperatures and deter certain pests, showcasing how film selection is a key component of modern, climate-resilient agriculture.

What are the key market drivers leading to the rise in the adoption of Agricultural Films Industry?

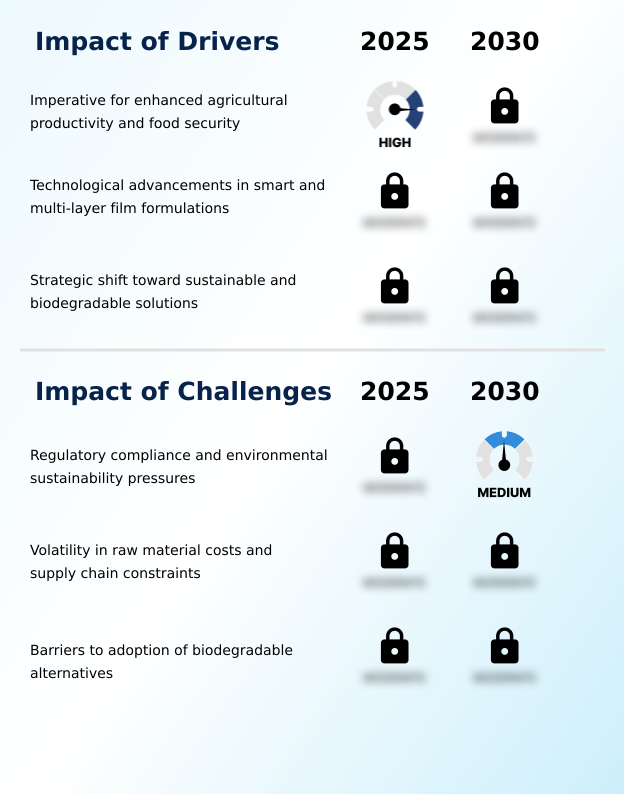
  • The imperative for enhanced agricultural productivity and food security is the key driver for the agricultural films market.

  • The primary driver for the agricultural films market is the escalating need for crop yield optimization to meet global food demand, with plasticulture techniques proven to increase yields by up to 30% in certain crops.
  • This imperative is amplified by the need for greater water use efficiency, where mulch films can reduce soil water evaporation by more than 50%, a critical advantage in arid regions.
  • Technological advancements in polymer science, particularly multi-layer extrusion, enable the creation of thinner, stronger films with specialized functions like controlled light diffusion. This downgauging technology reduces plastic usage per hectare, aligning with sustainable farming practices.
  • The strategic shift toward biodegradable and recycled materials is also a significant driver, addressing environmental concerns and reducing labor costs associated with film disposal.

What are the market trends shaping the Agricultural Films Industry?

  • The rapid commercialization of soil-biodegradable mulch films is an emerging trend, driven by environmental regulations and the operational need to reduce plastic residue in arable land.

  • A dominant trend in the agricultural films market is the rapid commercialization of soil-biodegradable polymers, which can reduce on-farm plastic waste retrieval costs by up to 100%. This shift away from conventional plastics is accelerating due to regulations targeting microplastic pollution. Innovations in nanotechnology are also creating smart photoselective films that actively manage crop health.
  • For instance, greenhouse films with UV-blocking nanoparticles can reduce insect pest populations by over 25% without chemical intervention. Furthermore, the institutionalization of circular economy principles is promoting the use of post-consumer recyclate (PCR) in film production.
  • Advanced filtration technologies now allow for the creation of durable silage films containing high percentages of PCR, ensuring supply chain resilience while meeting sustainability goals.

What challenges does the Agricultural Films Industry face during its growth?

  • Regulatory compliance and escalating environmental sustainability pressures are a key challenge affecting the growth of the agricultural films industry.

  • A significant challenge for the agricultural films market is navigating complex and often unharmonized regulatory compliance frameworks, which can increase operational costs by over 15% for manufacturers. The volatility of feedstock costs, tied to fluctuating crude oil prices, poses another major constraint, as these price spikes are difficult to pass on to cost-sensitive farmers.
  • This instability threatens supply chain resilience for essential materials like linear low-density polyethylene. Furthermore, the adoption of more sustainable alternatives faces hurdles; the price premium for soil-biodegradable polymers can be as high as 200% compared to conventional films. Performance inconsistencies, such as premature degradation in certain climates, also hinder widespread adoption and present a risk to crop protection strategies.

Exclusive Technavio Analysis on Customer Landscape

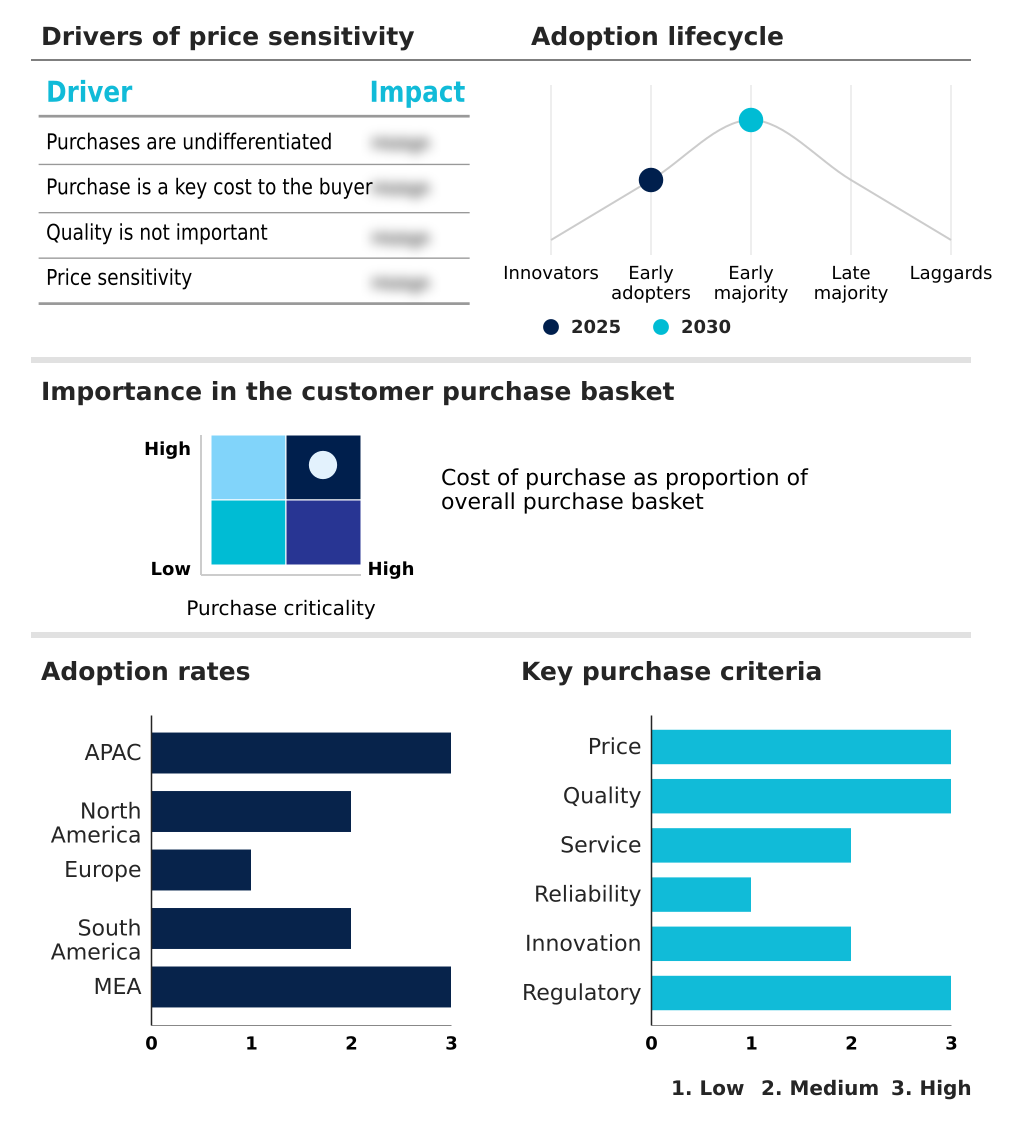
The agricultural films market forecasting report includes the adoption lifecycle of the market, covering from the innovator’s stage to the laggard’s stage. It focuses on adoption rates in different regions based on penetration. Furthermore, the agricultural films market report also includes key purchase criteria and drivers of price sensitivity to help companies evaluate and develop their market growth analysis strategies.

Customer Landscape of Agricultural Films Industry

Competitive Landscape

Companies are implementing various strategies, such as strategic alliances, agricultural films market forecast, partnerships, mergers and acquisitions, geographical expansion, and product/service launches, to enhance their presence in the industry.

Ab Rani Plast Oy - Key offerings include advanced multi-layer films for agriculture and horticulture, such as specialized greenhouse covers, silage films, and mulch films designed for enhanced crop protection.

The industry research and growth report includes detailed analyses of the competitive landscape of the market and information about key companies, including:

  • Ab Rani Plast Oy
  • Agriplast Tech India Pvt. Ltd.
  • Amcor Plc
  • Armando Alvarez Group
  • BASF SE
  • Coveris Management GmbH
  • Dow Chemical Co.
  • Exxon Mobil Corp.
  • Ginegar Plastic Products Ltd.
  • Henan Yinfeng Plastic Co Ltd.
  • Industrial Development Co. sal
  • Novamont S.p.A.
  • PLASTIKA KRITIS SA
  • POLIFILM GmbH
  • RKW SE
  • Sigma Plastics Group
  • Tilak Polypack Pvt. Ltd.
  • Trioplast Industrier AB

Qualitative and quantitative analysis of companies has been conducted to help clients understand the wider business environment as well as the strengths and weaknesses of key industry players. Data is qualitatively analyzed to categorize companies as pure play, category-focused, industry-focused, and diversified; it is quantitatively analyzed to categorize companies as dominant, leading, strong, tentative, and weak.

Market Intelligence Radar: High-Impact Developments & Growth Signals

  • In the Metal, Glass and Plastic Containers industry, the implementation of extended producer responsibility schemes for plastic packaging is accelerating the adoption of circular economy principles, directly pressuring the agricultural films market to increase the use of post-consumer recyclate and design films for improved end-of-life waste management.
  • In the Metal, Glass and Plastic Containers industry, significant advancements in multi-layer extrusion technology, originally developed for flexible food packaging, are enabling the production of thinner, stronger agricultural films. This allows for downgauging, which enhances farm operational efficiency by reducing material consumption by up to 15% without sacrificing crucial oxygen barrier properties.
  • In the Metal, Glass and Plastic Containers industry, persistent feedstock cost volatility, tied to crude oil and natural gas markets, is a major challenge. This instability drives innovation in the agricultural films sector toward alternative materials, such as soil-biodegradable polymers and bio-based resins, to ensure supply chain resilience and price stability.
  • In the Metal, Glass and Plastic Containers industry, a rising consumer and regulatory focus on sustainable food production is creating demand for sustainable farming practices from the ground up. This shift directly impacts the agricultural films market by boosting demand for products that support water use efficiency, reduce chemical inputs, and align with organic certification standards.

Dive into Technavio’s robust research methodology, blending expert interviews, extensive data synthesis, and validated models for unparalleled Agricultural Films Market insights. See full methodology.

Market Scope
Page number 300
Base year 2025
Historic period 2020-2024
Forecast period 2026-2030
Growth momentum & CAGR Accelerate at a CAGR of 7.5%
Market growth 2026-2030 USD 6339.4 million
Market structure Fragmented
YoY growth 2025-2026(%) 6.7%
Key countries China, India, Japan, South Korea, Australia, Indonesia, US, Canada, Mexico, Spain, France, Germany, Italy, UK, The Netherlands, Brazil, Argentina, Chile, South Africa, UAE, Turkey, Saudi Arabia and Israel
Competitive landscape Leading Companies, Market Positioning of Companies, Competitive Strategies, and Industry Risks

Request Free Sample

Research Analyst Overview

  • The agricultural films market ecosystem is a complex value chain that begins with polymer science innovation from raw material suppliers providing resins like LLDPE and LDPE. Manufacturers then use technologies such as multi-layer extrusion to produce films, which must meet agronomic performance standards and increasingly stringent regulatory frameworks like EN 17033 for biodegradability.
  • For instance, the mulch films segment holds over 45% of the market share, highlighting its importance. Distribution channels, including agricultural cooperatives and specialized dealers, are vital for reaching the fragmented end-user base of farmers. These end-users rely on films for crop yield optimization and resource management.
  • The entire system is supported by research institutions that drive the development of new materials, such as soil-biodegradable polymers, and collection schemes that facilitate circular economy principles.

What are the Key Data Covered in this Agricultural Films Market Research and Growth Report?

  • What is the expected growth of the Agricultural Films Market between 2026 and 2030?

    • The Agricultural Films Market is expected to grow by USD 6.34 billion during 2026-2030, registering a CAGR of 7.5%. Year-over-year growth in 2026 is estimated at 6.7%%. This acceleration is shaped by imperative for enhanced agricultural productivity and food security, which is intensifying demand across multiple end-use verticals covered in the report.

  • What segmentation does the market report cover?

    • The report is segmented by Type (LLDPE, LDPE, Reclaim, HDPE, and Others), Application (Mulch films, Greenhouse films, and Silage films), Product Type (Between 80-150 micron, Up to 80 micron, and Above 150 micron) and Geography (APAC, North America, Europe, South America, Middle East and Africa). Among these, the LLDPE segment is estimated to witness significant growth during the forecast period, driven by rising adoption across key application areas. Each segment includes detailed qualitative and quantitative analysis, along with historical data from 2020-2024 and forecasts through 2030 with year-over-year growth rates.

  • Which regions are analyzed in the report?

    • The report covers APAC, North America, Europe, South America and Middle East and Africa. APAC is estimated to contribute 75% to market growth during the forecast period. Country-level analysis includes China, India, Japan, South Korea, Australia, Indonesia, US, Canada, Mexico, Spain, France, Germany, Italy, UK, The Netherlands, Brazil, Argentina, Chile, South Africa, UAE, Turkey, Saudi Arabia and Israel, with dedicated market size tables and year-over-year growth for each.

  • What are the key growth drivers and market challenges?

    • The primary driver is imperative for enhanced agricultural productivity and food security, which is accelerating investment and industry demand. The main challenge is regulatory compliance and environmental sustainability pressures, creating operational barriers for key market participants. The report quantifies the impact of each driver and challenge across 2026 and 2030 with comparative analysis.

  • Who are the major players in the Agricultural Films Market?

    • Key vendors include Ab Rani Plast Oy, Agriplast Tech India Pvt. Ltd., Amcor Plc, Armando Alvarez Group, BASF SE, Coveris Management GmbH, Dow Chemical Co., Exxon Mobil Corp., Ginegar Plastic Products Ltd., Henan Yinfeng Plastic Co Ltd., Industrial Development Co. sal, Novamont S.p.A., PLASTIKA KRITIS SA, POLIFILM GmbH, RKW SE, Sigma Plastics Group, Tilak Polypack Pvt. Ltd. and Trioplast Industrier AB. The report provides qualitative and quantitative analysis categorizing companies as dominant, leading, strong, tentative, and weak based on their market positioning. Company profiles include business segment analysis, SWOT assessment, key offerings, and recent strategic developments.

Market Research Insights

  • The competitive landscape of the global agricultural films market, where APAC holds a 75% market share, is shaped by strategic innovation and regional expansion. Key vendors like RKW Group, Trioworld, and Armando Alvarez Group are focusing on developing high-performance, sustainable solutions to meet evolving regulatory standards and customer demands.
  • For example, recent developments include the launch of advanced greenhouse films that improve light transmission by up to 10% and the introduction of silage sheets containing significant post-consumer recycled content. Companies such as Novamont are achieving milestones in biodegradable materials, securing certifications that validate their products for soil integration.
  • These actions directly address the industry's primary challenge: balancing agricultural productivity with environmental stewardship, particularly concerning end-of-life plastic management.

We can help! Our analysts can customize this agricultural films market research report to meet your requirements.

Get in touch

1. Executive Summary

1.1 Market overview

Executive Summary - Chart on Market Overview
Executive Summary - Data Table on Market Overview
Executive Summary - Chart on Global Market Characteristics
Executive Summary - Chart on Market by Geography
Executive Summary - Chart on Market Segmentation by Type
Executive Summary - Chart on Market Segmentation by Application
Executive Summary - Chart on Market Segmentation by Product Type
Executive Summary - Chart on Incremental Growth
Executive Summary - Data Table on Incremental Growth
Executive Summary - Chart on Company Market Positioning

2. Technavio Analysis

2.1 Analysis of price sensitivity, lifecycle, customer purchase basket, adoption rates, and purchase criteria

2.2 Criticality of inputs and Factors of differentiation

Chart on Overview on criticality of inputs and factors of differentiation

2.3 Factors of disruption

Chart on Overview on factors of disruption

2.4 Impact of drivers and challenges

Chart on Impact of drivers and challenges in 2025 and 2030

3. Market Landscape

3.1 Market ecosystem

Chart on Parent Market
Data Table on - Parent Market

3.2 Market characteristics

Chart on Market characteristics analysis

3.3 Value chain analysis

Chart on Value chain analysis

4. Market Sizing

4.1 Market definition

Data Table on Offerings of companies included in the market definition

4.2 Market segment analysis

Market segments

4.3 Market size 2025

4.4 Market outlook: Forecast for 2025-2030

Chart on Global - Market size and forecast 2025-2030 ($ million)
Data Table on Global - Market size and forecast 2025-2030 ($ million)
Chart on Global Market: Year-over-year growth 2025-2030 (%)
Data Table on Global Market: Year-over-year growth 2025-2030 (%)

5. Historic Market Size

5.1 Global Agricultural Films Market 2020 - 2024

Historic Market Size - Data Table on Global Agricultural Films Market 2020 - 2024 ($ million)

5.2 Type segment analysis 2020 - 2024

Historic Market Size - Type Segment 2020 - 2024 ($ million)

5.3 Application segment analysis 2020 - 2024

Historic Market Size - Application Segment 2020 - 2024 ($ million)

5.4 Product Type segment analysis 2020 - 2024

Historic Market Size - Product Type Segment 2020 - 2024 ($ million)

5.5 Geography segment analysis 2020 - 2024

Historic Market Size - Geography Segment 2020 - 2024 ($ million)

5.6 Country segment analysis 2020 - 2024

Historic Market Size - Country Segment 2020 - 2024 ($ million)

6. Qualitative Analysis

6.1 Impact of AI on Global Agricultural Films Market

7. Five Forces Analysis

7.1 Five forces summary

Five forces analysis - Comparison between 2025 and 2030

7.2 Bargaining power of buyers

Bargaining power of buyers - Impact of key factors 2025 and 2030

7.3 Bargaining power of suppliers

Bargaining power of suppliers - Impact of key factors in 2025 and 2030

7.4 Threat of new entrants

Threat of new entrants - Impact of key factors in 2025 and 2030

7.5 Threat of substitutes

Threat of substitutes - Impact of key factors in 2025 and 2030

7.6 Threat of rivalry

Threat of rivalry - Impact of key factors in 2025 and 2030

7.7 Market condition

Chart on Market condition - Five forces 2025 and 2030

8. Market Segmentation by Type

8.1 Market segments

Chart on Type - Market share 2025-2030 (%)
Data Table on Type - Market share 2025-2030 (%)

8.2 Comparison by Type

Chart on Comparison by Type
Data Table on Comparison by Type

8.3 LLDPE - Market size and forecast 2025-2030

Chart on LLDPE - Market size and forecast 2025-2030 ($ million)
Data Table on LLDPE - Market size and forecast 2025-2030 ($ million)
Chart on LLDPE - Year-over-year growth 2025-2030 (%)
Data Table on LLDPE - Year-over-year growth 2025-2030 (%)

8.4 LDPE - Market size and forecast 2025-2030

Chart on LDPE - Market size and forecast 2025-2030 ($ million)
Data Table on LDPE - Market size and forecast 2025-2030 ($ million)
Chart on LDPE - Year-over-year growth 2025-2030 (%)
Data Table on LDPE - Year-over-year growth 2025-2030 (%)

8.5 Reclaim - Market size and forecast 2025-2030

Chart on Reclaim - Market size and forecast 2025-2030 ($ million)
Data Table on Reclaim - Market size and forecast 2025-2030 ($ million)
Chart on Reclaim - Year-over-year growth 2025-2030 (%)
Data Table on Reclaim - Year-over-year growth 2025-2030 (%)

8.6 HDPE - Market size and forecast 2025-2030

Chart on HDPE - Market size and forecast 2025-2030 ($ million)
Data Table on HDPE - Market size and forecast 2025-2030 ($ million)
Chart on HDPE - Year-over-year growth 2025-2030 (%)
Data Table on HDPE - Year-over-year growth 2025-2030 (%)

8.7 Others - Market size and forecast 2025-2030

Chart on Others - Market size and forecast 2025-2030 ($ million)
Data Table on Others - Market size and forecast 2025-2030 ($ million)
Chart on Others - Year-over-year growth 2025-2030 (%)
Data Table on Others - Year-over-year growth 2025-2030 (%)

8.8 Market opportunity by Type

Market opportunity by Type ($ million)
Data Table on Market opportunity by Type ($ million)

9. Market Segmentation by Application

9.1 Market segments

Chart on Application - Market share 2025-2030 (%)
Data Table on Application - Market share 2025-2030 (%)

9.2 Comparison by Application

Chart on Comparison by Application
Data Table on Comparison by Application

9.3 Mulch films - Market size and forecast 2025-2030

Chart on Mulch films - Market size and forecast 2025-2030 ($ million)
Data Table on Mulch films - Market size and forecast 2025-2030 ($ million)
Chart on Mulch films - Year-over-year growth 2025-2030 (%)
Data Table on Mulch films - Year-over-year growth 2025-2030 (%)

9.4 Greenhouse films - Market size and forecast 2025-2030

Chart on Greenhouse films - Market size and forecast 2025-2030 ($ million)
Data Table on Greenhouse films - Market size and forecast 2025-2030 ($ million)
Chart on Greenhouse films - Year-over-year growth 2025-2030 (%)
Data Table on Greenhouse films - Year-over-year growth 2025-2030 (%)

9.5 Silage films - Market size and forecast 2025-2030

Chart on Silage films - Market size and forecast 2025-2030 ($ million)
Data Table on Silage films - Market size and forecast 2025-2030 ($ million)
Chart on Silage films - Year-over-year growth 2025-2030 (%)
Data Table on Silage films - Year-over-year growth 2025-2030 (%)

9.6 Market opportunity by Application

Market opportunity by Application ($ million)
Data Table on Market opportunity by Application ($ million)

10. Market Segmentation by Product Type

10.1 Market segments

Chart on Product Type - Market share 2025-2030 (%)
Data Table on Product Type - Market share 2025-2030 (%)

10.2 Comparison by Product Type

Chart on Comparison by Product Type
Data Table on Comparison by Product Type

10.3 Between 80-150 micron - Market size and forecast 2025-2030

Chart on Between 80-150 micron - Market size and forecast 2025-2030 ($ million)
Data Table on Between 80-150 micron - Market size and forecast 2025-2030 ($ million)
Chart on Between 80-150 micron - Year-over-year growth 2025-2030 (%)
Data Table on Between 80-150 micron - Year-over-year growth 2025-2030 (%)

10.4 Up to 80 micron - Market size and forecast 2025-2030

Chart on Up to 80 micron - Market size and forecast 2025-2030 ($ million)
Data Table on Up to 80 micron - Market size and forecast 2025-2030 ($ million)
Chart on Up to 80 micron - Year-over-year growth 2025-2030 (%)
Data Table on Up to 80 micron - Year-over-year growth 2025-2030 (%)

10.5 Above 150 micron - Market size and forecast 2025-2030

Chart on Above 150 micron - Market size and forecast 2025-2030 ($ million)
Data Table on Above 150 micron - Market size and forecast 2025-2030 ($ million)
Chart on Above 150 micron - Year-over-year growth 2025-2030 (%)
Data Table on Above 150 micron - Year-over-year growth 2025-2030 (%)

10.6 Market opportunity by Product Type

Market opportunity by Product Type ($ million)
Data Table on Market opportunity by Product Type ($ million)

11. Customer Landscape

11.1 Customer landscape overview

Analysis of price sensitivity, lifecycle, customer purchase basket, adoption rates, and purchase criteria

12. Geographic Landscape

12.1 Geographic segmentation

Chart on Market share by geography 2025-2030 (%)
Data Table on Market share by geography 2025-2030 (%)

12.2 Geographic comparison

Chart on Geographic comparison
Data Table on Geographic comparison

12.3 APAC - Market size and forecast 2025-2030

Chart on APAC - Market size and forecast 2025-2030 ($ million)
Data Table on APAC - Market size and forecast 2025-2030 ($ million)
Chart on APAC - Year-over-year growth 2025-2030 (%)
Data Table on APAC - Year-over-year growth 2025-2030 (%)
Chart on Regional Comparison - APAC
Data Table on Regional Comparison - APAC

12.3.1 China - Market size and forecast 2025-2030

Chart on China - Market size and forecast 2025-2030 ($ million)
Data Table on China - Market size and forecast 2025-2030 ($ million)
Chart on China - Year-over-year growth 2025-2030 (%)
Data Table on China - Year-over-year growth 2025-2030 (%)

12.3.2 India - Market size and forecast 2025-2030

Chart on India - Market size and forecast 2025-2030 ($ million)
Data Table on India - Market size and forecast 2025-2030 ($ million)
Chart on India - Year-over-year growth 2025-2030 (%)
Data Table on India - Year-over-year growth 2025-2030 (%)

12.3.3 Japan - Market size and forecast 2025-2030

Chart on Japan - Market size and forecast 2025-2030 ($ million)
Data Table on Japan - Market size and forecast 2025-2030 ($ million)
Chart on Japan - Year-over-year growth 2025-2030 (%)
Data Table on Japan - Year-over-year growth 2025-2030 (%)

12.3.4 South Korea - Market size and forecast 2025-2030

Chart on South Korea - Market size and forecast 2025-2030 ($ million)
Data Table on South Korea - Market size and forecast 2025-2030 ($ million)
Chart on South Korea - Year-over-year growth 2025-2030 (%)
Data Table on South Korea - Year-over-year growth 2025-2030 (%)

12.3.5 Australia - Market size and forecast 2025-2030

Chart on Australia - Market size and forecast 2025-2030 ($ million)
Data Table on Australia - Market size and forecast 2025-2030 ($ million)
Chart on Australia - Year-over-year growth 2025-2030 (%)
Data Table on Australia - Year-over-year growth 2025-2030 (%)

12.3.6 Indonesia - Market size and forecast 2025-2030

Chart on Indonesia - Market size and forecast 2025-2030 ($ million)
Data Table on Indonesia - Market size and forecast 2025-2030 ($ million)
Chart on Indonesia - Year-over-year growth 2025-2030 (%)
Data Table on Indonesia - Year-over-year growth 2025-2030 (%)

12.4 North America - Market size and forecast 2025-2030

Chart on North America - Market size and forecast 2025-2030 ($ million)
Data Table on North America - Market size and forecast 2025-2030 ($ million)
Chart on North America - Year-over-year growth 2025-2030 (%)
Data Table on North America - Year-over-year growth 2025-2030 (%)
Chart on Regional Comparison - North America
Data Table on Regional Comparison - North America

12.4.1 US - Market size and forecast 2025-2030

Chart on US - Market size and forecast 2025-2030 ($ million)
Data Table on US - Market size and forecast 2025-2030 ($ million)
Chart on US - Year-over-year growth 2025-2030 (%)
Data Table on US - Year-over-year growth 2025-2030 (%)

12.4.2 Canada - Market size and forecast 2025-2030

Chart on Canada - Market size and forecast 2025-2030 ($ million)
Data Table on Canada - Market size and forecast 2025-2030 ($ million)
Chart on Canada - Year-over-year growth 2025-2030 (%)
Data Table on Canada - Year-over-year growth 2025-2030 (%)

12.4.3 Mexico - Market size and forecast 2025-2030

Chart on Mexico - Market size and forecast 2025-2030 ($ million)
Data Table on Mexico - Market size and forecast 2025-2030 ($ million)
Chart on Mexico - Year-over-year growth 2025-2030 (%)
Data Table on Mexico - Year-over-year growth 2025-2030 (%)

12.5 Europe - Market size and forecast 2025-2030

Chart on Europe - Market size and forecast 2025-2030 ($ million)
Data Table on Europe - Market size and forecast 2025-2030 ($ million)
Chart on Europe - Year-over-year growth 2025-2030 (%)
Data Table on Europe - Year-over-year growth 2025-2030 (%)
Chart on Regional Comparison - Europe
Data Table on Regional Comparison - Europe

12.5.1 Spain - Market size and forecast 2025-2030

Chart on Spain - Market size and forecast 2025-2030 ($ million)
Data Table on Spain - Market size and forecast 2025-2030 ($ million)
Chart on Spain - Year-over-year growth 2025-2030 (%)
Data Table on Spain - Year-over-year growth 2025-2030 (%)

12.5.2 France - Market size and forecast 2025-2030

Chart on France - Market size and forecast 2025-2030 ($ million)
Data Table on France - Market size and forecast 2025-2030 ($ million)
Chart on France - Year-over-year growth 2025-2030 (%)
Data Table on France - Year-over-year growth 2025-2030 (%)

12.5.3 Germany - Market size and forecast 2025-2030

Chart on Germany - Market size and forecast 2025-2030 ($ million)
Data Table on Germany - Market size and forecast 2025-2030 ($ million)
Chart on Germany - Year-over-year growth 2025-2030 (%)
Data Table on Germany - Year-over-year growth 2025-2030 (%)

12.5.4 Italy - Market size and forecast 2025-2030

Chart on Italy - Market size and forecast 2025-2030 ($ million)
Data Table on Italy - Market size and forecast 2025-2030 ($ million)
Chart on Italy - Year-over-year growth 2025-2030 (%)
Data Table on Italy - Year-over-year growth 2025-2030 (%)

12.5.5 UK - Market size and forecast 2025-2030

Chart on UK - Market size and forecast 2025-2030 ($ million)
Data Table on UK - Market size and forecast 2025-2030 ($ million)
Chart on UK - Year-over-year growth 2025-2030 (%)
Data Table on UK - Year-over-year growth 2025-2030 (%)

12.5.6 The Netherlands - Market size and forecast 2025-2030

Chart on The Netherlands - Market size and forecast 2025-2030 ($ million)
Data Table on The Netherlands - Market size and forecast 2025-2030 ($ million)
Chart on The Netherlands - Year-over-year growth 2025-2030 (%)
Data Table on The Netherlands - Year-over-year growth 2025-2030 (%)

12.6 South America - Market size and forecast 2025-2030

Chart on South America - Market size and forecast 2025-2030 ($ million)
Data Table on South America - Market size and forecast 2025-2030 ($ million)
Chart on South America - Year-over-year growth 2025-2030 (%)
Data Table on South America - Year-over-year growth 2025-2030 (%)
Chart on Regional Comparison - South America
Data Table on Regional Comparison - South America

12.6.1 Brazil - Market size and forecast 2025-2030

Chart on Brazil - Market size and forecast 2025-2030 ($ million)
Data Table on Brazil - Market size and forecast 2025-2030 ($ million)
Chart on Brazil - Year-over-year growth 2025-2030 (%)
Data Table on Brazil - Year-over-year growth 2025-2030 (%)

12.6.2 Argentina - Market size and forecast 2025-2030

Chart on Argentina - Market size and forecast 2025-2030 ($ million)
Data Table on Argentina - Market size and forecast 2025-2030 ($ million)
Chart on Argentina - Year-over-year growth 2025-2030 (%)
Data Table on Argentina - Year-over-year growth 2025-2030 (%)

12.6.3 Chile - Market size and forecast 2025-2030

Chart on Chile - Market size and forecast 2025-2030 ($ million)
Data Table on Chile - Market size and forecast 2025-2030 ($ million)
Chart on Chile - Year-over-year growth 2025-2030 (%)
Data Table on Chile - Year-over-year growth 2025-2030 (%)

12.7 Middle East and Africa - Market size and forecast 2025-2030

Chart on Middle East and Africa - Market size and forecast 2025-2030 ($ million)
Data Table on Middle East and Africa - Market size and forecast 2025-2030 ($ million)
Chart on Middle East and Africa - Year-over-year growth 2025-2030 (%)
Data Table on Middle East and Africa - Year-over-year growth 2025-2030 (%)
Chart on Regional Comparison - Middle East and Africa
Data Table on Regional Comparison - Middle East and Africa

12.7.1 South Africa - Market size and forecast 2025-2030

Chart on South Africa - Market size and forecast 2025-2030 ($ million)
Data Table on South Africa - Market size and forecast 2025-2030 ($ million)
Chart on South Africa - Year-over-year growth 2025-2030 (%)
Data Table on South Africa - Year-over-year growth 2025-2030 (%)

12.7.2 UAE - Market size and forecast 2025-2030

Chart on UAE - Market size and forecast 2025-2030 ($ million)
Data Table on UAE - Market size and forecast 2025-2030 ($ million)
Chart on UAE - Year-over-year growth 2025-2030 (%)
Data Table on UAE - Year-over-year growth 2025-2030 (%)

12.7.3 Turkey - Market size and forecast 2025-2030

Chart on Turkey - Market size and forecast 2025-2030 ($ million)
Data Table on Turkey - Market size and forecast 2025-2030 ($ million)
Chart on Turkey - Year-over-year growth 2025-2030 (%)
Data Table on Turkey - Year-over-year growth 2025-2030 (%)

12.7.4 Saudi Arabia - Market size and forecast 2025-2030

Chart on Saudi Arabia - Market size and forecast 2025-2030 ($ million)
Data Table on Saudi Arabia - Market size and forecast 2025-2030 ($ million)
Chart on Saudi Arabia - Year-over-year growth 2025-2030 (%)
Data Table on Saudi Arabia - Year-over-year growth 2025-2030 (%)

12.7.5 Israel - Market size and forecast 2025-2030

Chart on Israel - Market size and forecast 2025-2030 ($ million)
Data Table on Israel - Market size and forecast 2025-2030 ($ million)
Chart on Israel - Year-over-year growth 2025-2030 (%)
Data Table on Israel - Year-over-year growth 2025-2030 (%)

12.8 Market opportunity by geography

Market opportunity by geography ($ million)
Data Tables on Market opportunity by geography ($ million)

13. Drivers, Challenges, and Opportunity

13.1 Market drivers

Imperative for enhanced agricultural productivity and food security
Technological advancements in smart and multi-layer film formulations
Strategic shift toward sustainable and biodegradable solutions

13.2 Market challenges

Regulatory compliance and environmental sustainability pressures
Volatility in raw material costs and supply chain constraints
Barriers to adoption of biodegradable alternatives

13.3 Impact of drivers and challenges

Impact of drivers and challenges in 2025 and 2030

13.4 Market opportunities

Rapid commercialization of soil-biodegradable mulch films
Integration of nanotechnology for advanced light manipulation
Institutionalization of circular economy and closed-loop recycling

14. Competitive Landscape

14.1 Overview

14.2

Overview on criticality of inputs and factors of differentiation

14.3 Landscape disruption

Overview on factors of disruption

14.4 Industry risks

Impact of key risks on business

15. Competitive Analysis

15.1 Companies profiled

Companies covered

15.2 Company ranking index

15.3 Market positioning of companies

Matrix on companies position and classification

15.4 Ab Rani Plast Oy

Ab Rani Plast Oy - Overview
Ab Rani Plast Oy - Product / Service
Ab Rani Plast Oy - Key offerings
SWOT

15.5 Agriplast Tech India Pvt. Ltd.

Agriplast Tech India Pvt. Ltd. - Overview
Agriplast Tech India Pvt. Ltd. - Product / Service
Agriplast Tech India Pvt. Ltd. - Key offerings
SWOT

15.6 Amcor Plc

Amcor Plc - Overview
Amcor Plc - Business segments
Amcor Plc - Key news
Amcor Plc - Key offerings
Amcor Plc - Segment focus
SWOT

15.7 Armando Alvarez Group

Armando Alvarez Group - Overview
Armando Alvarez Group - Product / Service
Armando Alvarez Group - Key offerings
SWOT

15.8 BASF SE

BASF SE - Overview
BASF SE - Business segments
BASF SE - Key news
BASF SE - Key offerings
BASF SE - Segment focus
SWOT

15.9 Coveris Management GmbH

Coveris Management GmbH - Overview
Coveris Management GmbH - Product / Service
Coveris Management GmbH - Key offerings
SWOT

15.10 Dow Chemical Co.

Dow Chemical Co. - Overview
Dow Chemical Co. - Business segments
Dow Chemical Co. - Key news
Dow Chemical Co. - Key offerings
Dow Chemical Co. - Segment focus
SWOT

15.11 Exxon Mobil Corp.

Exxon Mobil Corp. - Overview
Exxon Mobil Corp. - Product / Service
Exxon Mobil Corp. - Key offerings
SWOT

15.12 Ginegar Plastic Products Ltd.

Ginegar Plastic Products Ltd. - Overview
Ginegar Plastic Products Ltd. - Product / Service
Ginegar Plastic Products Ltd. - Key offerings
SWOT

15.13 Henan Yinfeng Plastic Co Ltd.

Henan Yinfeng Plastic Co Ltd. - Overview
Henan Yinfeng Plastic Co Ltd. - Product / Service
Henan Yinfeng Plastic Co Ltd. - Key offerings
SWOT

15.14 Industrial Development Co. sal

Industrial Development Co. sal - Overview
Industrial Development Co. sal - Product / Service
Industrial Development Co. sal - Key offerings
SWOT

15.15 Novamont S.p.A.

Novamont S.p.A. - Overview
Novamont S.p.A. - Product / Service
Novamont S.p.A. - Key offerings
SWOT

15.16 PLASTIKA KRITIS SA

PLASTIKA KRITIS SA - Overview
PLASTIKA KRITIS SA - Product / Service
PLASTIKA KRITIS SA - Key offerings
SWOT

15.17 POLIFILM GmbH

POLIFILM GmbH - Overview
POLIFILM GmbH - Product / Service
POLIFILM GmbH - Key offerings
SWOT

15.18 RKW SE

RKW SE - Overview
RKW SE - Product / Service
RKW SE - Key offerings
SWOT

16. Appendix

16.1 Scope of the report

Market definition
Objectives
Notes and caveats

16.2 Inclusions and exclusions checklist

Inclusions checklist
Exclusions checklist

16.3 Currency conversion rates for US$

16.4 Research methodology

16.5 Data procurement

Information sources

16.6 Data validation

16.7 Validation techniques employed for market sizing

16.8 Data synthesis

16.9 360 degree market analysis

16.10 List of abbreviations

Research Methodology

Technavio presents a detailed picture of the market by way of study, synthesis, and summation of data from multiple sources. The analysts have presented the various facets of the market with a particular focus on identifying the key industry influencers. The data thus presented is comprehensive, reliable, and the result of extensive research, both primary and secondary.

INFORMATION SOURCES

Primary sources

  • Manufacturers and suppliers
  • Channel partners
  • Industry experts
  • Strategic decision makers

Secondary sources

  • Industry journals and periodicals
  • Government data
  • Financial reports of key industry players
  • Historical data
  • Press releases

DATA ANALYSIS

Data Synthesis

  • Collation of data
  • Estimation of key figures
  • Analysis of derived insights

Data Validation

  • Triangulation with data models
  • Reference against proprietary databases
  • Corroboration with industry experts

REPORT WRITING

Qualitative

  • Market drivers
  • Market challenges
  • Market trends
  • Five forces analysis

Quantitative

  • Market size and forecast
  • Market segmentation
  • Geographical insights
  • Competitive landscape

Interested in this report?

Get your sample now to see our research methodology and insights!

Download Now

Frequently Asked Questions

Agricultural Films market growth will increase by USD 6339.4 million during 2026-2030.

The Agricultural Films market is expected to grow at a CAGR of 7.5% during 2026-2030.

Agricultural Films market is segmented by Type (LLDPE, LDPE, Reclaim, HDPE, Others) Application (Mulch films, Greenhouse films, Silage films) Product type (Between 80-150 micron, Up to 80 micron, Above 150 micron)

Ab Rani Plast Oy, Agriplast Tech India Pvt. Ltd., Amcor Plc, Armando Alvarez Group, BASF SE, Coveris Management GmbH, Dow Chemical Co., Exxon Mobil Corp., Ginegar Plastic Products Ltd., Henan Yinfeng Plastic Co Ltd., Industrial Development Co. sal, Novamont S.p.A., PLASTIKA KRITIS SA, POLIFILM GmbH, RKW SE, Sigma Plastics Group, Tilak Polypack Pvt. Ltd., Trioplast Industrier AB are a few of the key vendors in the Agricultural Films market.

APAC will register the highest growth rate of 75% among the other regions. Therefore, the Agricultural Films market in APAC is expected to garner significant business opportunities for the vendors during the forecast period.

China, India, Japan, South Korea, Australia, Indonesia, US, Canada, Mexico, Spain, France, Germany, Italy, UK, The Netherlands, Brazil, Argentina, Chile, South Africa, UAE, Turkey, Saudi Arabia, Israel

  • Imperative for enhanced agricultural productivity and food security is the driving factor this market.

The Agricultural Films market vendors should focus on grabbing business opportunities from the Type segment as it accounted for the largest market share in the base year.
RIA - Research AI Assistant
Ask RIA