Agricultural Mulch Films Market Analysis, Size, and Forecast 2026-2030: APAC (China, India, and Japan), Europe (Germany, UK, and France), North America (US, Canada, and Mexico), South America (Brazil, Argentina, and Colombia), Middle East and Africa (South Africa, Israel, and Turkey), and Rest of World (ROW)

Agricultural Mulch Films Market Analysis, Size, and Forecast 2026-2030:
APAC (China, India, and Japan), Europe (Germany, UK, and France), North America (US, Canada, and Mexico), South America (Brazil, Argentina, and Colombia), Middle East and Africa (South Africa, Israel, and Turkey), and Rest of World (ROW)

Published: Jan 2026 287 Pages SKU: IRTNTR81229

Market Overview at a Glance

$2.35 B
Market Opportunity
6.6%
CAGR 2025 - 2030
51.5%
APAC Growth
$4.40 B
Open farm segment 2024

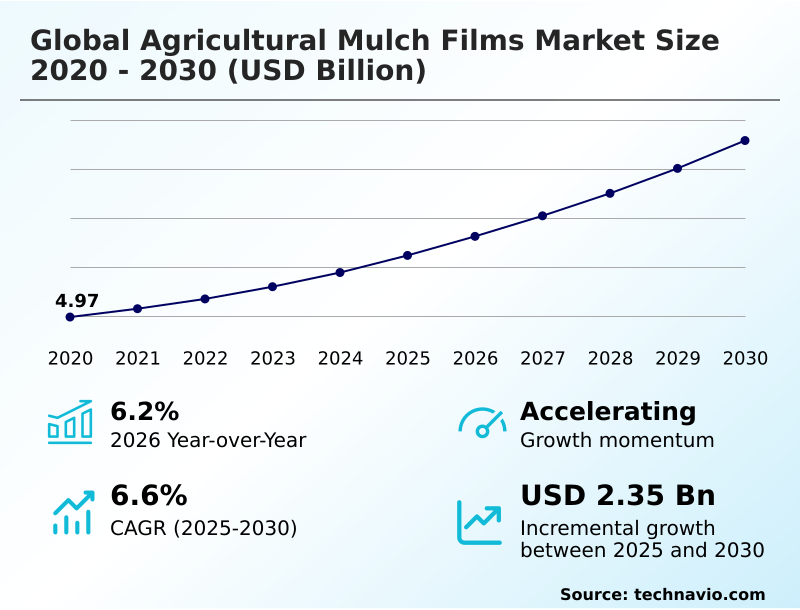
Agricultural Mulch Films Market Size 2026-2030

The agricultural mulch films market size is valued to increase by USD 2.35 billion, at a CAGR of 6.6% from 2025 to 2030. Accelerated transition toward biodegradable and soil-degradable film solutions will drive the agricultural mulch films market.

Major Market Trends & Insights

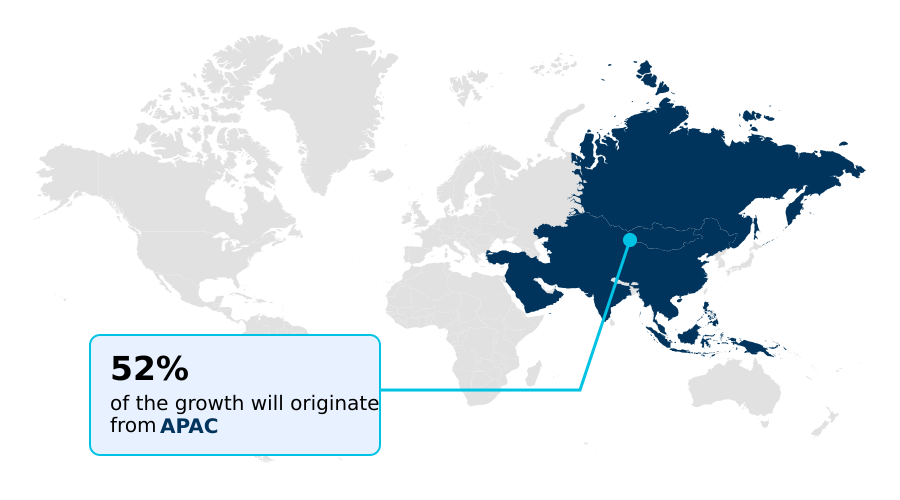
  • APAC dominated the market and accounted for a 51.5% growth during the forecast period.
  • By Application - Open farm segment was valued at USD 4.40 billion in 2024
  • By Type - Conventional segment accounted for the largest market revenue share in 2024

Market Size & Forecast

  • Market Opportunities: USD 3.61 billion
  • Market Future Opportunities: USD 2.35 billion
  • CAGR from 2025 to 2030 : 6.6%

Market Summary

  • The agricultural mulch films market is undergoing a significant transformation, driven by the dual imperatives of enhancing food production efficiency and adopting sustainable farming practices. A key driver is the need to maximize yield per hectare amid shrinking arable land, which makes high-performance mulch films essential for conserving soil moisture retention and regulating root zone temperature.
  • A dominant trend is the shift from conventional low-density polyethylene (ldpe) to soil-biodegradable polymers like polylactic acid (pla), spurred by stringent legislative frameworks aimed at reducing white pollution. Technological advancements in polymer chemistry are enabling the creation of multi-layer co-extrusion films with specialized functions, including photo-selective properties that influence crop morphogenesis and deter pests.
  • However, the high agricultural input costs of these advanced materials and raw material price volatility present considerable challenges. For instance, a large-scale agricultural cooperative must weigh the immediate cost savings of conventional films against the long-term operational benefits and regulatory compliance of biodegradable alternatives, a decision that directly impacts its supply chain and environmental stewardship goals.

What will be the Size of the Agricultural Mulch Films Market during the forecast period?

Get Key Insights on Market Forecast (PDF) Request Free Sample

How is the Agricultural Mulch Films Market Segmented?

The agricultural mulch films industry research report provides comprehensive data (region-wise segment analysis), with forecasts and estimates in "USD million" for the period 2026-2030, as well as historical data from 2020-2024 for the following segments.

  • Application
    • Open farm
    • Greenhouse
  • Type
    • Conventional
    • Biodegradable
  • Product type
    • Black
    • Transparent
  • Geography
    • APAC
      • China
      • India
      • Japan
    • Europe
      • Germany
      • UK
      • France
    • North America
      • US
      • Canada
      • Mexico
    • South America
      • Brazil
      • Argentina
      • Colombia
    • Middle East and Africa
      • South Africa
      • Israel
      • Turkey
    • Rest of World (ROW)

By Application Insights

The open farm segment is estimated to witness significant growth during the forecast period.

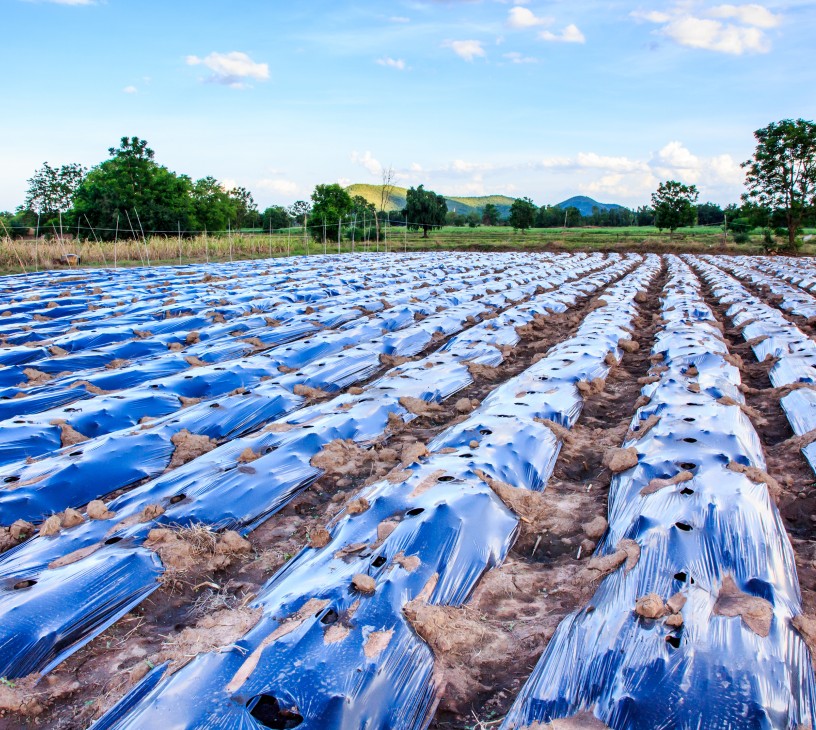
The open farm segment, driven by extensive cultivation of broad-acre crops, prioritizes films offering high mechanical strength, durability, and cost-effectiveness. These films must withstand rigorous mechanical installation and environmental exposure.

Black mulch films dominate due to superior weed suppression mechanism and ability to warm the soil, extending growing seasons. However, the labor-intensive removal of conventional films is accelerating adoption of soil-biodegradable polymers that can be tilled directly into the soil.

For instance, the economic return from using these high-performance mulch films often results in yield increments exceeding 30%, a key factor for achieving yield per hectare optimization and ensuring economic viability in modern agriculture.

This shift underscores a broader move toward more efficient and sustainable farming practices.

Request Free Sample

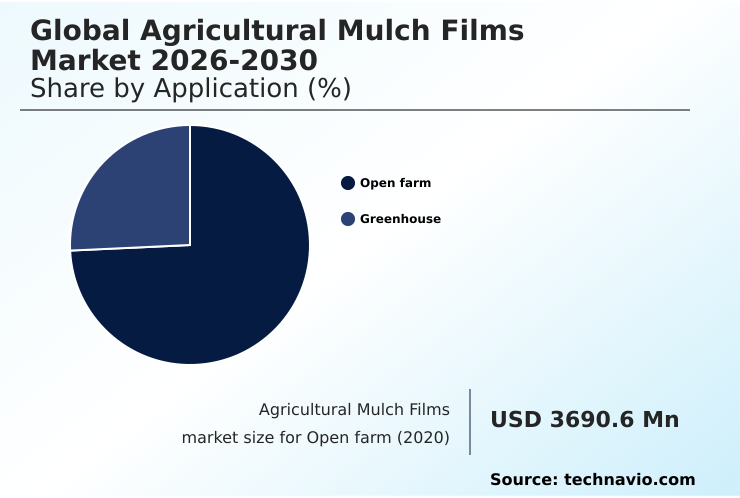
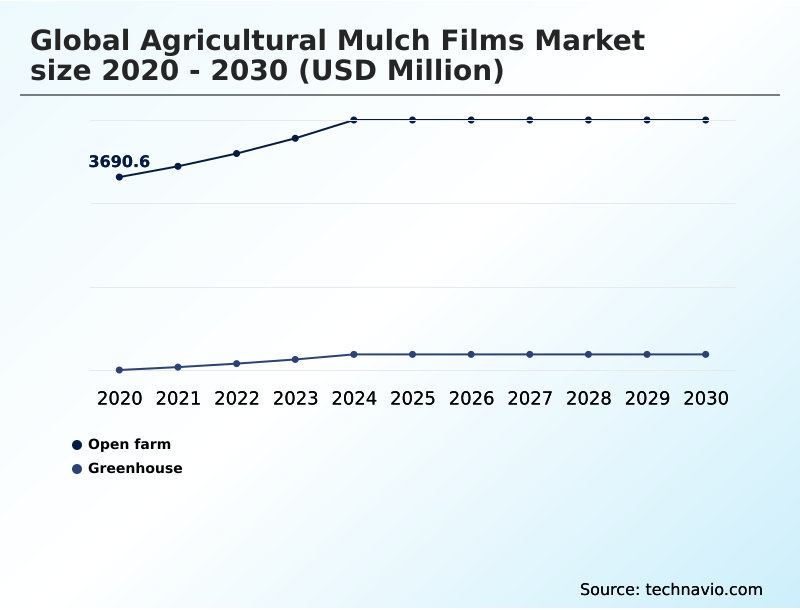
The Open farm segment was valued at USD 4.40 billion in 2024 and showed a gradual increase during the forecast period.

Request Free Sample

Regional Analysis

APAC is estimated to contribute 51.5% to the growth of the global market during the forecast period.Technavio’s analysts have elaborately explained the regional trends and drivers that shape the market during the forecast period.

See How Agricultural Mulch Films Market Demand is Rising in APAC Request Free Sample

The global agricultural mulch films market landscape is led by APAC, which is projected to contribute 51.5% of the incremental growth. This dominance is driven by government initiatives in China and India aimed at modernizing agriculture and addressing environmental concerns.

In China, strict standards are being enforced to increase the recovery rate of agricultural plastic film to 85%, which is stimulating investment in mechanical recycling process technologies and promoting the use of post-consumer recyclate (pcr).

In Europe, the market is shaped by stringent environmental regulations and Extended Producer Responsibility (EPR) schemes, pushing manufacturers toward certified soil-biodegradable polymers and circular economy models.

These legislative frameworks are compelling a transition away from films made with linear low-density polyethylene (lldpe) to more sustainable alternatives, addressing the challenge of microplastic contamination and promoting long-term soil health management.

Market Dynamics

Our researchers analyzed the data with 2025 as the base year, along with the key drivers, trends, and challenges. A holistic analysis of drivers will help companies refine their marketing strategies to gain a competitive advantage.

  • Strategic decision-making in the agricultural mulch films market increasingly involves a detailed cost analysis of photo-selective films versus conventional options. Understanding the benefits of biodegradable vs conventional mulch is critical, as is evaluating the impact of mulch film color on crops, which can enhance fruit quality with reflective films.
  • The role of mulch in precision agriculture is expanding, with mulch film compatibility with drip irrigation becoming a standard for optimizing water use. For growers in arid regions, selecting the appropriate mulch film for water-scarce regions is a key determinant of success.
  • Technological advancements are central to this evolution, with nanotechnology in ultra-thin mulch films enabling material reduction without sacrificing performance. Concurrently, there is a strong focus on the circular economy for agricultural plastics, with new technologies for recycling agricultural films being developed to tackle the challenges of mulch film disposal.
  • Regulating soil temperature with mulch remains a primary function, but the use of multi-layer film for pest repellency is also gaining traction. Ensuring mulch film performance in greenhouse settings and preventing soil erosion with mulch films are additional considerations.
  • The push for improving crop yield with black mulch continues, while adherence to standards for soil-biodegradable mulch is becoming mandatory in many regions. Ultimately, the economic viability of sustainable mulch films is improving, with advanced systems showing a nearly 25% greater return on investment compared to traditional methods over a three-year cycle due to reduced labor and disposal costs.

What are the key market drivers leading to the rise in the adoption of Agricultural Mulch Films Industry?

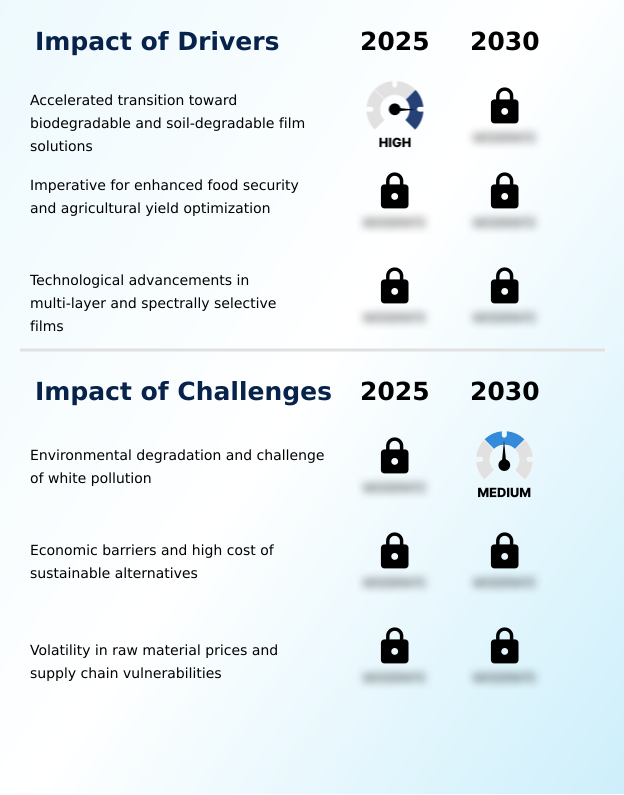
  • The market's growth is significantly driven by the accelerated transition toward biodegradable and soil-degradable film solutions, spurred by environmental regulations and the need for sustainable farming practices.

  • The market's expansion is propelled by the imperative for enhanced food security and agricultural yield optimization. The accelerated adoption of soil-biodegradable polymers is a primary driver, fueled by the need for sustainable farming practices.
  • These advanced materials offer dual benefits, maintaining soil moisture and temperature while aligning with environmental stewardship goals. The integration with precision agriculture is critical, as smart mulch film solutions are being deployed to optimize yield in water-scarce regions.
  • Pilot programs have demonstrated a 20% reduction in water usage while maintaining historical yield benchmarks.
  • Furthermore, technological advancements in multi-layer and spectrally selective films, which actively manipulate the growing environment, are contributing to yield increments that often exceed 30%, ensuring economic viability for farmers.

What are the market trends shaping the Agricultural Mulch Films Industry?

  • A key market trend is the emergence of nanotechnology-enhanced films. These advanced materials provide superior mechanical strength, enabling downgauging for reduced material use without performance loss.

  • Key trends are reshaping the market, moving it toward sophisticated agronomic tools. The emergence of nanotechnology-enhanced films allows for significant downgauging technology, with some new polyethylene nanocomposite formulations enabling a 30% reduction in thickness without compromising tensile strength or soil moisture retention. This innovation allows for the creation of ultra-thin films that meet demands for cost-effective cultivation.
  • Concurrently, the rise of multi-layer co-extrusion and photo-selective films is enabling precise manipulation of light to influence crop morphogenesis. Field trials with specific blue mulch films have demonstrated a 15% increase in cucumber yields. These advancements are integrating films into the digital farm ecosystem, enhancing food production efficiency.

What challenges does the Agricultural Mulch Films Industry face during its growth?

  • A primary challenge affecting market growth is the environmental degradation caused by plastic residue accumulation, known as white pollution, which threatens long-term soil health and agricultural sustainability.

  • The market faces significant hurdles, primarily the environmental impact of white pollution from the accumulation of plastic residues, which can reach contamination rates of over 50% by weight. This degradation of soil health has led to stringent legislative frameworks that threaten conventional product lines.
  • While the transition to biodegradable alternatives offers a solution, their high cost remains a substantial barrier, with prices often two to three times higher than their polyethylene counterparts. This price differential, coupled with high agricultural input costs for other materials, slows adoption in price-sensitive regions.
  • Additionally, the industry is highly susceptible to raw material price volatility and supply chain vulnerabilities, as disruptions in hydrocarbon processing or logistics can lead to sharp price spikes and inventory shortages during critical planting seasons.

Exclusive Technavio Analysis on Customer Landscape

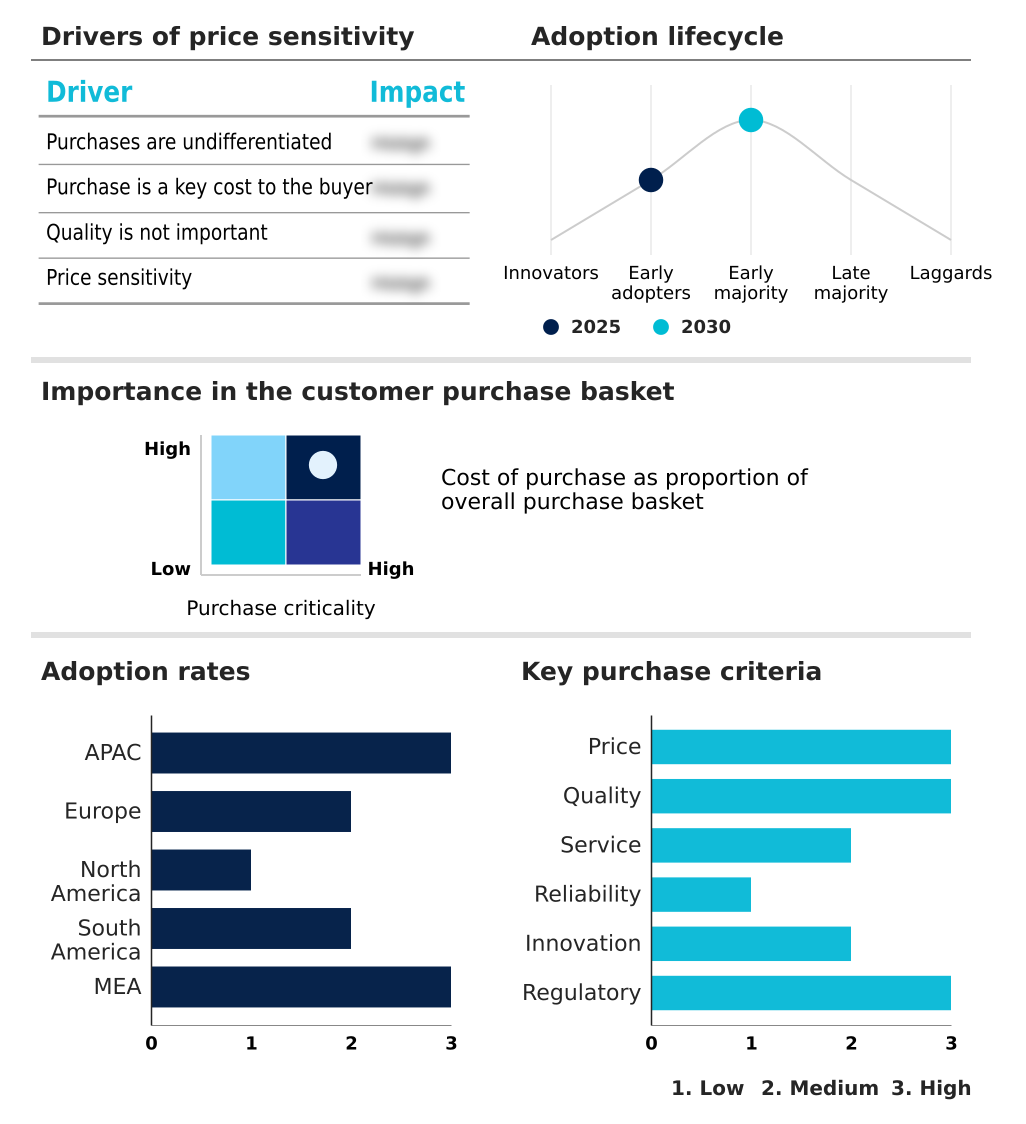
The agricultural mulch films market forecasting report includes the adoption lifecycle of the market, covering from the innovator’s stage to the laggard’s stage. It focuses on adoption rates in different regions based on penetration. Furthermore, the agricultural mulch films market report also includes key purchase criteria and drivers of price sensitivity to help companies evaluate and develop their market growth analysis strategies.

Customer Landscape of Agricultural Mulch Films Industry

Competitive Landscape

Companies are implementing various strategies, such as strategic alliances, agricultural mulch films market forecast, partnerships, mergers and acquisitions, geographical expansion, and product/service launches, to enhance their presence in the industry.

A.A. Politiv - The portfolio includes protective agricultural films, featuring high-barrier Totally Impermeable Films (TIF) and biodegradable options designed to optimize crop yields and support sustainable agriculture.

The industry research and growth report includes detailed analyses of the competitive landscape of the market and information about key companies, including:

  • A.A. Politiv
  • Ab Rani Plast Oy
  • Achilles Corp.
  • Armando Alvarez Group
  • Barbier Group
  • BASF SE
  • Berry Global Inc.
  • Daios Plastics S.A
  • Dow Chemical Co.
  • Exxon Mobil Corp.
  • Imaflex Inc.
  • Kingfa SCI. and TECH. Co. Ltd.
  • Mitsubishi Chemical Grp.
  • Novamont S.p.A.
  • PLASTIKA KRITIS SA
  • POLIFILM GmbH
  • RKW SE
  • SOTRAFA S.A
  • Trioplast Industrier AB

Qualitative and quantitative analysis of companies has been conducted to help clients understand the wider business environment as well as the strengths and weaknesses of key industry players. Data is qualitatively analyzed to categorize companies as pure play, category-focused, industry-focused, and diversified; it is quantitatively analyzed to categorize companies as dominant, leading, strong, tentative, and weak.

Recent Development and News in Agricultural mulch films market

  • In August 2024, Berry Global Group Inc. initiated a strategic partnership with a major agricultural technology firm in North America to deploy smart mulch film solutions aimed at optimizing yield in water-scarce regions.
  • In November 2024, the United Nations Environment Programme released a critical assessment on soil health, explicitly identifying agricultural plastics as a top-tier contaminant in global arable lands.
  • In February 2025, Dow Inc. unveiled a novel resin formulation for ultra-thin, high-strength multi-layer mulch films, enabling a 30% reduction in thickness without compromising tear resistance.
  • In March 2025, a comprehensive economic analysis by the Global Agricultural Economics Association revealed that high costs have stagnated adoption rates for biodegradable mulch films in emerging markets.

Dive into Technavio’s robust research methodology, blending expert interviews, extensive data synthesis, and validated models for unparalleled Agricultural Mulch Films Market insights. See full methodology.

Market Scope
Page number 287
Base year 2025
Historic period 2020-2024
Forecast period 2026-2030
Growth momentum & CAGR Accelerate at a CAGR of 6.6%
Market growth 2026-2030 USD 2346.1 million
Market structure Fragmented
YoY growth 2025-2026(%) 6.2%
Key countries China, India, Japan, Australia, South Korea, Indonesia, Germany, UK, France, Italy, The Netherlands, Spain, US, Canada, Mexico, Brazil, Argentina, Colombia, South Africa, Israel, Turkey, Saudi Arabia and UAE
Competitive landscape Leading Companies, Market Positioning of Companies, Competitive Strategies, and Industry Risks

Request Free Sample

Research Analyst Overview

  • The agricultural mulch films market is evolving from a commodity-driven industry to one defined by advanced polymer chemistry and sustainability mandates. The development of films using polybutylene adipate terephthalate (pbat) and other soil-biodegradable polymers is reshaping product portfolios, forcing a strategic pivot away from conventional low-density polyethylene (ldpe).
  • This transition is driven by the need to mitigate soil microbial diversity loss and address microplastic contamination. Innovations in resin formulation and multi-layer co-extrusion now allow for spectrally selective films that actively manage photosynthetically active radiation (par) and root zone temperature to influence crop morphogenesis. These technologies serve as powerful agronomic tools, offering enhanced crop protection benefits.
  • For instance, new resin formulations have enabled the production of films that are up to 30% thinner, significantly reducing material consumption and aligning with circular economy models. Boardroom decisions now center on balancing investment in R&D for such high-performance films against the persistent demand for cost-effective cultivation solutions.

What are the Key Data Covered in this Agricultural Mulch Films Market Research and Growth Report?

  • What is the expected growth of the Agricultural Mulch Films Market between 2026 and 2030?

    • USD 2.35 billion, at a CAGR of 6.6%

  • What segmentation does the market report cover?

    • The report is segmented by Application (Open farm, and Greenhouse), Type (Conventional, and Biodegradable), Product Type (Black, and Transparent) and Geography (APAC, Europe, North America, South America, Middle East and Africa)

  • Which regions are analyzed in the report?

    • APAC, Europe, North America, South America and Middle East and Africa

  • What are the key growth drivers and market challenges?

    • Accelerated transition toward biodegradable and soil-degradable film solutions, Environmental degradation and challenge of white pollution

  • Who are the major players in the Agricultural Mulch Films Market?

    • A.A. Politiv, Ab Rani Plast Oy, Achilles Corp., Armando Alvarez Group, Barbier Group, BASF SE, Berry Global Inc., Daios Plastics S.A, Dow Chemical Co., Exxon Mobil Corp., Imaflex Inc., Kingfa SCI. and TECH. Co. Ltd., Mitsubishi Chemical Grp., Novamont S.p.A., PLASTIKA KRITIS SA, POLIFILM GmbH, RKW SE, SOTRAFA S.A and Trioplast Industrier AB

Market Research Insights

  • The agricultural mulch films market is defined by a dynamic shift toward advanced plasticulture solutions and sustainable inputs. The adoption of high-performance mulch films is accelerating, as they have been shown to reduce water usage by up to 20% in arid regions, a critical factor for resource efficiency.
  • Precision agriculture integration is driving demand for smart mulch film solutions that are compatible with modern irrigation, enhancing crop protection benefits. This evolution from basic ground covers to sophisticated agronomic tools is evident in the development of films that optimize plant physiological processes.
  • The market is also shaped by a push for circularity, with advanced collection programs successfully reclaiming over 10,000 tons of conventional film in a single fiscal year, reflecting robust industry responses to circular economy demands. This focus on both performance and sustainability is reshaping procurement strategies across the sector.

We can help! Our analysts can customize this agricultural mulch films market research report to meet your requirements.

Get in touch

1. Executive Summary

1.1 Market overview

Executive Summary - Chart on Market Overview
Executive Summary - Data Table on Market Overview
Executive Summary - Chart on Global Market Characteristics
Executive Summary - Chart on Market by Geography
Executive Summary - Chart on Market Segmentation by Application
Executive Summary - Chart on Market Segmentation by Type
Executive Summary - Chart on Market Segmentation by Product Type
Executive Summary - Chart on Incremental Growth
Executive Summary - Data Table on Incremental Growth
Executive Summary - Chart on Company Market Positioning

2. Technavio Analysis

2.1 Analysis of price sensitivity, lifecycle, customer purchase basket, adoption rates, and purchase criteria

2.2 Criticality of inputs and Factors of differentiation

Chart on Overview on criticality of inputs and factors of differentiation

2.3 Factors of disruption

Chart on Overview on factors of disruption

2.4 Impact of drivers and challenges

Chart on Impact of drivers and challenges in 2025 and 2030

3. Market Landscape

3.1 Market ecosystem

Chart on Parent Market
Data Table on - Parent Market

3.2 Market characteristics

Chart on Market characteristics analysis

3.3 Value chain analysis

Chart on Value chain analysis

4. Market Sizing

4.1 Market definition

Data Table on Offerings of companies included in the market definition

4.2 Market segment analysis

Market segments

4.3 Market size 2025

4.4 Market outlook: Forecast for 2025-2030

Chart on Global - Market size and forecast 2025-2030 ($ million)
Data Table on Global - Market size and forecast 2025-2030 ($ million)
Chart on Global Market: Year-over-year growth 2025-2030 (%)
Data Table on Global Market: Year-over-year growth 2025-2030 (%)

5. Historic Market Size

5.1 Global Agricultural Mulch Films Market 2020 - 2024

Historic Market Size - Data Table on Global Agricultural Mulch Films Market 2020 - 2024 ($ million)

5.2 Application segment analysis 2020 - 2024

Historic Market Size - Application Segment 2020 - 2024 ($ million)

5.3 Type segment analysis 2020 - 2024

Historic Market Size - Type Segment 2020 - 2024 ($ million)

5.4 Product Type segment analysis 2020 - 2024

Historic Market Size - Product Type Segment 2020 - 2024 ($ million)

5.5 Geography segment analysis 2020 - 2024

Historic Market Size - Geography Segment 2020 - 2024 ($ million)

5.6 Country segment analysis 2020 - 2024

Historic Market Size - Country Segment 2020 - 2024 ($ million)

6. Qualitative Analysis

6.1 Impact of AI on the Global Agricultural Mulch Films Market

7. Five Forces Analysis

7.1 Five forces summary

Five forces analysis - Comparison between 2025 and 2030

7.2 Bargaining power of buyers

Bargaining power of buyers - Impact of key factors 2025 and 2030

7.3 Bargaining power of suppliers

Bargaining power of suppliers - Impact of key factors in 2025 and 2030

7.4 Threat of new entrants

Threat of new entrants - Impact of key factors in 2025 and 2030

7.5 Threat of substitutes

Threat of substitutes - Impact of key factors in 2025 and 2030

7.6 Threat of rivalry

Threat of rivalry - Impact of key factors in 2025 and 2030

7.7 Market condition

Chart on Market condition - Five forces 2025 and 2030

8. Market Segmentation by Application

8.1 Market segments

Chart on Application - Market share 2025-2030 (%)
Data Table on Application - Market share 2025-2030 (%)

8.2 Comparison by Application

Chart on Comparison by Application
Data Table on Comparison by Application

8.3 Open farm - Market size and forecast 2025-2030

Chart on Open farm - Market size and forecast 2025-2030 ($ million)
Data Table on Open farm - Market size and forecast 2025-2030 ($ million)
Chart on Open farm - Year-over-year growth 2025-2030 (%)
Data Table on Open farm - Year-over-year growth 2025-2030 (%)

8.4 Greenhouse - Market size and forecast 2025-2030

Chart on Greenhouse - Market size and forecast 2025-2030 ($ million)
Data Table on Greenhouse - Market size and forecast 2025-2030 ($ million)
Chart on Greenhouse - Year-over-year growth 2025-2030 (%)
Data Table on Greenhouse - Year-over-year growth 2025-2030 (%)

8.5 Market opportunity by Application

Market opportunity by Application ($ million)
Data Table on Market opportunity by Application ($ million)

9. Market Segmentation by Type

9.1 Market segments

Chart on Type - Market share 2025-2030 (%)
Data Table on Type - Market share 2025-2030 (%)

9.2 Comparison by Type

Chart on Comparison by Type
Data Table on Comparison by Type

9.3 Conventional - Market size and forecast 2025-2030

Chart on Conventional - Market size and forecast 2025-2030 ($ million)
Data Table on Conventional - Market size and forecast 2025-2030 ($ million)
Chart on Conventional - Year-over-year growth 2025-2030 (%)
Data Table on Conventional - Year-over-year growth 2025-2030 (%)

9.4 Biodegradable - Market size and forecast 2025-2030

Chart on Biodegradable - Market size and forecast 2025-2030 ($ million)
Data Table on Biodegradable - Market size and forecast 2025-2030 ($ million)
Chart on Biodegradable - Year-over-year growth 2025-2030 (%)
Data Table on Biodegradable - Year-over-year growth 2025-2030 (%)

9.5 Market opportunity by Type

Market opportunity by Type ($ million)
Data Table on Market opportunity by Type ($ million)

10. Market Segmentation by Product Type

10.1 Market segments

Chart on Product Type - Market share 2025-2030 (%)
Data Table on Product Type - Market share 2025-2030 (%)

10.2 Comparison by Product Type

Chart on Comparison by Product Type
Data Table on Comparison by Product Type

10.3 Black - Market size and forecast 2025-2030

Chart on Black - Market size and forecast 2025-2030 ($ million)
Data Table on Black - Market size and forecast 2025-2030 ($ million)
Chart on Black - Year-over-year growth 2025-2030 (%)
Data Table on Black - Year-over-year growth 2025-2030 (%)

10.4 Transparent - Market size and forecast 2025-2030

Chart on Transparent - Market size and forecast 2025-2030 ($ million)
Data Table on Transparent - Market size and forecast 2025-2030 ($ million)
Chart on Transparent - Year-over-year growth 2025-2030 (%)
Data Table on Transparent - Year-over-year growth 2025-2030 (%)

10.5 Market opportunity by Product Type

Market opportunity by Product Type ($ million)
Data Table on Market opportunity by Product Type ($ million)

11. Customer Landscape

11.1 Customer landscape overview

Analysis of price sensitivity, lifecycle, customer purchase basket, adoption rates, and purchase criteria

12. Geographic Landscape

12.1 Geographic segmentation

Chart on Market share by geography 2025-2030 (%)
Data Table on Market share by geography 2025-2030 (%)

12.2 Geographic comparison

Chart on Geographic comparison
Data Table on Geographic comparison

12.3 APAC - Market size and forecast 2025-2030

Chart on APAC - Market size and forecast 2025-2030 ($ million)
Data Table on APAC - Market size and forecast 2025-2030 ($ million)
Chart on APAC - Year-over-year growth 2025-2030 (%)
Data Table on APAC - Year-over-year growth 2025-2030 (%)
Chart on Regional Comparison - APAC
Data Table on Regional Comparison - APAC

12.3.1 China - Market size and forecast 2025-2030

Chart on China - Market size and forecast 2025-2030 ($ million)
Data Table on China - Market size and forecast 2025-2030 ($ million)
Chart on China - Year-over-year growth 2025-2030 (%)
Data Table on China - Year-over-year growth 2025-2030 (%)

12.3.2 India - Market size and forecast 2025-2030

Chart on India - Market size and forecast 2025-2030 ($ million)
Data Table on India - Market size and forecast 2025-2030 ($ million)
Chart on India - Year-over-year growth 2025-2030 (%)
Data Table on India - Year-over-year growth 2025-2030 (%)

12.3.3 Japan - Market size and forecast 2025-2030

Chart on Japan - Market size and forecast 2025-2030 ($ million)
Data Table on Japan - Market size and forecast 2025-2030 ($ million)
Chart on Japan - Year-over-year growth 2025-2030 (%)
Data Table on Japan - Year-over-year growth 2025-2030 (%)

12.3.4 Australia - Market size and forecast 2025-2030

Chart on Australia - Market size and forecast 2025-2030 ($ million)
Data Table on Australia - Market size and forecast 2025-2030 ($ million)
Chart on Australia - Year-over-year growth 2025-2030 (%)
Data Table on Australia - Year-over-year growth 2025-2030 (%)

12.3.5 South Korea - Market size and forecast 2025-2030

Chart on South Korea - Market size and forecast 2025-2030 ($ million)
Data Table on South Korea - Market size and forecast 2025-2030 ($ million)
Chart on South Korea - Year-over-year growth 2025-2030 (%)
Data Table on South Korea - Year-over-year growth 2025-2030 (%)

12.3.6 Indonesia - Market size and forecast 2025-2030

Chart on Indonesia - Market size and forecast 2025-2030 ($ million)
Data Table on Indonesia - Market size and forecast 2025-2030 ($ million)
Chart on Indonesia - Year-over-year growth 2025-2030 (%)
Data Table on Indonesia - Year-over-year growth 2025-2030 (%)

12.4 Europe - Market size and forecast 2025-2030

Chart on Europe - Market size and forecast 2025-2030 ($ million)
Data Table on Europe - Market size and forecast 2025-2030 ($ million)
Chart on Europe - Year-over-year growth 2025-2030 (%)
Data Table on Europe - Year-over-year growth 2025-2030 (%)
Chart on Regional Comparison - Europe
Data Table on Regional Comparison - Europe

12.4.1 Germany - Market size and forecast 2025-2030

Chart on Germany - Market size and forecast 2025-2030 ($ million)
Data Table on Germany - Market size and forecast 2025-2030 ($ million)
Chart on Germany - Year-over-year growth 2025-2030 (%)
Data Table on Germany - Year-over-year growth 2025-2030 (%)

12.4.2 UK - Market size and forecast 2025-2030

Chart on UK - Market size and forecast 2025-2030 ($ million)
Data Table on UK - Market size and forecast 2025-2030 ($ million)
Chart on UK - Year-over-year growth 2025-2030 (%)
Data Table on UK - Year-over-year growth 2025-2030 (%)

12.4.3 France - Market size and forecast 2025-2030

Chart on France - Market size and forecast 2025-2030 ($ million)
Data Table on France - Market size and forecast 2025-2030 ($ million)
Chart on France - Year-over-year growth 2025-2030 (%)
Data Table on France - Year-over-year growth 2025-2030 (%)

12.4.4 Italy - Market size and forecast 2025-2030

Chart on Italy - Market size and forecast 2025-2030 ($ million)
Data Table on Italy - Market size and forecast 2025-2030 ($ million)
Chart on Italy - Year-over-year growth 2025-2030 (%)
Data Table on Italy - Year-over-year growth 2025-2030 (%)

12.4.5 The Netherlands - Market size and forecast 2025-2030

Chart on The Netherlands - Market size and forecast 2025-2030 ($ million)
Data Table on The Netherlands - Market size and forecast 2025-2030 ($ million)
Chart on The Netherlands - Year-over-year growth 2025-2030 (%)
Data Table on The Netherlands - Year-over-year growth 2025-2030 (%)

12.4.6 Spain - Market size and forecast 2025-2030

Chart on Spain - Market size and forecast 2025-2030 ($ million)
Data Table on Spain - Market size and forecast 2025-2030 ($ million)
Chart on Spain - Year-over-year growth 2025-2030 (%)
Data Table on Spain - Year-over-year growth 2025-2030 (%)

12.5 North America - Market size and forecast 2025-2030

Chart on North America - Market size and forecast 2025-2030 ($ million)
Data Table on North America - Market size and forecast 2025-2030 ($ million)
Chart on North America - Year-over-year growth 2025-2030 (%)
Data Table on North America - Year-over-year growth 2025-2030 (%)
Chart on Regional Comparison - North America
Data Table on Regional Comparison - North America

12.5.1 US - Market size and forecast 2025-2030

Chart on US - Market size and forecast 2025-2030 ($ million)
Data Table on US - Market size and forecast 2025-2030 ($ million)
Chart on US - Year-over-year growth 2025-2030 (%)
Data Table on US - Year-over-year growth 2025-2030 (%)

12.5.2 Canada - Market size and forecast 2025-2030

Chart on Canada - Market size and forecast 2025-2030 ($ million)
Data Table on Canada - Market size and forecast 2025-2030 ($ million)
Chart on Canada - Year-over-year growth 2025-2030 (%)
Data Table on Canada - Year-over-year growth 2025-2030 (%)

12.5.3 Mexico - Market size and forecast 2025-2030

Chart on Mexico - Market size and forecast 2025-2030 ($ million)
Data Table on Mexico - Market size and forecast 2025-2030 ($ million)
Chart on Mexico - Year-over-year growth 2025-2030 (%)
Data Table on Mexico - Year-over-year growth 2025-2030 (%)

12.6 South America - Market size and forecast 2025-2030

Chart on South America - Market size and forecast 2025-2030 ($ million)
Data Table on South America - Market size and forecast 2025-2030 ($ million)
Chart on South America - Year-over-year growth 2025-2030 (%)
Data Table on South America - Year-over-year growth 2025-2030 (%)
Chart on Regional Comparison - South America
Data Table on Regional Comparison - South America

12.6.1 Brazil - Market size and forecast 2025-2030

Chart on Brazil - Market size and forecast 2025-2030 ($ million)
Data Table on Brazil - Market size and forecast 2025-2030 ($ million)
Chart on Brazil - Year-over-year growth 2025-2030 (%)
Data Table on Brazil - Year-over-year growth 2025-2030 (%)

12.6.2 Argentina - Market size and forecast 2025-2030

Chart on Argentina - Market size and forecast 2025-2030 ($ million)
Data Table on Argentina - Market size and forecast 2025-2030 ($ million)
Chart on Argentina - Year-over-year growth 2025-2030 (%)
Data Table on Argentina - Year-over-year growth 2025-2030 (%)

12.6.3 Colombia - Market size and forecast 2025-2030

Chart on Colombia - Market size and forecast 2025-2030 ($ million)
Data Table on Colombia - Market size and forecast 2025-2030 ($ million)
Chart on Colombia - Year-over-year growth 2025-2030 (%)
Data Table on Colombia - Year-over-year growth 2025-2030 (%)

12.7 Middle East and Africa - Market size and forecast 2025-2030

Chart on Middle East and Africa - Market size and forecast 2025-2030 ($ million)
Data Table on Middle East and Africa - Market size and forecast 2025-2030 ($ million)
Chart on Middle East and Africa - Year-over-year growth 2025-2030 (%)
Data Table on Middle East and Africa - Year-over-year growth 2025-2030 (%)
Chart on Regional Comparison - Middle East and Africa
Data Table on Regional Comparison - Middle East and Africa

12.7.1 South Africa - Market size and forecast 2025-2030

Chart on South Africa - Market size and forecast 2025-2030 ($ million)
Data Table on South Africa - Market size and forecast 2025-2030 ($ million)
Chart on South Africa - Year-over-year growth 2025-2030 (%)
Data Table on South Africa - Year-over-year growth 2025-2030 (%)

12.7.2 Israel - Market size and forecast 2025-2030

Chart on Israel - Market size and forecast 2025-2030 ($ million)
Data Table on Israel - Market size and forecast 2025-2030 ($ million)
Chart on Israel - Year-over-year growth 2025-2030 (%)
Data Table on Israel - Year-over-year growth 2025-2030 (%)

12.7.3 Turkey - Market size and forecast 2025-2030

Chart on Turkey - Market size and forecast 2025-2030 ($ million)
Data Table on Turkey - Market size and forecast 2025-2030 ($ million)
Chart on Turkey - Year-over-year growth 2025-2030 (%)
Data Table on Turkey - Year-over-year growth 2025-2030 (%)

12.7.4 Saudi Arabia - Market size and forecast 2025-2030

Chart on Saudi Arabia - Market size and forecast 2025-2030 ($ million)
Data Table on Saudi Arabia - Market size and forecast 2025-2030 ($ million)
Chart on Saudi Arabia - Year-over-year growth 2025-2030 (%)
Data Table on Saudi Arabia - Year-over-year growth 2025-2030 (%)

12.7.5 UAE - Market size and forecast 2025-2030

Chart on UAE - Market size and forecast 2025-2030 ($ million)
Data Table on UAE - Market size and forecast 2025-2030 ($ million)
Chart on UAE - Year-over-year growth 2025-2030 (%)
Data Table on UAE - Year-over-year growth 2025-2030 (%)

12.8 Market opportunity by geography

Market opportunity by geography ($ million)
Data Tables on Market opportunity by geography ($ million)

13. Drivers, Challenges, and Opportunity

13.1 Market drivers

Accelerated transition toward biodegradable and soil-degradable film solutions
Imperative for enhanced food security and agricultural yield optimization
Technological advancements in multi-layer and spectrally selective films

13.2 Market challenges

Environmental degradation and challenge of white pollution
Economic barriers and high cost of sustainable alternatives
Volatility in raw material prices and supply chain vulnerabilities

13.3 Impact of drivers and challenges

Impact of drivers and challenges in 2025 and 2030

13.4 Market opportunities

Emergence of nanotechnology-enhanced films for superior mechanical strength and downgauging
Rise of photo-selective smart films
Implementation of circular economy models and mechanical recycling

14. Competitive Landscape

14.1 Overview

14.2

Overview on criticality of inputs and factors of differentiation

14.3 Landscape disruption

Overview on factors of disruption

14.4 Industry risks

Impact of key risks on business

15. Competitive Analysis

15.1 Companies profiled

Companies covered

15.2 Company ranking index

15.3 Market positioning of companies

Matrix on companies position and classification

15.4 A.A. Politiv

A.A. Politiv - Overview
A.A. Politiv - Product / Service
A.A. Politiv - Key offerings
SWOT

15.5 Ab Rani Plast Oy

Ab Rani Plast Oy - Overview
Ab Rani Plast Oy - Product / Service
Ab Rani Plast Oy - Key offerings
SWOT

15.6 Armando Alvarez Group

Armando Alvarez Group - Overview
Armando Alvarez Group - Product / Service
Armando Alvarez Group - Key offerings
SWOT

15.7 Barbier Group

Barbier Group - Overview
Barbier Group - Product / Service
Barbier Group - Key offerings
SWOT

15.8 BASF SE

BASF SE - Overview
BASF SE - Business segments
BASF SE - Key news
BASF SE - Key offerings
BASF SE - Segment focus
SWOT

15.9 Berry Global Inc.

Berry Global Inc. - Overview
Berry Global Inc. - Business segments
Berry Global Inc. - Key news
Berry Global Inc. - Key offerings
Berry Global Inc. - Segment focus
SWOT

15.10 Dow Chemical Co.

Dow Chemical Co. - Overview
Dow Chemical Co. - Business segments
Dow Chemical Co. - Key news
Dow Chemical Co. - Key offerings
Dow Chemical Co. - Segment focus
SWOT

15.11 Exxon Mobil Corp.

Exxon Mobil Corp. - Overview
Exxon Mobil Corp. - Business segments
Exxon Mobil Corp. - Key news
Exxon Mobil Corp. - Key offerings
Exxon Mobil Corp. - Segment focus
SWOT

15.12 Imaflex Inc.

Imaflex Inc. - Overview
Imaflex Inc. - Product / Service
Imaflex Inc. - Key offerings
SWOT

15.13 Mitsubishi Chemical Grp.

Mitsubishi Chemical Grp. - Overview
Mitsubishi Chemical Grp. - Business segments
Mitsubishi Chemical Grp. - Key news
Mitsubishi Chemical Grp. - Key offerings
Mitsubishi Chemical Grp. - Segment focus
SWOT

15.14 Novamont S.p.A.

Novamont S.p.A. - Overview
Novamont S.p.A. - Product / Service
Novamont S.p.A. - Key offerings
SWOT

15.15 PLASTIKA KRITIS SA

PLASTIKA KRITIS SA - Overview
PLASTIKA KRITIS SA - Product / Service
PLASTIKA KRITIS SA - Key offerings
SWOT

15.16 POLIFILM GmbH

POLIFILM GmbH - Overview
POLIFILM GmbH - Product / Service
POLIFILM GmbH - Key offerings
SWOT

15.17 RKW SE

RKW SE - Overview
RKW SE - Product / Service
RKW SE - Key offerings
SWOT

15.18 Trioplast Industrier AB

Trioplast Industrier AB - Overview
Trioplast Industrier AB - Product / Service
Trioplast Industrier AB - Key offerings
SWOT

16. Appendix

16.1 Scope of the report

Market definition
Objectives
Notes and caveats

16.2 Inclusions and exclusions checklist

Inclusions checklist
Exclusions checklist

16.3 Currency conversion rates for US$

16.4 Research methodology

16.5 Data procurement

Information sources

16.6 Data validation

16.7 Validation techniques employed for market sizing

16.8 Data synthesis

16.9 360 degree market analysis

16.10 List of abbreviations

Research Methodology

Technavio presents a detailed picture of the market by way of study, synthesis, and summation of data from multiple sources. The analysts have presented the various facets of the market with a particular focus on identifying the key industry influencers. The data thus presented is comprehensive, reliable, and the result of extensive research, both primary and secondary.

INFORMATION SOURCES

Primary sources

  • Manufacturers and suppliers
  • Channel partners
  • Industry experts
  • Strategic decision makers

Secondary sources

  • Industry journals and periodicals
  • Government data
  • Financial reports of key industry players
  • Historical data
  • Press releases

DATA ANALYSIS

Data Synthesis

  • Collation of data
  • Estimation of key figures
  • Analysis of derived insights

Data Validation

  • Triangulation with data models
  • Reference against proprietary databases
  • Corroboration with industry experts

REPORT WRITING

Qualitative

  • Market drivers
  • Market challenges
  • Market trends
  • Five forces analysis

Quantitative

  • Market size and forecast
  • Market segmentation
  • Geographical insights
  • Competitive landscape

Interested in this report?

Get your sample now to see our research methodology and insights!

Download Now

Frequently Asked Questions

Agricultural Mulch Films market growth will increase by USD 2346.1 million during 2026-2030 .

The Agricultural Mulch Films market is expected to grow at a CAGR of 6.6% during 2026-2030 .

Agricultural Mulch Films market is segmented by Application (Open farm, Greenhouse) Type (Conventional, Biodegradable) Product type (Black, Transparent)

A.A. Politiv, Ab Rani Plast Oy, Achilles Corp., Armando Alvarez Group, Barbier Group, BASF SE, Berry Global Inc., Daios Plastics S.A, Dow Chemical Co., Exxon Mobil Corp., Imaflex Inc., Kingfa SCI. and TECH. Co. Ltd., Mitsubishi Chemical Grp., Novamont S.p.A., PLASTIKA KRITIS SA, POLIFILM GmbH, RKW SE, SOTRAFA S.A, Trioplast Industrier AB are a few of the key vendors in the Agricultural Mulch Films market.

APAC will register the highest growth rate of 51.5% among the other regions. Therefore, the Agricultural Mulch Films market in APAC is expected to garner significant business opportunities for the vendors during the forecast period.

China, India, Japan, Australia, South Korea, Indonesia, Germany, UK, France, Italy, The Netherlands, Spain, US, Canada, Mexico, Brazil, Argentina, Colombia, South Africa, Israel, Turkey, Saudi Arabia, UAE

  • Accelerated transition toward biodegradable and soil-degradable film solutions is the driving factor this market.

The Agricultural Mulch Films market vendors should focus on grabbing business opportunities from the Application segment as it accounted for the largest market share in the base year.