
AI For Invoice Management Market Size 2025-2029
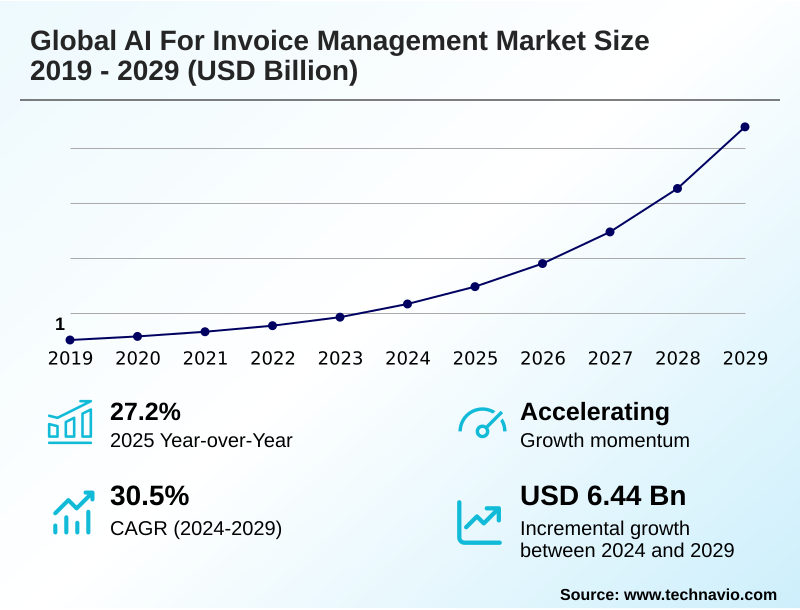
The ai for invoice management market size is valued to increase by USD 6.44 billion, at a CAGR of 30.5% from 2024 to 2029. Increasing demand for automation to enhance operational efficiency and reduce costs will drive the ai for invoice management market.
Major Market Trends & Insights
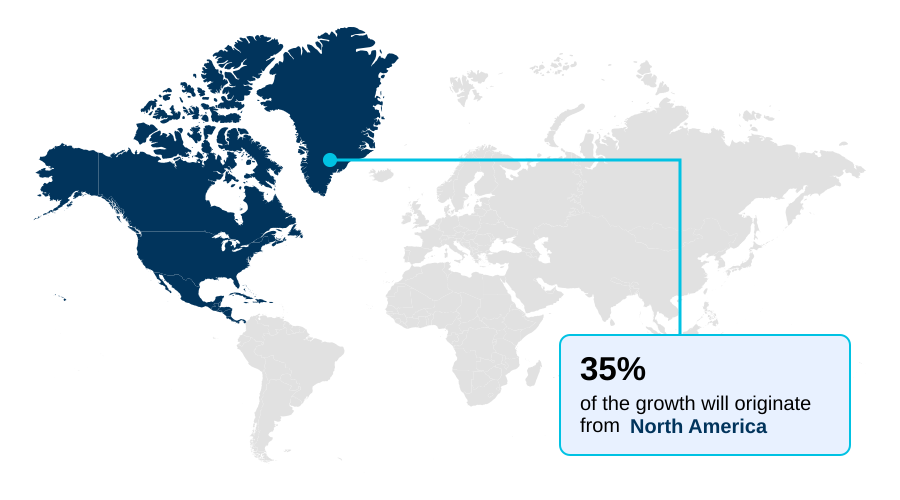
- North America dominated the market and accounted for a 35.3% growth during the forecast period.
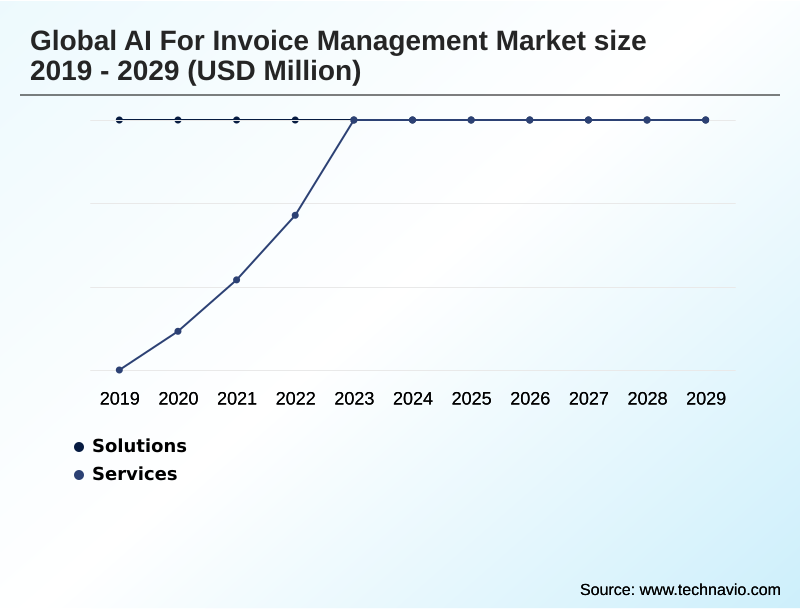
- By Component - Solutions segment was valued at in 2023
- By Application - Data extraction segment accounted for the largest market revenue share in 2023
Market Size & Forecast
- Market Opportunities: USD 7.74 billion
- Market Future Opportunities: USD 6.44 billion
- CAGR from 2024 to 2029 : 30.5%
Market Summary
- The AI for invoice management market is fundamentally altering financial operations by shifting from manual, error-prone tasks to intelligent, automated workflows. This transition is driven by the need for enhanced operational efficiency and strategic financial oversight. Core to this market is the application of technologies that enable procure-to-pay automation, which drastically reduces processing cycle times and minimizes human error.
- For instance, a global manufacturing firm can implement a system for automated three-way matching, ensuring that every invoice for raw materials automatically validates against purchase orders and goods-receipt notes in real-time. This not only prevents incorrect payments but also provides supply chain managers with immediate visibility into liabilities, strengthening supplier relationships and financial planning.
- While the benefits are clear, adoption is paced by the challenges of integrating these advanced systems with legacy enterprise infrastructure and concerns over data security, which tempers the rapid adoption of cloud-based platforms and generative AI-driven tools.
What will be the Size of the AI For Invoice Management Market during the forecast period?
Get Key Insights on Market Forecast (PDF) Get Free Sample
How is the AI For Invoice Management Market Segmented?
The ai for invoice management industry research report provides comprehensive data (region-wise segment analysis), with forecasts and estimates in "USD million" for the period 2025-2029, as well as historical data from 2019-2023 for the following segments.
- Component
- Solution
- Services
- Application
- Data extraction
- Automated invoice matching
- Fraud detection
- Invoice categorization
- Others
- End-user
- Automotive
- BFSI
- Consumer packaged goods
- Electronics
- Others
- Geography
- North America
- US
- Canada
- Mexico
- APAC
- China
- Japan
- India
- Europe
- Germany
- UK
- France
- Middle East and Africa
- Saudi Arabia
- UAE
- South Africa
- South America
- Brazil
- Argentina
- Colombia
- Rest of World (ROW)
- North America
By Component Insights
The solution segment is estimated to witness significant growth during the forecast period.
The market is segmented by component, application, end-user, and geography. The solutions segment forms the core of the global AI for invoice management market, comprising software platforms that manage the entire invoice lifecycle.
These systems leverage intelligent document processing and natural language processing for advanced invoice data extraction.
Key functionalities include automated two-way matching and three-way matching, which validate invoice data against purchase orders, achieving accuracy improvements of up to 25% over manual methods. Solutions also feature robust approval workflow automation and seamless expense management integration.
This drive toward touchless accounts payable processes, powered by sophisticated machine learning models, is essential for achieving operational efficiency. This segment is driven by the demand for streamlined financial back-office modernization and contextual data interpretation.
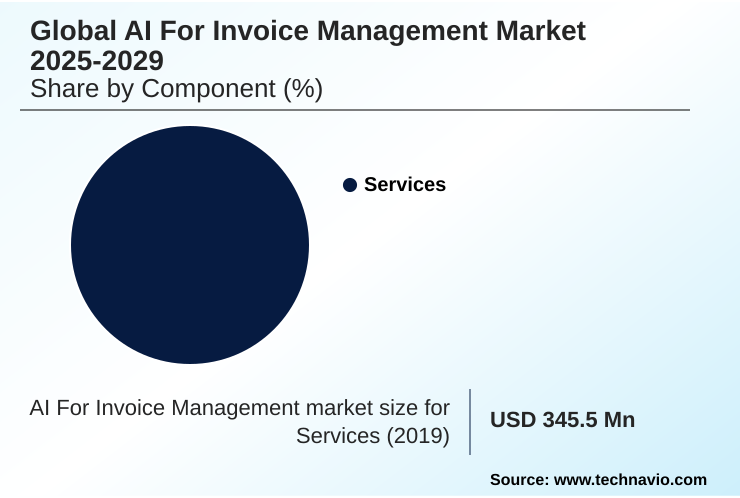
The Solution segment was valued at in 2023 and showed a gradual increase during the forecast period.
Regional Analysis
North America is estimated to contribute 35.3% to the growth of the global market during the forecast period.Technavio’s analysts have elaborately explained the regional trends and drivers that shape the market during the forecast period.
See How AI For Invoice Management Market Demand is Rising in North America Get Free Sample
The geographic landscape of the global AI for invoice management market is diverse, with adoption patterns reflecting regional economic and regulatory priorities.
North America leads in maturity and accounts for over 35% of incremental growth, driven by a strategic focus on operational cost reduction and gaining a competitive edge.
In contrast, markets in Europe and South America are heavily influenced by regulatory compliance automation, with government e-invoicing mandates and real-time digital reporting requirements compelling businesses to adopt AI solutions.
APAC is the fastest-growing region, with a growth trajectory approximately 3% higher than in North America, as businesses there are leapfrogging legacy systems to adopt modern cloud platforms.
The need for payment fraud prevention and enhanced supplier onboarding automation is a universal driver, although the complexity of e-invoicing frameworks varies significantly by country, demanding localized AI-driven solutions.
Market Dynamics
Our researchers analyzed the data with 2024 as the base year, along with the key drivers, trends, and challenges. A holistic analysis of drivers will help companies refine their marketing strategies to gain a competitive advantage.
- The strategic adoption of AI for invoice management is transforming financial departments from cost centers into value-driven hubs, with a clear focus on achieving comprehensive automation and intelligence. Organizations are increasingly looking at AI for automated invoice validation, which goes beyond simple data checks to ensure complete compliance and accuracy.
- The rise of generative AI in accounts payable is a game-changer, enabling systems to understand context and automate complex tasks. This is evident in the growing use of machine learning for fraud detection, which can identify anomalies that legacy rule-based systems would miss.
- Similarly, the use of NLP for invoice data extraction allows for the processing of unstructured documents with remarkable precision. Businesses are now focused on automating the three-way matching process to achieve touchless processing. For many, the goal is to find AI solutions for SAP integration or integration with other legacy ERP systems, which remains a significant hurdle.
- The tangible benefits of touchless invoice processing are compelling, as it leads to optimizing DPO with AI platforms. Companies that have implemented AI-based GL code suggestion report that accountants' time spent on manual coding is reduced by more than half. Furthermore, the deployment of AI platforms for supply chain finance is strengthening supplier ecosystems.
- Achieving a significant reduction in invoice cycle time with AI is a key performance indicator, as is leveraging AI for dynamic discounting strategy to improve working capital. Finally, using AI for Sarbanes-Oxley Act compliance and automating VAT compliance checks with AI are becoming standard practice, driven by the need for robust, auditable financial controls.
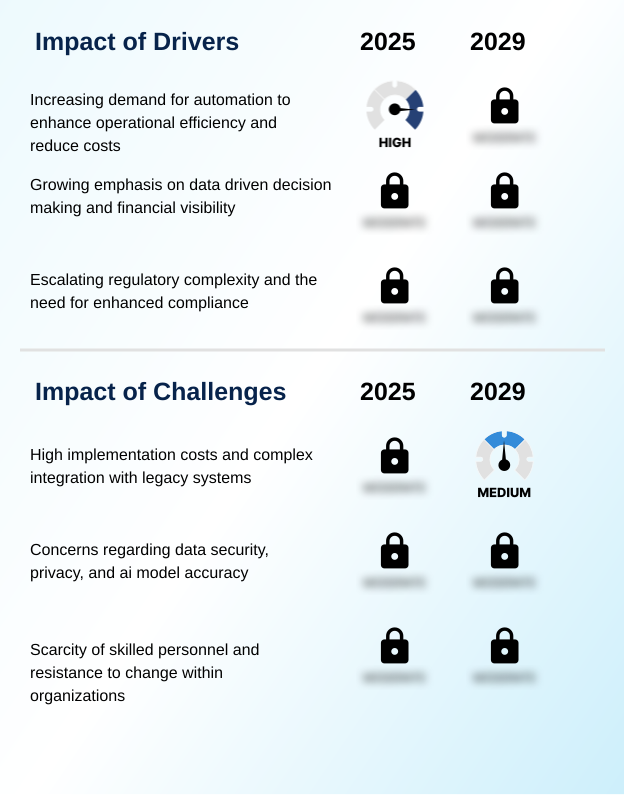
What are the key market drivers leading to the rise in the adoption of AI For Invoice Management Industry?
- The increasing demand for automation to enhance operational efficiency and reduce costs is a key driver for the market.
- A primary driver for the global AI for invoice management market is the pursuit of significant operational efficiencies and cost savings, with businesses reporting up to an 80% reduction in processing costs per invoice.
- The adoption of robotic process automation and AI-powered accounts payable automation transforms the finance function into a strategic asset. By enabling real-time spend visibility and providing sophisticated spend analytics dashboards, these platforms empower organizations with data-driven financial insights.
- This enhanced visibility is crucial for effective working capital optimization.
- Furthermore, the growing complexity of global e-invoicing mandates and the need for robust payment fraud prevention are compelling companies to invest in systems that ensure continuous regulatory compliance and security, as early payment discount capture can improve margins by 1-2%.
What are the market trends shaping the AI For Invoice Management Industry?
- The market is witnessing a significant evolution from simple automation to a more comprehensive hyperautomation strategy. This shift impacts the entire procure-to-pay cycle.
- The global AI for invoice management market is rapidly advancing from basic automation to hyperautomation, where intelligent, interconnected systems manage the entire financial workflow. The integration of a generative AI copilot is a transformative trend, enabling platforms to perform cognitive data capture and suggest intelligent GL code assignments with over 95% accuracy.
- This move toward touchless invoice processing is streamlining the invoice lifecycle management by embedding AI within the core spend management platform. The technology is not only improving invoice validation rules but is also automating communications for exception handling workflows.
- This evolution enables financial professionals to shift focus from manual tasks to strategic analysis, leveraging systems that provide predictive insights rather than just transactional processing, automating up to 80% of exception handling communications.
What challenges does the AI For Invoice Management Industry face during its growth?
- High implementation costs and the complexity of integrating with legacy systems present a key challenge affecting industry growth.
- Despite clear benefits, the adoption of AI for invoice management faces significant challenges, primarily high implementation costs and the difficulty of integrating with legacy ERP systems, which can account for over 50% of total project costs. Concerns regarding data security and the accuracy of machine learning models create apprehension, particularly with the transfer of sensitive financial data to third-party platforms.
- The lack of model explainability, or a 'black box' problem, can foster mistrust. Moreover, a persistent scarcity of skilled personnel and cultural resistance to change within organizations present substantial human-centric barriers.
- Industry data shows that a lack of trained staff who understand both finance and AI delays adoption in over 40% of implementation projects, hampering the ability to achieve full financial audit trail automation and manage supplier risk assessment effectively.
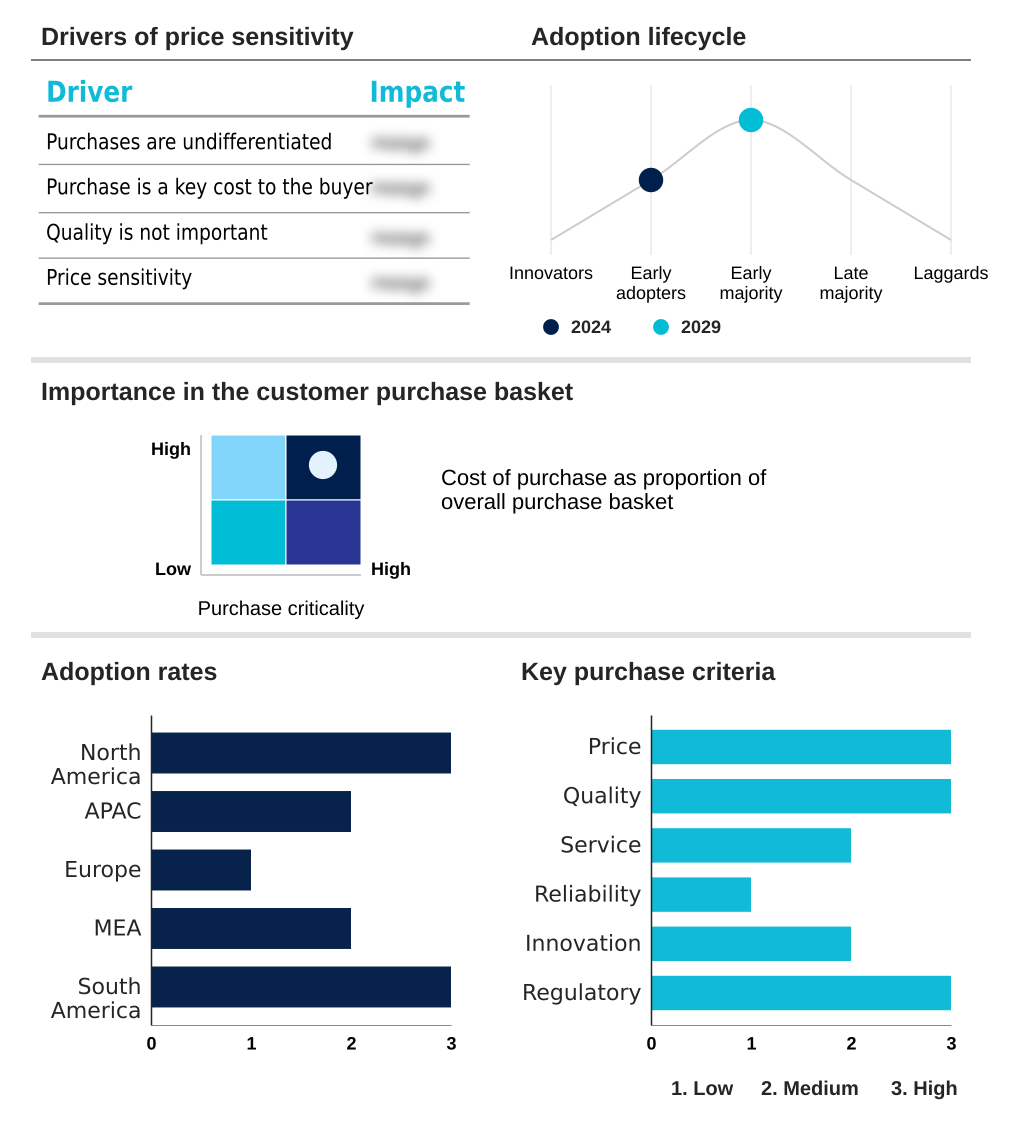
Exclusive Technavio Analysis on Customer Landscape
The ai for invoice management market forecasting report includes the adoption lifecycle of the market, covering from the innovator’s stage to the laggard’s stage. It focuses on adoption rates in different regions based on penetration. Furthermore, the ai for invoice management market report also includes key purchase criteria and drivers of price sensitivity to help companies evaluate and develop their market growth analysis strategies.
Customer Landscape of AI For Invoice Management Industry
Competitive Landscape
Companies are implementing various strategies, such as strategic alliances, ai for invoice management market forecast, partnerships, mergers and acquisitions, geographical expansion, and product/service launches, to enhance their presence in the industry.
AvidXchange Inc. - AI-powered source-to-pay suites provide end-to-end automation, from intelligent data capture and GL coding to streamlined payment execution for mid-market financial operations.
The industry research and growth report includes detailed analyses of the competitive landscape of the market and information about key companies, including:
- AvidXchange Inc.
- Brex
- BTRS Holdings Inc.
- Coupa Software Inc.
- Docsumo Pte. Ltd.
- Klippa App B.V.
- Medius Sverige AB
- Nano Net Technologies Inc.
- Pleo Technologies
- Rossum
- Sage Group Plc
- SAP SE
- Stampli
- Tipalti Inc.
- UiPath Inc.
- Vic.ai Inc.
- Yokoy
Qualitative and quantitative analysis of companies has been conducted to help clients understand the wider business environment as well as the strengths and weaknesses of key industry players. Data is qualitatively analyzed to categorize companies as pure play, category-focused, industry-focused, and diversified; it is quantitatively analyzed to categorize companies as dominant, leading, strong, tentative, and weak.
Recent Development and News in Ai for invoice management market
- In August 2024, SAP SE announced the expansion of its generative AI capabilities, including its AI copilot Joule, embedding it within its financial management solutions to bring intelligent invoice automation directly into the core ERP environment.
- In September 2024, the German government formally mandated B2B e-invoicing starting in January 2025, creating a direct and urgent need for compliant technological solutions and driving AI adoption for regulatory adherence.
- In November 2024, Microsoft demonstrated new features for its Dynamics 365 Copilot, using generative AI to fully automate the task of invoice coding and allowing users to perform deep dives into accounts payable data using natural language queries.
- In February 2025, Oracle announced significant AI enhancements to its Oracle Fusion Cloud ERP, focusing on improving touchless invoice processing through more intelligent document recognition and automated validation, tightening the link between accounts payable and broader financial operations.
Dive into Technavio’s robust research methodology, blending expert interviews, extensive data synthesis, and validated models for unparalleled AI For Invoice Management Market insights. See full methodology.
| Market Scope | |
|---|---|
| Page number | 305 |
| Base year | 2024 |
| Historic period | 2019-2023 |
| Forecast period | 2025-2029 |
| Growth momentum & CAGR | Accelerate at a CAGR of 30.5% |
| Market growth 2025-2029 | USD 6438.6 million |
| Market structure | Fragmented |
| YoY growth 2024-2025(%) | 27.2% |
| Key countries | US, Canada, Mexico, China, Japan, India, South Korea, Australia, Indonesia, Germany, UK, France, Italy, Spain, The Netherlands, Saudi Arabia, UAE, South Africa, Israel, Turkey, Brazil, Argentina and Colombia |
| Competitive landscape | Leading Companies, Market Positioning of Companies, Competitive Strategies, and Industry Risks |
Research Analyst Overview
- The AI for invoice management market is defined by a strategic move toward comprehensive procure-to-pay automation. This involves the deployment of machine learning models for tasks ranging from initial invoice data extraction and cognitive data capture to complex validation.
- Utilizing technologies like optical character recognition and more advanced intelligent document processing, platforms now execute automated two-way matching and three-way matching with high accuracy. This level of automation, which can reduce invoice processing times by over 70%, is central to achieving touchless invoice processing.
- A key trend is the integration of a generative AI copilot, which elevates the user experience and is compelling boardrooms to reconsider workforce development and upskilling strategies. These platforms are not just standalone tools but are integral to the broader financial operations platform, often requiring deep expense management integration and approval workflow automation.
- With the rise of global e-invoicing mandates, solutions offering automated compliance checks and adherence to standards like VAT in the digital age are essential. This further extends to enabling strategic financial levers such as dynamic discounting and supply chain finance through a robust payment optimization engine and real-time spend analytics dashboards.
What are the Key Data Covered in this AI For Invoice Management Market Research and Growth Report?
-
What is the expected growth of the AI For Invoice Management Market between 2025 and 2029?
-
USD 6.44 billion, at a CAGR of 30.5%
-
-
What segmentation does the market report cover?
-
The report is segmented by Component (Solutions, and Services), Application (Data extraction, Automated invoice matching, Fraud detection, Invoice categorization, and Others), End-user (Automotive, BFSI, Consumer packaged goods, Electronics, and Others) and Geography (North America, APAC, Europe, Middle East and Africa, South America)
-
-
Which regions are analyzed in the report?
-
North America, APAC, Europe, Middle East and Africa and South America
-
-
What are the key growth drivers and market challenges?
-
Increasing demand for automation to enhance operational efficiency and reduce costs, High implementation costs and complex integration with legacy systems
-
-
Who are the major players in the AI For Invoice Management Market?
-
AvidXchange Inc., Brex, BTRS Holdings Inc., Coupa Software Inc., Docsumo Pte. Ltd., Klippa App B.V., Medius Sverige AB, Nano Net Technologies Inc., Pleo Technologies, Rossum, Sage Group Plc, SAP SE, Stampli, Tipalti Inc., UiPath Inc., Vic.ai Inc. and Yokoy
-
Market Research Insights
- The dynamics of the AI for invoice management market are shaped by a strong push for strategic financial management over reactive transaction processing. Organizations leveraging AI-powered spend analysis report a 30% greater ability to identify and curb maverick spending compared to those using manual methods.
- This capability is enabled by real-time spend visibility and automated expense categorization, which transforms the entire procure-to-pay lifecycle. Furthermore, advanced platforms now feature invoice anomaly detection, which can reduce fraudulent or duplicate payments by over 90%.
- This shift empowers finance teams by automating routine tasks such as purchase order validation and goods receipt note matching, allowing them to focus on high-value activities. The adoption of AI not only delivers operational cost reduction but also provides the data-driven financial insights necessary for competitive agility.
We can help! Our analysts can customize this ai for invoice management market research report to meet your requirements.
 RIA -
RIA - 
