AI GPU Orchestration Platforms Market Analysis, Size, and Forecast 2026-2030: North America (US, Canada, and Mexico), Europe (UK, Germany, and France), APAC (China, Japan, and India), South America (Brazil, Argentina, and Colombia), Middle East and Africa (Saudi Arabia, Israel, and UAE), and Rest of World (ROW)

AI GPU Orchestration Platforms Market Analysis, Size, and Forecast 2026-2030:
North America (US, Canada, and Mexico), Europe (UK, Germany, and France), APAC (China, Japan, and India), South America (Brazil, Argentina, and Colombia), Middle East and Africa (Saudi Arabia, Israel, and UAE), and Rest of World (ROW)

Published: May 2026 315 Pages SKU: IRTNTR81372

Market Overview at a Glance

$6.59 B
Market Opportunity
25.9%
CAGR 2025 - 2030
36.3%
North America Growth
$1.40 B
Cloud segment 2024

Ai Gpu Orchestration Platforms Market Size and Growth Forecast 2026-2030

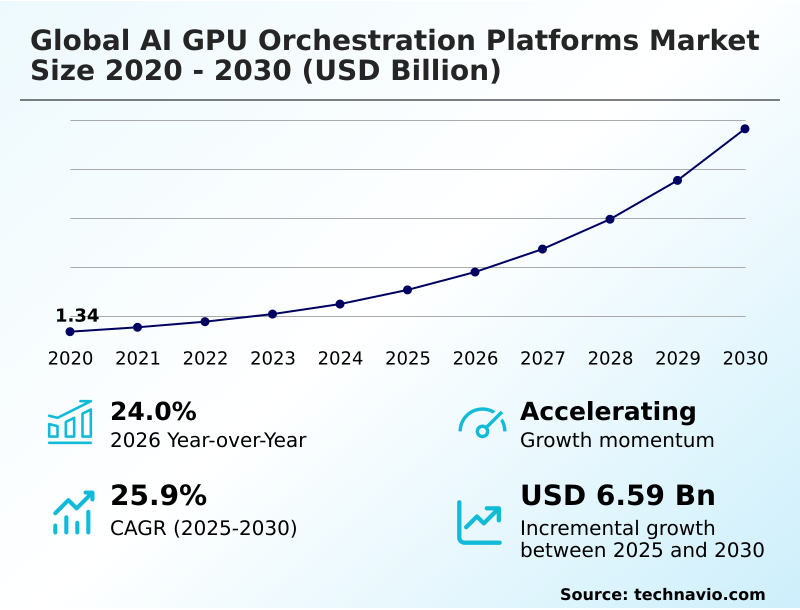
The Ai Gpu Orchestration Platforms Market size was valued at USD 3.05 billion in 2025 growing at a CAGR of 25.9% during the forecast period 2026-2030.

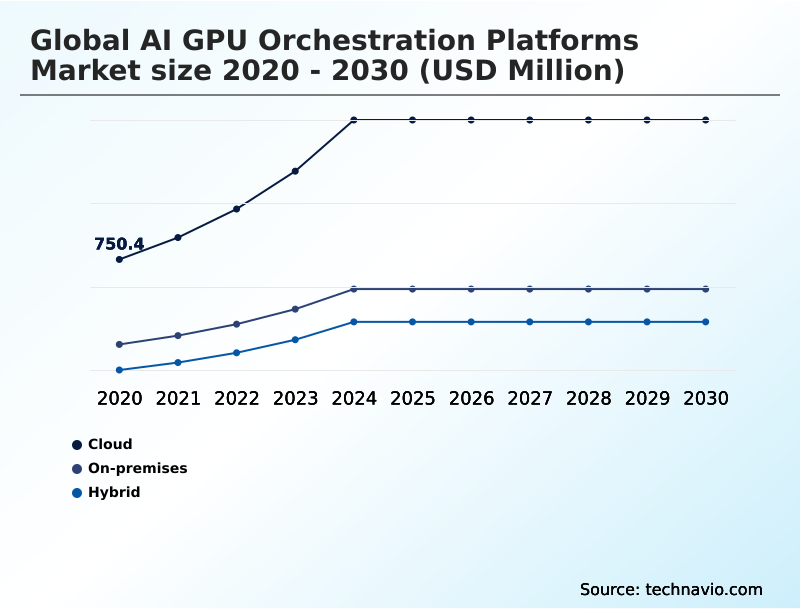
North America accounts for 36.3% of incremental growth during the forecast period. The Cloud segment by Deployment was valued at USD 1.40 billion in 2024, while the Tech companies segment holds the largest revenue share by End-user.

The market is projected to grow by USD 8.30 billion from 2020 to 2030, with USD 6.59 billion of the growth expected during the forecast period of 2025 to 2030.

Get Key Insights on Market Forecast (PDF) Request Free Sample

Ai Gpu Orchestration Platforms Market Overview

The AI GPU orchestration platforms market is expanding as organizations seek to maximize the efficiency of computational resources, with North America leading incremental growth at 36.3% of the global opportunity. Demand is driven by the need for efficient GPU utilization in training and deploying complex models. This requires sophisticated job scheduling and resource allocation to manage generative AI workloads effectively. In practice, a financial services firm implementing an enterprise MLOps platform for algorithmic trading can use GPU partitioning to run hundreds of back-testing simulations concurrently on a shared cluster, reducing model validation cycles from days to hours. However, the market faces constraints from a severe talent deficit in skills related to machine learning infrastructure and distributed systems. This skills gap can impede the adoption of advanced tools for AI model lifecycle management, forcing some firms to rely on less optimal, manual processes for AI infrastructure management.

Drivers, Trends, and Challenges in the Ai Gpu Orchestration Platforms Market

Procurement decisions in the AI GPU orchestration platforms market are increasingly shaped by the need for managing multi-cloud GPU resources and achieving high GPU utilization rates. With the cloud segment representing a significantly larger share than on-premises deployments, enterprises are focused on optimizing the cost of AI training through sophisticated cost management for generative AI.

This involves not just acquiring compute power but implementing a hybrid cloud strategy for AI workloads that balances performance with expenditure. For example, an automotive manufacturer developing autonomous driving systems leverages platforms for orchestrating GPU resources for LLMs to run massive simulations. By using tools that simplify Kubernetes for data scientists, they can accelerate development cycles.

However, this process is constrained by security concerns, which drives the adoption of confidential computing in shared GPU clusters. The recent International Energy Agency guideline on reporting AI hardware power usage adds another layer of complexity, making energy efficient AI infrastructure management a key vendor qualification criterion and a central part of automating MLOps with GPU orchestration.

Migrating AI workloads across clouds remains a challenge, pushing vendors to improve tools for automated deployment of AI models.

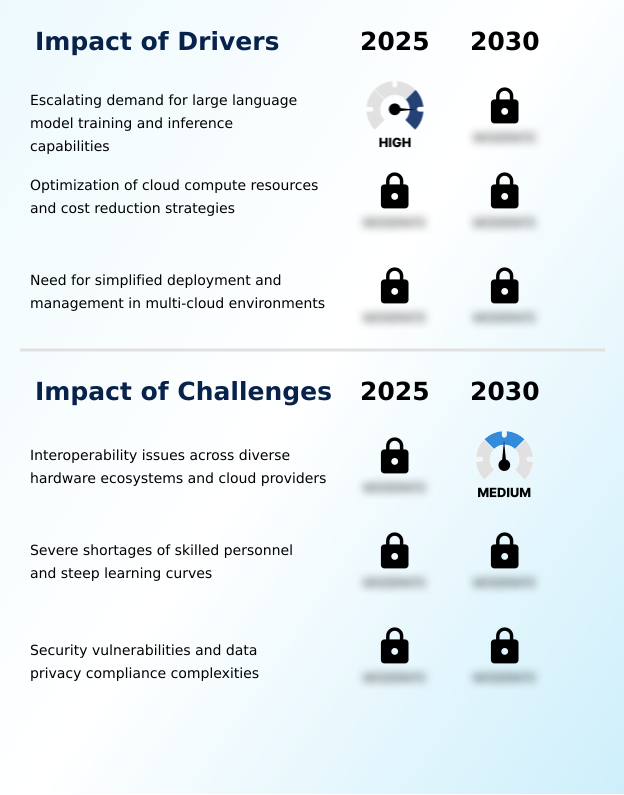
Primary Growth Driver: The escalating demand for training and inference capabilities for large language models is a primary driver for the AI GPU orchestration platforms market.

The primary force propelling the market is the escalating demand for computational power for large language model inference and training.

North America, contributing 36.32% of the market's incremental growth, exemplifies this trend as technology firms race to deploy sophisticated generative AI workloads. This demand necessitates solutions that enable efficient GPU utilization and scalable AI solutions.

Second, financial pressure to optimize cloud compute resources and reduce the total cost of ownership on expensive hardware drives adoption. Platforms offering fractional GPU sharing and automated resource provisioning allow enterprises to maximize hardware ROI.

Third, the complexity of modern multi-cloud and hybrid infrastructures makes a unified AI platform for AI model lifecycle management essential for simplifying deployment and ensuring operational consistency across environments.

Emerging Market Trend: The integration of edge computing with GPU orchestration platforms is emerging as a significant trend. This convergence addresses the need for real-time AI processing by reducing latency in industrial automation and autonomous systems.

Market evolution is characterized by the convergence of AI infrastructure management with decentralized architectures, reflecting a year-over-year growth of 24.0%. The integration of edge AI orchestration with centralized cluster management is critical for delivering real-time inference in applications like industrial automation. This requires platforms capable of managing heterogeneous hardware across a continuum of devices.

Another key development is the focus on sustainable operations, with energy-efficient scheduling becoming a standard feature to address environmental regulations and high operational costs. Advanced security protocols, including confidential computing for AI and zero-trust frameworks, are being implemented to protect sensitive data during processing, a crucial feature for securing multi-tenant AI environments in sectors like finance and healthcare.

This shift addresses the need for robust, secure, and efficient AI pipeline orchestration.

Key Industry Challenge: Interoperability issues across diverse hardware ecosystems and cloud providers present a key challenge affecting the growth of the AI GPU orchestration platforms industry.

Significant hurdles constrain the market, led by interoperability issues across a fragmented landscape of heterogeneous hardware and proprietary cloud APIs. This lack of standardization complicates AI workload migration and limits the effectiveness of a multi-cloud AI strategy.

A second major challenge is the severe shortage of skilled professionals with expertise in distributed systems and machine learning infrastructure, creating a steep learning curve for adoption. This talent deficit often prevents organizations from leveraging advanced features like confidential computing for AI. Finally, security vulnerabilities in multi-tenant environments and the complexities of data privacy compliance remain critical concerns.

The computational overhead required for robust security measures, such as securing multi-tenant AI environments, can degrade performance, presenting a difficult trade-off for enterprises seeking both efficiency and data protection.

Explore Full Market Dynamics Analysis Request Free Sample

Ai Gpu Orchestration Platforms Market Segmentation

The ai gpu orchestration platforms industry research report provides comprehensive data including region-wise segment analysis, with forecasts and analysis for the period 2026-2030, as well as historical data from 2020-2024 for the following segments.

Market Segment by Deployment
  • Cloud
  • On-premises
  • Hybrid
Market Segment by End-user
  • Tech companies
  • BFSI
  • Healthcare
  • Manufacturing
  • Research and academia
Market Segment by Application
  • Workload orchestration
  • GPU scheduling and allocation
  • Cluster management
  • Multi-tenancy and governance
  • Cost optimization
Market Segment by Geography
North America
US, Canada, Mexico
Europe
UK, Germany, France, Italy, The Netherlands, Spain
APAC
China, Japan, India, South Korea, Australia, Indonesia
South America
Brazil, Argentina, Colombia
Middle East and Africa
Saudi Arabia, Israel, UAE, South Africa, Turkey

Deployment Segment Analysis

The cloud segment is estimated to witness significant growth during the forecast period.

The cloud deployment model dominates the AI GPU orchestration platforms market, accounting for over half of all deployments and exhibiting a year-over-year growth of 24.0%.

Enterprises are leveraging cloud environments for their inherent flexibility and the ability to employ dynamic scaling for variable AI workloads. This approach facilitates an operational expenditure model, crucial for managing the high costs of high-performance computing.

Cloud native AI/ML practices are becoming standard, with platforms providing serverless GPU computing and automated resource provisioning to minimize hardware idle time.

These solutions streamline AI workload migration and support complex multi-cloud AI strategy, integrating cost optimization algorithms to ensure financial efficiency and accelerate AI pipeline orchestration for faster time-to-market.

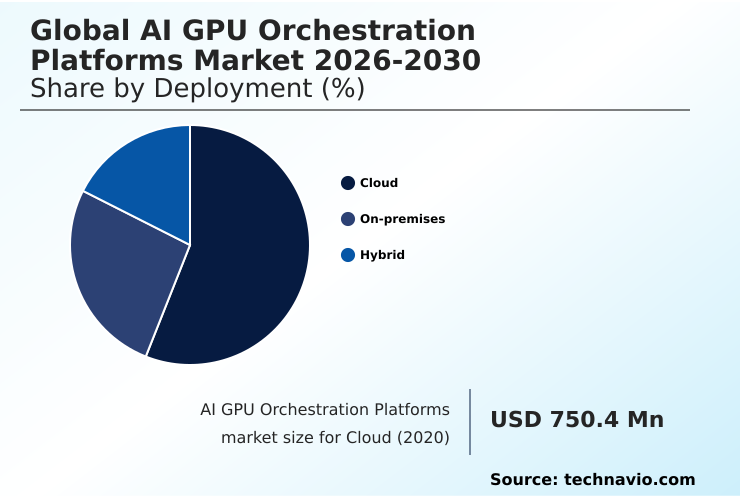
The Cloud segment was valued at USD 1.40 billion in 2024 and showed a gradual increase during the forecast period.

Ai Gpu Orchestration Platforms Market by Region: North America Leads with 36.3% Growth Share

North America is estimated to contribute 36.3% to the growth of the global market during the forecast period.

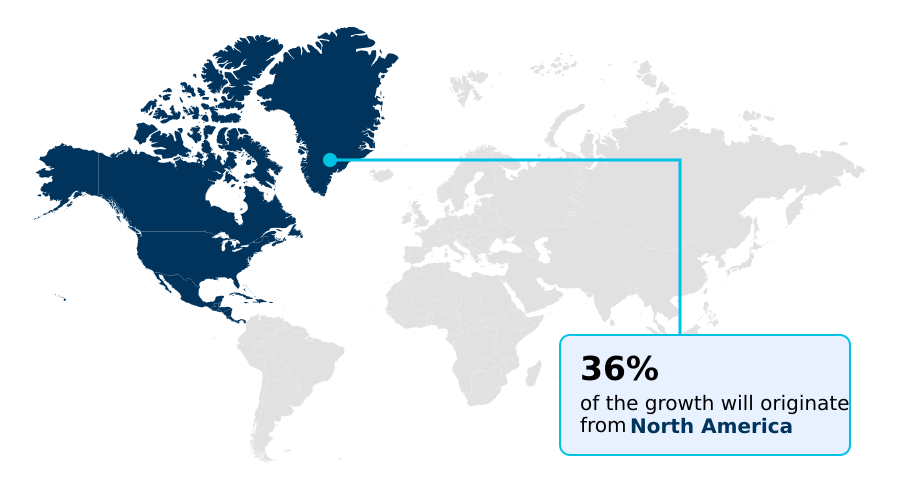
The geographic distribution of the AI GPU orchestration platforms market is led by North America, which accounts for 36.32% of incremental growth, driven by its concentration of hyperscale cloud providers and AI research hubs.

The region's advanced high-performance computing ecosystem provides an ideal environment for complex workload automation and MLOps integration.

APAC is the fastest-growing region, with a 27.2% CAGR, fueled by government-backed digital transformation initiatives and the expansion of domestic technology firms that require scalable AI solutions.

Europe, contributing 25.32% to growth, focuses on deployments that adhere to strict data sovereignty and energy efficiency standards, influencing the design of private AI cloud solutions.

This regional differentiation underscores the need for platforms capable of supporting both AI supercomputing scale and compliance with localized governance frameworks like the EU's proposed AI Act.

Customer Landscape Analysis for the Ai Gpu Orchestration Platforms Market

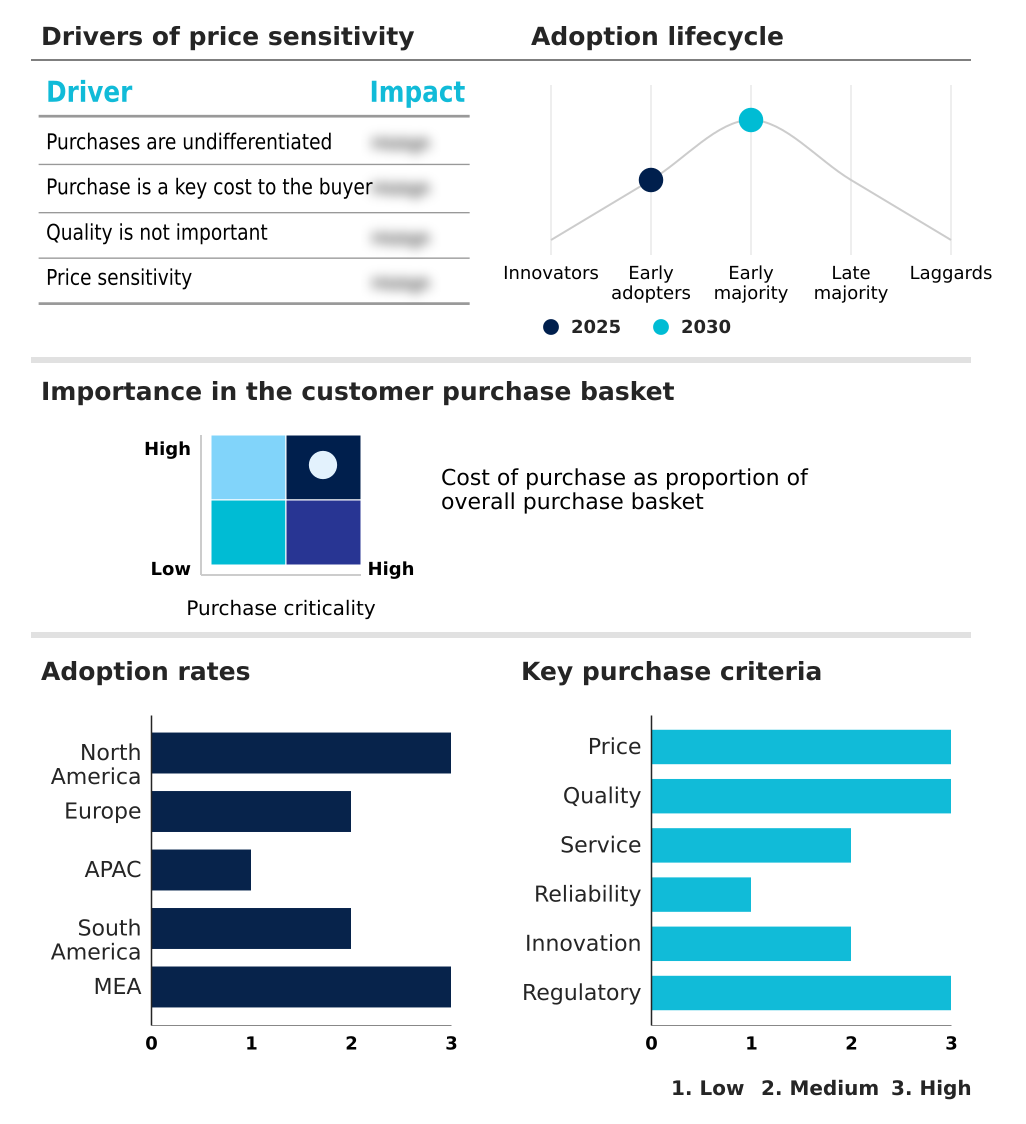
The ai gpu orchestration platforms market forecasting report includes the adoption lifecycle of the market, covering from the innovator’s stage to the laggard’s stage. It focuses on adoption rates in different regions based on penetration. Furthermore, the ai gpu orchestration platforms market report also includes key purchase criteria and drivers of price sensitivity to help companies evaluate and develop their market growth analysis strategies.

Competitive Landscape of the Ai Gpu Orchestration Platforms Market

Companies are implementing various strategies, such as strategic alliances, partnerships, mergers and acquisitions, geographical expansion, and product/service launches, to enhance their presence in the ai gpu orchestration platforms market industry.

Amazon.com Inc. - Key offerings feature platforms for managing and optimizing GPU resources for AI workloads, enabling efficient deployment from development through production across diverse and complex computing environments.

The industry research and growth report includes detailed analyses of the competitive landscape of the market and information about key companies, including:

  • Amazon.com Inc.
  • Anyscale Inc
  • Broadcom Inc.
  • ClearML Inc
  • Databricks Inc.
  • DigitalOcean Holdings Inc.
  • Domino Data Lab Inc.
  • Google LLC
  • Hewlett Packard Enterprise Co.
  • IBM Corp.
  • Intel Corp.
  • Lambda Labs, Inc.
  • Lightning AI
  • Microsoft Corp.
  • NVIDIA Corp.
  • Together AI
  • VULTR

Qualitative and quantitative analysis of companies has been conducted to help clients understand the wider business environment as well as the strengths and weaknesses of key industry players. Data is qualitatively analyzed to categorize companies as pure play, category-focused, industry-focused, and diversified; it is quantitatively analyzed to categorize companies as dominant, leading, strong, tentative, and weak.

Recent Developments in the Ai Gpu Orchestration Platforms Market

  • In March 2025, CoreWeave announced a strategic agreement to provide AI infrastructure to OpenAI, aimed at expanding OpenAI's compute capacity for training and large-scale model deployment.
  • In March 2025, CoreWeave announced an agreement to acquire Weights and Biases, a prominent AI developer platform, to create a more comprehensive, end-to-end solution for its purpose-built cloud offering.
  • In March 2025, the International Energy Agency introduced a new regulatory guideline requiring major enterprise data centers to report hourly power consumption metrics tied to AI hardware usage.
  • In November 2024, Huawei introduced Flex:AI, a new open-source software platform designed to enhance the utilization of its AI chipsets and provide high-performance training capabilities.

Research Analyst Overview: Ai Gpu Orchestration Platforms Market

Boardroom decisions regarding capital expenditure are now directly tied to AI infrastructure management, moving beyond hardware acquisition to focus on total cost of ownership. With North America representing 36.32% of incremental market growth, the primary challenge is maximizing return on substantial investments in high-performance computing.

This requires sophisticated resource allocation via container orchestration and GPU virtualization to enable dynamic scaling of deep learning frameworks. The adoption of confidential computing for AI is a critical response to data security mandates, allowing for multi-tenancy support without compromising sensitive workloads.

For instance, a global bank using a platform with GPU partitioning can isolate its fraud detection models from experimental trading algorithms running on the same cluster, adhering to strict compliance protocols.

Platforms must support heterogeneous hardware and provide advanced job scheduling and MLOps integration to streamline AI workload migration and facilitate automated model deployment, ultimately driving down operational costs and improving hardware utilization.

Dive into Technavio’s robust research methodology, blending expert interviews, extensive data synthesis, and validated models for unparalleled Ai Gpu Orchestration Platforms Market insights. See full methodology.

Request Free Sample

Market Scope
Page number 315
Base year 2025
Historic period 2020-2024
Forecast period 2026-2030
Growth momentum & CAGR Accelerate at a CAGR of 25.9%
Market growth 2026-2030 USD 6589.8 million
Market structure Fragmented
YoY growth 2025-2026(%) 24.0%
Key countries US, Canada, Mexico, UK, Germany, France, Italy, The Netherlands, Spain, China, Japan, India, South Korea, Australia, Indonesia, Brazil, Argentina, Colombia, Saudi Arabia, Israel, UAE, South Africa and Turkey
Competitive landscape Leading Companies, Market Positioning of Companies, Competitive Strategies, and Industry Risks

Ai Gpu Orchestration Platforms Market: Key Questions Answered in This Report

  • What is the expected growth of the Ai Gpu Orchestration Platforms Market between 2026 and 2030?

    • The Ai Gpu Orchestration Platforms Market is expected to grow by USD 6.59 billion during 2026-2030, registering a CAGR of 25.9%. Year-over-year growth in 2026 is estimated at 24.0%%. This acceleration is shaped by escalating demand for large language model training and inference capabilities, which is intensifying demand across multiple end-use verticals covered in the report.

  • What segmentation does the market report cover?

    • The report is segmented by Deployment (Cloud, On-premises, and Hybrid), End-user (Tech companies, BFSI, Healthcare, Manufacturing, and Research and academia), Application (Workload orchestration, GPU scheduling and allocation, Cluster management, Multi-tenancy and governance, and Cost optimization) and Geography (North America, Europe, APAC, South America, Middle East and Africa). Among these, the Cloud segment is estimated to witness significant growth during the forecast period, driven by rising adoption across key application areas. Each segment includes detailed qualitative and quantitative analysis, along with historical data from 2020-2024 and forecasts through 2030 with year-over-year growth rates.

  • Which regions are analyzed in the report?

    • The report covers North America, Europe, APAC, South America and Middle East and Africa. North America is estimated to contribute 36.3% to market growth during the forecast period. Country-level analysis includes US, Canada, Mexico, UK, Germany, France, Italy, The Netherlands, Spain, China, Japan, India, South Korea, Australia, Indonesia, Brazil, Argentina, Colombia, Saudi Arabia, Israel, UAE, South Africa and Turkey, with dedicated market size tables and year-over-year growth for each.

  • What are the key growth drivers and market challenges?

    • The primary driver is escalating demand for large language model training and inference capabilities, which is accelerating investment and industry demand. The main challenge is interoperability issues across diverse hardware ecosystems and cloud providers, creating operational barriers for key market participants. The report quantifies the impact of each driver and challenge across 2026 and 2030 with comparative analysis.

  • Who are the major players in the Ai Gpu Orchestration Platforms Market?

    • Key vendors include Amazon.com Inc., Anyscale Inc, Broadcom Inc., ClearML Inc, Databricks Inc., DigitalOcean Holdings Inc., Domino Data Lab Inc., Google LLC, Hewlett Packard Enterprise Co., IBM Corp., Intel Corp., Lambda Labs, Inc., Lightning AI, Microsoft Corp., NVIDIA Corp., Together AI and VULTR. The report provides qualitative and quantitative analysis categorizing companies as dominant, leading, strong, tentative, and weak based on their market positioning. Company profiles include business segment analysis, SWOT assessment, key offerings, and recent strategic developments.

Ai Gpu Orchestration Platforms Market Research Insights

The dynamics of the AI GPU orchestration platforms market are influenced by the diverse needs of end-users and complex infrastructure strategies. Tech companies represent the largest end-user segment, with a 2024 market value approximately 30% higher than the BFSI sector, reflecting their aggressive investment in generative AI workloads.

This demand drives the need for computational resource optimization and scalable AI solutions. A key operational reality is managing workloads across disparate environments, which necessitates a cohesive multi-cloud AI strategy. For instance, a healthcare organization must balance the scalability of a public cloud with data residency rules, requiring a unified AI platform that can enforce strict governance.

The International Energy Agency's recent guidelines on power consumption reporting further pressure operators to adopt platforms offering energy-aware GPU resource scheduling, making efficient GPU utilization a critical performance metric.

We can help! Our analysts can customize this ai gpu orchestration platforms market research report to meet your requirements.

Get in touch

1. Executive Summary

1.1 Market overview

Executive Summary - Chart on Market Overview
Executive Summary - Data Table on Market Overview
Executive Summary - Chart on Global Market Characteristics
Executive Summary - Chart on Market by Geography
Executive Summary - Chart on Market Segmentation by Deployment
Executive Summary - Chart on Market Segmentation by End-user
Executive Summary - Chart on Market Segmentation by Application
Executive Summary - Chart on Incremental Growth
Executive Summary - Data Table on Incremental Growth
Executive Summary - Chart on Company Market Positioning

2. Technavio Analysis

2.1 Analysis of price sensitivity, lifecycle, customer purchase basket, adoption rates, and purchase criteria

2.2 Criticality of inputs and Factors of differentiation

Chart on Overview on criticality of inputs and factors of differentiation

2.3 Factors of disruption

Chart on Overview on factors of disruption

2.4 Impact of drivers and challenges

Chart on Impact of drivers and challenges in 2025 and 2030

3. Market Landscape

3.1 Market ecosystem

Chart on Parent Market
Data Table on - Parent Market

3.2 Market characteristics

Chart on Market characteristics analysis

3.3 Value chain analysis

Chart on Value chain analysis

4. Market Sizing

4.1 Market definition

Data Table on Offerings of companies included in the market definition

4.2 Market segment analysis

Market segments

4.3 Market size 2025

4.4 Market outlook: Forecast for 2025-2030

Chart on Global - Market size and forecast 2025-2030 ($ million)
Data Table on Global - Market size and forecast 2025-2030 ($ million)
Chart on Global Market: Year-over-year growth 2025-2030 (%)
Data Table on Global Market: Year-over-year growth 2025-2030 (%)

5. Historic Market Size

5.1 Global AI GPU Orchestration Platforms Market 2020 - 2024

Historic Market Size - Data Table on Global AI GPU Orchestration Platforms Market 2020 - 2024 ($ million)

5.2 Deployment segment analysis 2020 - 2024

Historic Market Size - Deployment Segment 2020 - 2024 ($ million)

5.3 End-user segment analysis 2020 - 2024

Historic Market Size - End-user Segment 2020 - 2024 ($ million)

5.4 Application segment analysis 2020 - 2024

Historic Market Size - Application Segment 2020 - 2024 ($ million)

5.5 Geography segment analysis 2020 - 2024

Historic Market Size - Geography Segment 2020 - 2024 ($ million)

5.6 Country segment analysis 2020 - 2024

Historic Market Size - Country Segment 2020 - 2024 ($ million)

6. Qualitative Analysis

6.1 Impact of Geopolitical Conflicts on Global AI GPU Orchestration Platforms Market

7. Five Forces Analysis

7.1 Five forces summary

Five forces analysis - Comparison between 2025 and 2030

7.2 Bargaining power of buyers

Bargaining power of buyers - Impact of key factors 2025 and 2030

7.3 Bargaining power of suppliers

Bargaining power of suppliers - Impact of key factors in 2025 and 2030

7.4 Threat of new entrants

Threat of new entrants - Impact of key factors in 2025 and 2030

7.5 Threat of substitutes

Threat of substitutes - Impact of key factors in 2025 and 2030

7.6 Threat of rivalry

Threat of rivalry - Impact of key factors in 2025 and 2030

7.7 Market condition

Chart on Market condition - Five forces 2025 and 2030

8. Market Segmentation by Deployment

8.1 Market segments

Chart on Deployment - Market share 2025-2030 (%)
Data Table on Deployment - Market share 2025-2030 (%)

8.2 Comparison by Deployment

Chart on Comparison by Deployment
Data Table on Comparison by Deployment

8.3 Cloud - Market size and forecast 2025-2030

Chart on Cloud - Market size and forecast 2025-2030 ($ million)
Data Table on Cloud - Market size and forecast 2025-2030 ($ million)
Chart on Cloud - Year-over-year growth 2025-2030 (%)
Data Table on Cloud - Year-over-year growth 2025-2030 (%)

8.4 On-premises - Market size and forecast 2025-2030

Chart on On-premises - Market size and forecast 2025-2030 ($ million)
Data Table on On-premises - Market size and forecast 2025-2030 ($ million)
Chart on On-premises - Year-over-year growth 2025-2030 (%)
Data Table on On-premises - Year-over-year growth 2025-2030 (%)

8.5 Hybrid - Market size and forecast 2025-2030

Chart on Hybrid - Market size and forecast 2025-2030 ($ million)
Data Table on Hybrid - Market size and forecast 2025-2030 ($ million)
Chart on Hybrid - Year-over-year growth 2025-2030 (%)
Data Table on Hybrid - Year-over-year growth 2025-2030 (%)

8.6 Market opportunity by Deployment

Market opportunity by Deployment ($ million)
Data Table on Market opportunity by Deployment ($ million)

9. Market Segmentation by End-user

9.1 Market segments

Chart on End-user - Market share 2025-2030 (%)
Data Table on End-user - Market share 2025-2030 (%)

9.2 Comparison by End-user

Chart on Comparison by End-user
Data Table on Comparison by End-user

9.3 Tech companies - Market size and forecast 2025-2030

Chart on Tech companies - Market size and forecast 2025-2030 ($ million)
Data Table on Tech companies - Market size and forecast 2025-2030 ($ million)
Chart on Tech companies - Year-over-year growth 2025-2030 (%)
Data Table on Tech companies - Year-over-year growth 2025-2030 (%)

9.4 BFSI - Market size and forecast 2025-2030

Chart on BFSI - Market size and forecast 2025-2030 ($ million)
Data Table on BFSI - Market size and forecast 2025-2030 ($ million)
Chart on BFSI - Year-over-year growth 2025-2030 (%)
Data Table on BFSI - Year-over-year growth 2025-2030 (%)

9.5 Healthcare - Market size and forecast 2025-2030

Chart on Healthcare - Market size and forecast 2025-2030 ($ million)
Data Table on Healthcare - Market size and forecast 2025-2030 ($ million)
Chart on Healthcare - Year-over-year growth 2025-2030 (%)
Data Table on Healthcare - Year-over-year growth 2025-2030 (%)

9.6 Manufacturing - Market size and forecast 2025-2030

Chart on Manufacturing - Market size and forecast 2025-2030 ($ million)
Data Table on Manufacturing - Market size and forecast 2025-2030 ($ million)
Chart on Manufacturing - Year-over-year growth 2025-2030 (%)
Data Table on Manufacturing - Year-over-year growth 2025-2030 (%)

9.7 Research and academia - Market size and forecast 2025-2030

Chart on Research and academia - Market size and forecast 2025-2030 ($ million)
Data Table on Research and academia - Market size and forecast 2025-2030 ($ million)
Chart on Research and academia - Year-over-year growth 2025-2030 (%)
Data Table on Research and academia - Year-over-year growth 2025-2030 (%)

9.8 Market opportunity by End-user

Market opportunity by End-user ($ million)
Data Table on Market opportunity by End-user ($ million)

10. Market Segmentation by Application

10.1 Market segments

Chart on Application - Market share 2025-2030 (%)
Data Table on Application - Market share 2025-2030 (%)

10.2 Comparison by Application

Chart on Comparison by Application
Data Table on Comparison by Application

10.3 Workload orchestration - Market size and forecast 2025-2030

Chart on Workload orchestration - Market size and forecast 2025-2030 ($ million)
Data Table on Workload orchestration - Market size and forecast 2025-2030 ($ million)
Chart on Workload orchestration - Year-over-year growth 2025-2030 (%)
Data Table on Workload orchestration - Year-over-year growth 2025-2030 (%)

10.4 GPU scheduling and allocation - Market size and forecast 2025-2030

Chart on GPU scheduling and allocation - Market size and forecast 2025-2030 ($ million)
Data Table on GPU scheduling and allocation - Market size and forecast 2025-2030 ($ million)
Chart on GPU scheduling and allocation - Year-over-year growth 2025-2030 (%)
Data Table on GPU scheduling and allocation - Year-over-year growth 2025-2030 (%)

10.5 Cluster management - Market size and forecast 2025-2030

Chart on Cluster management - Market size and forecast 2025-2030 ($ million)
Data Table on Cluster management - Market size and forecast 2025-2030 ($ million)
Chart on Cluster management - Year-over-year growth 2025-2030 (%)
Data Table on Cluster management - Year-over-year growth 2025-2030 (%)

10.6 Multi-tenancy and governance - Market size and forecast 2025-2030

Chart on Multi-tenancy and governance - Market size and forecast 2025-2030 ($ million)
Data Table on Multi-tenancy and governance - Market size and forecast 2025-2030 ($ million)
Chart on Multi-tenancy and governance - Year-over-year growth 2025-2030 (%)
Data Table on Multi-tenancy and governance - Year-over-year growth 2025-2030 (%)

10.7 Cost optimization - Market size and forecast 2025-2030

Chart on Cost optimization - Market size and forecast 2025-2030 ($ million)
Data Table on Cost optimization - Market size and forecast 2025-2030 ($ million)
Chart on Cost optimization - Year-over-year growth 2025-2030 (%)
Data Table on Cost optimization - Year-over-year growth 2025-2030 (%)

10.8 Market opportunity by Application

Market opportunity by Application ($ million)
Data Table on Market opportunity by Application ($ million)

11. Customer Landscape

11.1 Customer landscape overview

Analysis of price sensitivity, lifecycle, customer purchase basket, adoption rates, and purchase criteria

12. Geographic Landscape

12.1 Geographic segmentation

Chart on Market share by geography 2025-2030 (%)
Data Table on Market share by geography 2025-2030 (%)

12.2 Geographic comparison

Chart on Geographic comparison
Data Table on Geographic comparison

12.3 North America - Market size and forecast 2025-2030

Chart on North America - Market size and forecast 2025-2030 ($ million)
Data Table on North America - Market size and forecast 2025-2030 ($ million)
Chart on North America - Year-over-year growth 2025-2030 (%)
Data Table on North America - Year-over-year growth 2025-2030 (%)
Chart on Regional Comparison - North America
Data Table on Regional Comparison - North America

12.3.1 US - Market size and forecast 2025-2030

Chart on US - Market size and forecast 2025-2030 ($ million)
Data Table on US - Market size and forecast 2025-2030 ($ million)
Chart on US - Year-over-year growth 2025-2030 (%)
Data Table on US - Year-over-year growth 2025-2030 (%)

12.3.2 Canada - Market size and forecast 2025-2030

Chart on Canada - Market size and forecast 2025-2030 ($ million)
Data Table on Canada - Market size and forecast 2025-2030 ($ million)
Chart on Canada - Year-over-year growth 2025-2030 (%)
Data Table on Canada - Year-over-year growth 2025-2030 (%)

12.3.3 Mexico - Market size and forecast 2025-2030

Chart on Mexico - Market size and forecast 2025-2030 ($ million)
Data Table on Mexico - Market size and forecast 2025-2030 ($ million)
Chart on Mexico - Year-over-year growth 2025-2030 (%)
Data Table on Mexico - Year-over-year growth 2025-2030 (%)

12.4 Europe - Market size and forecast 2025-2030

Chart on Europe - Market size and forecast 2025-2030 ($ million)
Data Table on Europe - Market size and forecast 2025-2030 ($ million)
Chart on Europe - Year-over-year growth 2025-2030 (%)
Data Table on Europe - Year-over-year growth 2025-2030 (%)
Chart on Regional Comparison - Europe
Data Table on Regional Comparison - Europe

12.4.1 UK - Market size and forecast 2025-2030

Chart on UK - Market size and forecast 2025-2030 ($ million)
Data Table on UK - Market size and forecast 2025-2030 ($ million)
Chart on UK - Year-over-year growth 2025-2030 (%)
Data Table on UK - Year-over-year growth 2025-2030 (%)

12.4.2 Germany - Market size and forecast 2025-2030

Chart on Germany - Market size and forecast 2025-2030 ($ million)
Data Table on Germany - Market size and forecast 2025-2030 ($ million)
Chart on Germany - Year-over-year growth 2025-2030 (%)
Data Table on Germany - Year-over-year growth 2025-2030 (%)

12.4.3 France - Market size and forecast 2025-2030

Chart on France - Market size and forecast 2025-2030 ($ million)
Data Table on France - Market size and forecast 2025-2030 ($ million)
Chart on France - Year-over-year growth 2025-2030 (%)
Data Table on France - Year-over-year growth 2025-2030 (%)

12.4.4 Italy - Market size and forecast 2025-2030

Chart on Italy - Market size and forecast 2025-2030 ($ million)
Data Table on Italy - Market size and forecast 2025-2030 ($ million)
Chart on Italy - Year-over-year growth 2025-2030 (%)
Data Table on Italy - Year-over-year growth 2025-2030 (%)

12.4.5 The Netherlands - Market size and forecast 2025-2030

Chart on The Netherlands - Market size and forecast 2025-2030 ($ million)
Data Table on The Netherlands - Market size and forecast 2025-2030 ($ million)
Chart on The Netherlands - Year-over-year growth 2025-2030 (%)
Data Table on The Netherlands - Year-over-year growth 2025-2030 (%)

12.4.6 Spain - Market size and forecast 2025-2030

Chart on Spain - Market size and forecast 2025-2030 ($ million)
Data Table on Spain - Market size and forecast 2025-2030 ($ million)
Chart on Spain - Year-over-year growth 2025-2030 (%)
Data Table on Spain - Year-over-year growth 2025-2030 (%)

12.5 APAC - Market size and forecast 2025-2030

Chart on APAC - Market size and forecast 2025-2030 ($ million)
Data Table on APAC - Market size and forecast 2025-2030 ($ million)
Chart on APAC - Year-over-year growth 2025-2030 (%)
Data Table on APAC - Year-over-year growth 2025-2030 (%)
Chart on Regional Comparison - APAC
Data Table on Regional Comparison - APAC

12.5.1 China - Market size and forecast 2025-2030

Chart on China - Market size and forecast 2025-2030 ($ million)
Data Table on China - Market size and forecast 2025-2030 ($ million)
Chart on China - Year-over-year growth 2025-2030 (%)
Data Table on China - Year-over-year growth 2025-2030 (%)

12.5.2 Japan - Market size and forecast 2025-2030

Chart on Japan - Market size and forecast 2025-2030 ($ million)
Data Table on Japan - Market size and forecast 2025-2030 ($ million)
Chart on Japan - Year-over-year growth 2025-2030 (%)
Data Table on Japan - Year-over-year growth 2025-2030 (%)

12.5.3 India - Market size and forecast 2025-2030

Chart on India - Market size and forecast 2025-2030 ($ million)
Data Table on India - Market size and forecast 2025-2030 ($ million)
Chart on India - Year-over-year growth 2025-2030 (%)
Data Table on India - Year-over-year growth 2025-2030 (%)

12.5.4 South Korea - Market size and forecast 2025-2030

Chart on South Korea - Market size and forecast 2025-2030 ($ million)
Data Table on South Korea - Market size and forecast 2025-2030 ($ million)
Chart on South Korea - Year-over-year growth 2025-2030 (%)
Data Table on South Korea - Year-over-year growth 2025-2030 (%)

12.5.5 Australia - Market size and forecast 2025-2030

Chart on Australia - Market size and forecast 2025-2030 ($ million)
Data Table on Australia - Market size and forecast 2025-2030 ($ million)
Chart on Australia - Year-over-year growth 2025-2030 (%)
Data Table on Australia - Year-over-year growth 2025-2030 (%)

12.5.6 Indonesia - Market size and forecast 2025-2030

Chart on Indonesia - Market size and forecast 2025-2030 ($ million)
Data Table on Indonesia - Market size and forecast 2025-2030 ($ million)
Chart on Indonesia - Year-over-year growth 2025-2030 (%)
Data Table on Indonesia - Year-over-year growth 2025-2030 (%)

12.6 South America - Market size and forecast 2025-2030

Chart on South America - Market size and forecast 2025-2030 ($ million)
Data Table on South America - Market size and forecast 2025-2030 ($ million)
Chart on South America - Year-over-year growth 2025-2030 (%)
Data Table on South America - Year-over-year growth 2025-2030 (%)
Chart on Regional Comparison - South America
Data Table on Regional Comparison - South America

12.6.1 Brazil - Market size and forecast 2025-2030

Chart on Brazil - Market size and forecast 2025-2030 ($ million)
Data Table on Brazil - Market size and forecast 2025-2030 ($ million)
Chart on Brazil - Year-over-year growth 2025-2030 (%)
Data Table on Brazil - Year-over-year growth 2025-2030 (%)

12.6.2 Argentina - Market size and forecast 2025-2030

Chart on Argentina - Market size and forecast 2025-2030 ($ million)
Data Table on Argentina - Market size and forecast 2025-2030 ($ million)
Chart on Argentina - Year-over-year growth 2025-2030 (%)
Data Table on Argentina - Year-over-year growth 2025-2030 (%)

12.6.3 Colombia - Market size and forecast 2025-2030

Chart on Colombia - Market size and forecast 2025-2030 ($ million)
Data Table on Colombia - Market size and forecast 2025-2030 ($ million)
Chart on Colombia - Year-over-year growth 2025-2030 (%)
Data Table on Colombia - Year-over-year growth 2025-2030 (%)

12.7 Middle East and Africa - Market size and forecast 2025-2030

Chart on Middle East and Africa - Market size and forecast 2025-2030 ($ million)
Data Table on Middle East and Africa - Market size and forecast 2025-2030 ($ million)
Chart on Middle East and Africa - Year-over-year growth 2025-2030 (%)
Data Table on Middle East and Africa - Year-over-year growth 2025-2030 (%)
Chart on Regional Comparison - Middle East and Africa
Data Table on Regional Comparison - Middle East and Africa

12.7.1 Saudi Arabia - Market size and forecast 2025-2030

Chart on Saudi Arabia - Market size and forecast 2025-2030 ($ million)
Data Table on Saudi Arabia - Market size and forecast 2025-2030 ($ million)
Chart on Saudi Arabia - Year-over-year growth 2025-2030 (%)
Data Table on Saudi Arabia - Year-over-year growth 2025-2030 (%)

12.7.2 Israel - Market size and forecast 2025-2030

Chart on Israel - Market size and forecast 2025-2030 ($ million)
Data Table on Israel - Market size and forecast 2025-2030 ($ million)
Chart on Israel - Year-over-year growth 2025-2030 (%)
Data Table on Israel - Year-over-year growth 2025-2030 (%)

12.7.3 UAE - Market size and forecast 2025-2030

Chart on UAE - Market size and forecast 2025-2030 ($ million)
Data Table on UAE - Market size and forecast 2025-2030 ($ million)
Chart on UAE - Year-over-year growth 2025-2030 (%)
Data Table on UAE - Year-over-year growth 2025-2030 (%)

12.7.4 South Africa - Market size and forecast 2025-2030

Chart on South Africa - Market size and forecast 2025-2030 ($ million)
Data Table on South Africa - Market size and forecast 2025-2030 ($ million)
Chart on South Africa - Year-over-year growth 2025-2030 (%)
Data Table on South Africa - Year-over-year growth 2025-2030 (%)

12.7.5 Turkey - Market size and forecast 2025-2030

Chart on Turkey - Market size and forecast 2025-2030 ($ million)
Data Table on Turkey - Market size and forecast 2025-2030 ($ million)
Chart on Turkey - Year-over-year growth 2025-2030 (%)
Data Table on Turkey - Year-over-year growth 2025-2030 (%)

12.8 Market opportunity by geography

Market opportunity by geography ($ million)
Data Tables on Market opportunity by geography ($ million)

13. Drivers, Challenges, and Opportunity

13.1 Market drivers

Escalating demand for large language model training and inference capabilities
Optimization of cloud compute resources and cost reduction strategies
Need for simplified deployment and management in multi-cloud environments

13.2 Market challenges

Interoperability issues across diverse hardware ecosystems and cloud providers
Severe shortages of skilled personnel and steep learning curves
Security vulnerabilities and data privacy compliance complexities

13.3 Impact of drivers and challenges

Impact of drivers and challenges in 2025 and 2030

13.4 Market opportunities

Integration of edge computing with GPU orchestration for real-time AI processing
Shift toward sustainable and energy-efficient GPU allocation frameworks
Implementation of advanced security and confidential computing protocols

14. Competitive Landscape

14.1 Overview

14.2

Overview on criticality of inputs and factors of differentiation

14.3 Landscape disruption

Overview on factors of disruption

14.4 Industry risks

Impact of key risks on business

15. Competitive Analysis

15.1 Companies profiled

Companies covered

15.2 Company ranking index

15.3 Market positioning of companies

Matrix on companies position and classification

15.4 Amazon.com Inc.

Amazon.com Inc. - Overview
Amazon.com Inc. - Business segments
Amazon.com Inc. - Key news
Amazon.com Inc. - Key offerings
Amazon.com Inc. - Segment focus
SWOT

15.5 Broadcom Inc.

Broadcom Inc. - Overview
Broadcom Inc. - Business segments
Broadcom Inc. - Key offerings
Broadcom Inc. - Segment focus
SWOT

15.6 ClearML Inc

ClearML Inc - Overview
ClearML Inc - Product / Service
ClearML Inc - Key offerings
SWOT

15.7 Databricks Inc.

Databricks Inc. - Overview
Databricks Inc. - Product / Service
Databricks Inc. - Key offerings
SWOT

15.8 DigitalOcean Holdings Inc.

DigitalOcean Holdings Inc. - Overview
DigitalOcean Holdings Inc. - Business segments
DigitalOcean Holdings Inc. - Key offerings
DigitalOcean Holdings Inc. - Segment focus
SWOT

15.9 Domino Data Lab Inc.

Domino Data Lab Inc. - Overview
Domino Data Lab Inc. - Product / Service
Domino Data Lab Inc. - Key offerings
SWOT

15.10 Google LLC

Google LLC - Overview
Google LLC - Product / Service
Google LLC - Key offerings
SWOT

15.11 Hewlett Packard Enterprise Co.

Hewlett Packard Enterprise Co. - Overview
Hewlett Packard Enterprise Co. - Business segments
Hewlett Packard Enterprise Co. - Key news
Hewlett Packard Enterprise Co. - Key offerings
Hewlett Packard Enterprise Co. - Segment focus
SWOT

15.12 IBM Corp.

IBM Corp. - Overview
IBM Corp. - Business segments
IBM Corp. - Key news
IBM Corp. - Key offerings
IBM Corp. - Segment focus
SWOT

15.13 Intel Corp.

Intel Corp. - Overview
Intel Corp. - Business segments
Intel Corp. - Key news
Intel Corp. - Key offerings
Intel Corp. - Segment focus
SWOT

15.14 Lambda Labs, Inc.

Lambda Labs, Inc. - Overview
Lambda Labs, Inc. - Product / Service
Lambda Labs, Inc. - Key offerings
SWOT

15.15 Lightning AI

Lightning AI - Overview
Lightning AI - Product / Service
Lightning AI - Key offerings
SWOT

15.16 Microsoft Corp.

Microsoft Corp. - Overview
Microsoft Corp. - Business segments
Microsoft Corp. - Key news
Microsoft Corp. - Key offerings
Microsoft Corp. - Segment focus
SWOT

15.17 NVIDIA Corp.

NVIDIA Corp. - Overview
NVIDIA Corp. - Business segments
NVIDIA Corp. - Key news
NVIDIA Corp. - Key offerings
NVIDIA Corp. - Segment focus
SWOT

15.18 Together AI

Together AI - Overview
Together AI - Product / Service
Together AI - Key offerings
SWOT

16. Appendix

16.1 Scope of the report

Market definition
Objectives
Notes and caveats

16.2 Inclusions and exclusions checklist

Inclusions checklist
Exclusions checklist

16.3 Currency conversion rates for US$

16.4 Research methodology

16.5 Data procurement

Information sources

16.6 Data validation

16.7 Validation techniques employed for market sizing

16.8 Data synthesis

16.9 360 degree market analysis

16.10 List of abbreviations

Research Methodology

Technavio presents a detailed picture of the market by way of study, synthesis, and summation of data from multiple sources. The analysts have presented the various facets of the market with a particular focus on identifying the key industry influencers. The data thus presented is comprehensive, reliable, and the result of extensive research, both primary and secondary.

INFORMATION SOURCES

Primary sources

  • Manufacturers and suppliers
  • Channel partners
  • Industry experts
  • Strategic decision makers

Secondary sources

  • Industry journals and periodicals
  • Government data
  • Financial reports of key industry players
  • Historical data
  • Press releases

DATA ANALYSIS

Data Synthesis

  • Collation of data
  • Estimation of key figures
  • Analysis of derived insights

Data Validation

  • Triangulation with data models
  • Reference against proprietary databases
  • Corroboration with industry experts

REPORT WRITING

Qualitative

  • Market drivers
  • Market challenges
  • Market trends
  • Five forces analysis

Quantitative

  • Market size and forecast
  • Market segmentation
  • Geographical insights
  • Competitive landscape

Interested in this report?

Get your sample now to see our research methodology and insights!

Download Now

Frequently Asked Questions

Ai Gpu Orchestration Platforms market growth will increase by USD 6589.8 million during 2026-2030.

The Ai Gpu Orchestration Platforms market is expected to grow at a CAGR of 25.9% during 2026-2030.

Ai Gpu Orchestration Platforms market is segmented by Deployment (Cloud, On-premises, Hybrid) End-user (Tech companies, BFSI, Healthcare, Manufacturing, Research and academia) Application (Workload orchestration, GPU scheduling and allocation, Cluster management, Multi-tenancy and governance, Cost optimization)

Amazon.com Inc., Anyscale Inc, Broadcom Inc., ClearML Inc, Databricks Inc., DigitalOcean Holdings Inc., Domino Data Lab Inc., Google LLC, Hewlett Packard Enterprise Co., IBM Corp., Intel Corp., Lambda Labs, Inc., Lightning AI, Microsoft Corp., NVIDIA Corp., Together AI, VULTR are a few of the key vendors in the Ai Gpu Orchestration Platforms market.

North America will register the highest growth rate of 36.3% among the other regions. Therefore, the Ai Gpu Orchestration Platforms market in North America is expected to garner significant business opportunities for the vendors during the forecast period.

US, Canada, Mexico, UK, Germany, France, Italy, The Netherlands, Spain, China, Japan, India, South Korea, Australia, Indonesia, Brazil, Argentina, Colombia, Saudi Arabia, Israel, UAE, South Africa, Turkey

  • Escalating demand for large language model training and inference capabilities is the driving factor this market.

The Ai Gpu Orchestration Platforms market vendors should focus on grabbing business opportunities from the Deployment segment as it accounted for the largest market share in the base year.
RIA - Research AI Assistant
Ask RIA