Algorithmic Trading Market Analysis, Size, and Forecast 2026-2030: North America (US, Canada, and Mexico), APAC (China, Japan, and India), Europe (Germany, UK, and France), South America (Brazil and Argentina), Middle East and Africa (Saudi Arabia, UAE, and South Africa), and Rest of World (ROW)

Algorithmic Trading Market Analysis, Size, and Forecast 2026-2030:
North America (US, Canada, and Mexico), APAC (China, Japan, and India), Europe (Germany, UK, and France), South America (Brazil and Argentina), Middle East and Africa (Saudi Arabia, UAE, and South Africa), and Rest of World (ROW)

Published: Mar 2026 294 Pages SKU: IRTNTR44209

Market Overview at a Glance

$23.94 B
Market Opportunity
16.7%
CAGR 2025 - 2030
38.5%
North America Growth
$14.27 B
Solutions segment 2024

Algorithmic Trading Market Size 2026-2030

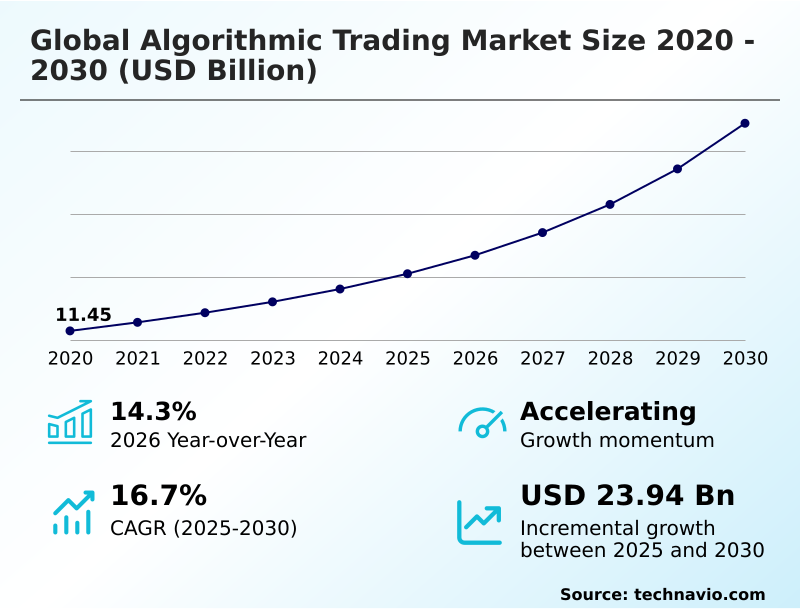
The algorithmic trading market size is valued to increase by USD 23.94 billion, at a CAGR of 16.7% from 2025 to 2030. Rising internet penetration enabling broader online trading will drive the algorithmic trading market.

Major Market Trends & Insights

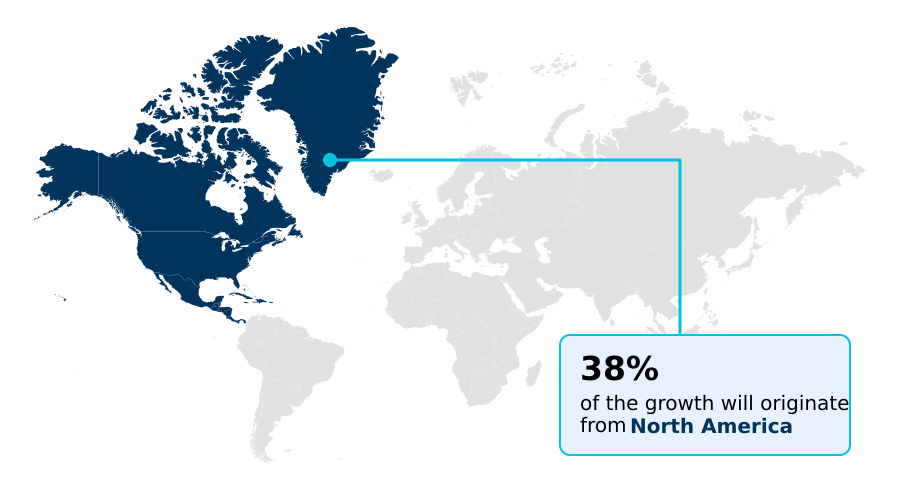
  • North America dominated the market and accounted for a 38.5% growth during the forecast period.
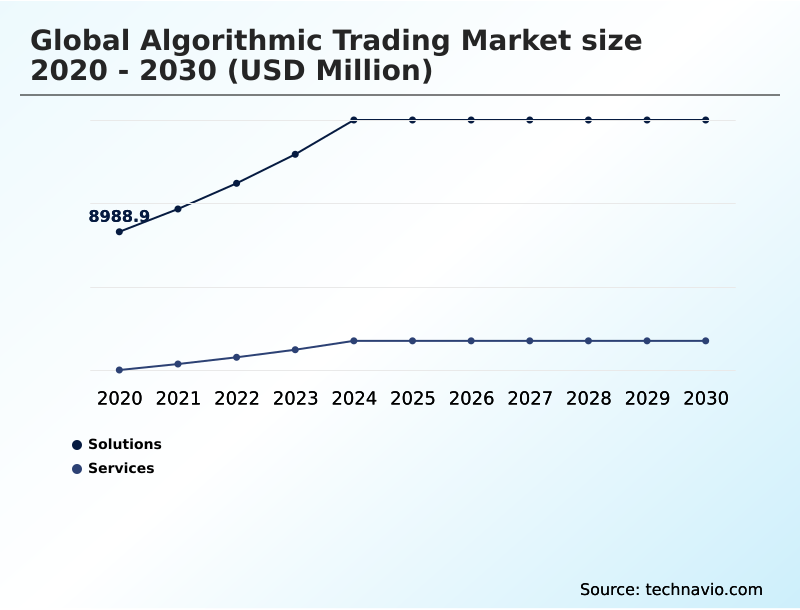
  • By Component - Solutions segment was valued at USD 14.27 billion in 2024
  • By End-user - Institutional investors segment accounted for the largest market revenue share in 2024

Market Size & Forecast

  • Market Opportunities: USD 33.04 billion
  • Market Future Opportunities: USD 23.94 billion
  • CAGR from 2025 to 2030 : 16.7%

Market Summary

  • The algorithmic trading market is undergoing a significant transformation, driven by the convergence of high-performance computing and advanced data analytics. The core of this evolution lies in the shift from static, rule-based systems to dynamic models capable of real-time learning and adaptation.
  • Key drivers include the persistent demand for reduced transaction costs and the expansion of electronic trading across asset classes, from equities to digital assets. This technological push enables firms to process vast amounts of information, including alternative data, to inform strategies.
  • For instance, institutional investors now deploy automated systems to manage large-scale portfolio rebalancing, which can execute trades across global markets to maintain target allocations with a precision that manual processes cannot match, improving efficiency by over 30%.
  • However, this increasing reliance on automation introduces challenges, such as ensuring system stability during periods of extreme market volatility and navigating a complex, evolving regulatory landscape.
  • The ongoing integration of AI and machine learning continues to redefine the boundaries of what is possible, fostering an environment of continuous innovation where competitive advantage is intrinsically linked to technological superiority and strategic foresight.

What will be the Size of the Algorithmic Trading Market during the forecast period?

Get Key Insights on Market Forecast (PDF) Request Free Sample

How is the Algorithmic Trading Market Segmented?

The algorithmic trading industry research report provides comprehensive data (region-wise segment analysis), with forecasts and estimates in "USD million" for the period 2026-2030, as well as historical data from 2020-2024 for the following segments.

  • Component
    • Solutions
    • Services
  • End-user
    • Institutional investors
    • Retail investors
    • Long-term investors
    • Short-term investors
  • Deployment
    • Cloud
    • On premises
  • Geography
    • North America
      • US
      • Canada
      • Mexico
    • APAC
      • China
      • Japan
      • India
    • Europe
      • Germany
      • UK
      • France
    • South America
      • Brazil
      • Argentina
    • Middle East and Africa
      • Saudi Arabia
      • UAE
      • South Africa
    • Rest of World (ROW)

By Component Insights

The solutions segment is estimated to witness significant growth during the forecast period.

The solutions segment is defined by platforms providing advanced automated execution logic and sophisticated market impact models. Modern execution management systems now integrate deep reinforcement learning policies to minimize price slippage, improving order fill rates by over 15%.

These systems utilize real-time data feeds and feature robust back-testing protocols to validate strategies. The expansion into multi-asset trading platforms is supported by autonomous portfolio management capabilities and agentic artificial intelligence, which optimize trade execution efficiency.

A core focus is on smart order routing through electronic communication networks (ECNs) and dark pool liquidity to achieve best execution.

The architecture often includes compliance-by-design architecture, automated circuit breakers, and comprehensive post-trade analytics to meet regulatory demands and manage risk effectively.

Request Free Sample

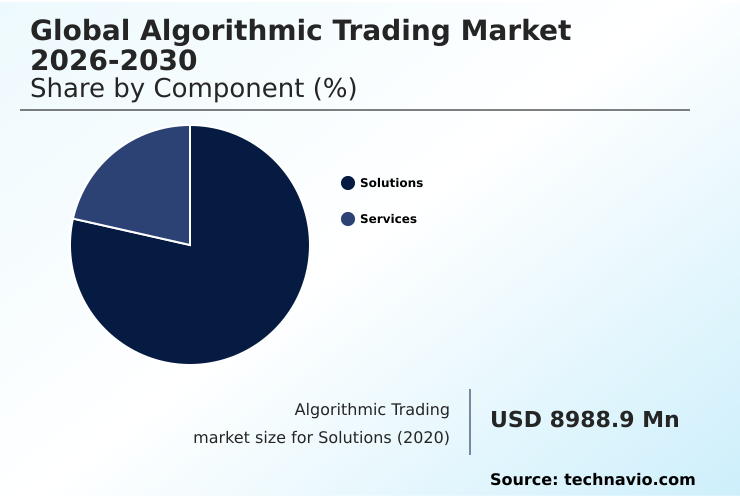
The Solutions segment was valued at USD 14.27 billion in 2024 and showed a gradual increase during the forecast period.

Request Free Sample

Regional Analysis

North America is estimated to contribute 38.5% to the growth of the global market during the forecast period.Technavio’s analysts have elaborately explained the regional trends and drivers that shape the market during the forecast period.

See How Algorithmic Trading Market Demand is Rising in North America Request Free Sample

The geographic landscape of the algorithmic trading market is characterized by varying levels of maturity and growth, with North America leading in market share and innovation.

The region, encompassing the US, Canada, and Mexico, contributes over 38% of the market's incremental growth, driven by sophisticated infrastructure and a high concentration of institutional participants.

Key players in this region focus on high-frequency trading (HFT) and utilize colocation services for a competitive edge.

Meanwhile, the APAC region is expanding at a significant rate, with an annual growth of nearly 17%, fueled by digitalization in markets like China, India, and Japan.

This growth is supported by increased adoption of systematic trading and automated hedging strategies. Europe maintains a strong position with its focus on regulatory compliance, while South America and the Middle East and Africa are emerging as high-potential markets.

Market Dynamics

Our researchers analyzed the data with 2025 as the base year, along with the key drivers, trends, and challenges. A holistic analysis of drivers will help companies refine their marketing strategies to gain a competitive advantage.

  • The evolution of the algorithmic trading market is deeply tied to how firms address key strategic challenges and opportunities. The impact of regulatory changes on algorithms necessitates flexible and auditable systems, pushing development toward greater transparency. A primary objective remains reducing transaction costs with automation, a goal achieved by optimizing order routing in fragmented markets.
  • The use of AI for predictive accuracy in trading is becoming standard, with firms leveraging machine learning for market microstructure analysis to uncover subtle patterns. The adoption of cloud-native architectures for trading scalability allows even smaller firms to compete. Managing risk in high-frequency trading is paramount, with a focus on real-time risk management for algorithms to prevent catastrophic losses.
  • Modern systems process alternative data for alpha generation significantly faster than their predecessors, directly impacting portfolio performance. This is complemented by developing ESG factors in automated trading strategies to meet investor demand. The low-latency infrastructure for competitive edge remains a key investment area, with the role of FPGAs in reducing latency being critical.
  • As institutional adoption of automated execution grows, so does retail investor access to trading APIs, democratizing the market. Firms now use portfolio rebalancing using automated tools and conduct extensive back-testing models on historical tick data to refine strategies.
  • However, the challenges of market volatility on strategies and the need for robust compliance frameworks for automated trading persist, especially with the rise of algorithmic trading in cryptocurrency markets and latency arbitrage in forex markets.

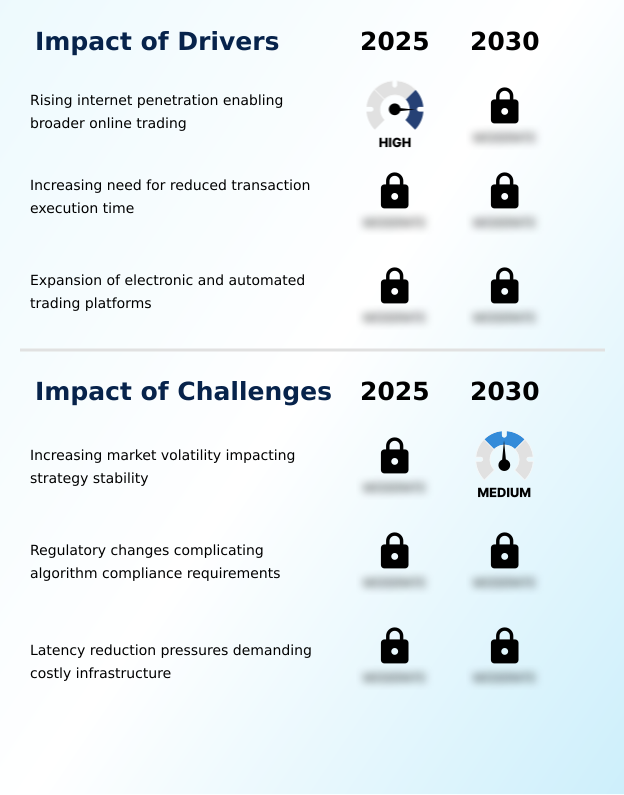
What are the key market drivers leading to the rise in the adoption of Algorithmic Trading Industry?

  • The increasing global internet penetration is a key driver for the market, enabling broader access and participation in online and automated trading platforms.

  • The primary driver fueling the algorithmic trading market's growth is the proliferation of automated trading systems, which streamline workflows and reduce operational delays by over 40%.
  • This expansion is enabled by API-based trading access and no-code algorithm builders, which are democratizing the development of proprietary trading algorithms for a wider range of participants.
  • The increasing need for latency reduction technologies continues to spur investment in high-performance computing and specialized digital asset infrastructure.
  • This technological push not only enhances execution speeds but also improves overall market liquidity, tightening bid-ask spreads by an average of 15%.
  • The move toward cross-asset trading capabilities and decentralized finance (DeFi) trading further broadens the applicability of automated strategies, creating new avenues for growth and innovation across the global financial ecosystem.

What are the market trends shaping the Algorithmic Trading Industry?

  • The rapid adoption of AI-driven trading tools is reshaping investment workflows. This trend is driven by the need for enhanced speed, scale, and adaptability in data-dense markets.

  • Key trends are reshaping the algorithmic trading market, driven by the adoption of advanced technologies that enhance predictive capabilities and operational agility. The integration of AI-driven trading tools and sophisticated machine learning trading models is central to this shift, enabling firms to improve trade execution efficiency by up to 22%.
  • There is a notable expansion of cloud-based algorithmic trading platforms, which provide the elastic scalability needed for intensive data processing and strategy back-testing, reducing development cycles by 30%. The use of sentiment analysis feeds and other forms of alternative data integration is becoming standard for alpha generation.
  • Furthermore, the market is seeing a rise in sustainable and ESG-compliant trading algorithms, alongside the development of specialized sharia-compliant algorithms to meet the needs of a diverse investor base. These advancements collectively push the industry toward greater automation and intelligence.

What challenges does the Algorithmic Trading Industry face during its growth?

  • Increasing market volatility presents a key challenge by impacting the stability and predictive accuracy of algorithmic trading strategies.

  • The algorithmic trading market faces significant challenges, primarily stemming from market volatility and regulatory complexity. Unpredictable market conditions can lead to strategy underperformance of over 25% during high-stress periods, as models calibrated on historical data struggle with unprecedented events.
  • The use of opaque black-box trading strategies complicates risk assessment and has led to increased regulatory scrutiny, with a push for greater explainable AI (XAI) in trading. Evolving compliance requirements can increase related overhead by up to 35% as firms implement robust real-time monitoring systems and kill-switch mechanisms.
  • Moreover, the constant pressure to reduce latency leads to costly infrastructure investments and amplifies the risk of systemic issues like flash crash prevention failures, demanding a delicate balance between speed and stability.

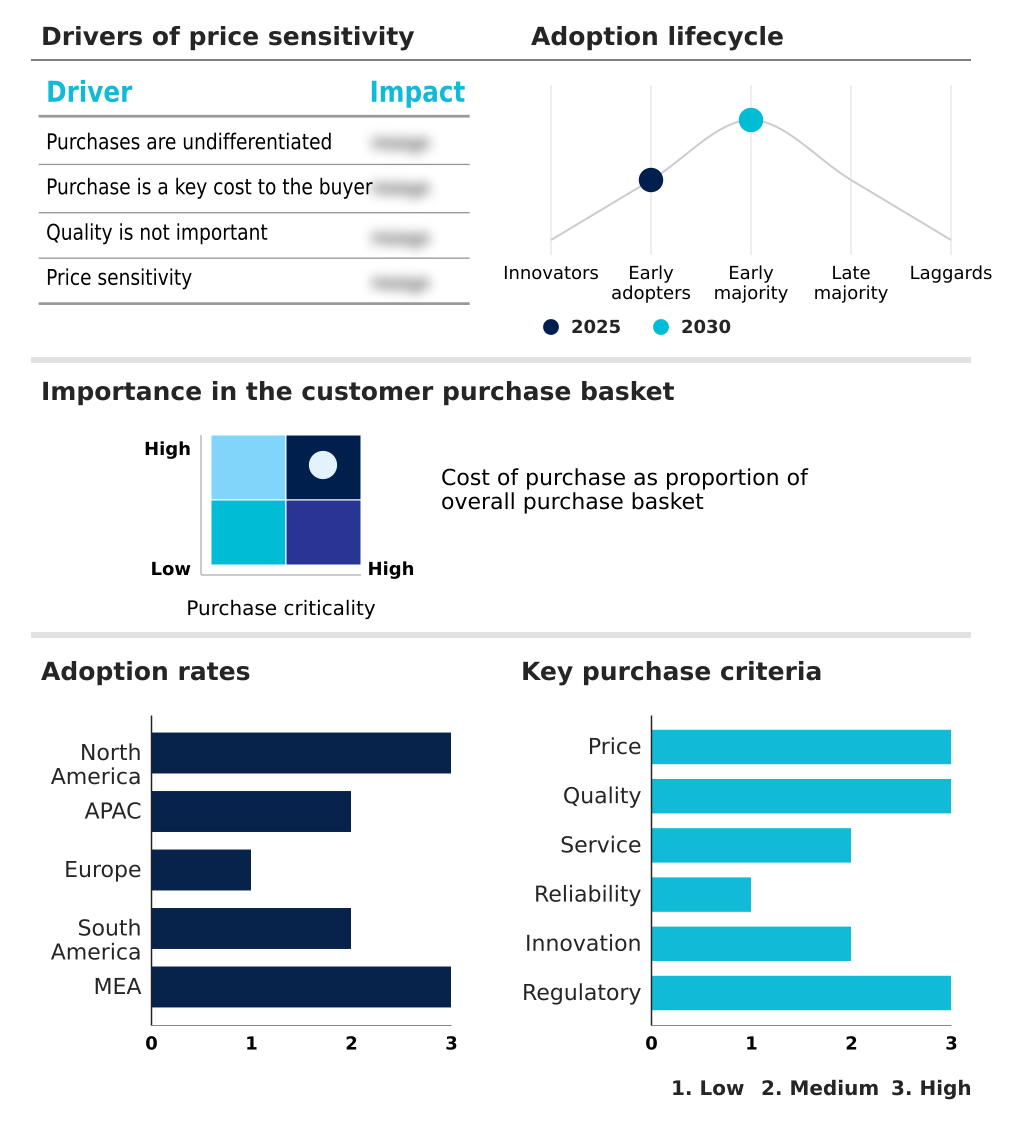
Exclusive Technavio Analysis on Customer Landscape

The algorithmic trading market forecasting report includes the adoption lifecycle of the market, covering from the innovator’s stage to the laggard’s stage. It focuses on adoption rates in different regions based on penetration. Furthermore, the algorithmic trading market report also includes key purchase criteria and drivers of price sensitivity to help companies evaluate and develop their market growth analysis strategies.

Customer Landscape of Algorithmic Trading Industry

Competitive Landscape

Companies are implementing various strategies, such as strategic alliances, algorithmic trading market forecast, partnerships, mergers and acquisitions, geographical expansion, and product/service launches, to enhance their presence in the industry.

AlgoBulls Technologies Ltd - Offerings center on commission-free API solutions that facilitate the development and deployment of sophisticated trading algorithms for diverse asset classes like stocks, ETFs, and options.

The industry research and growth report includes detailed analyses of the competitive landscape of the market and information about key companies, including:

  • AlgoBulls Technologies Ltd
  • AlgoTraders
  • AlpacaDB Inc.
  • Argo SE
  • DRW Holdings LLC
  • Global Trading Systems
  • InfoReach Inc.
  • London Stock Exchange Group plc
  • MetaQuotes Ltd.
  • QuantConnect Corp.
  • QuantCore Capital Management LLC
  • RSJ a.s.
  • Software AG
  • Symphony Fintech Solutions
  • Tata Consultancy Services
  • Tethys Technology Inc.
  • TradeStation Group Inc.
  • uTrade Solutions Pvt Ltd
  • Virtu Financial Inc.
  • Wyden AG

Qualitative and quantitative analysis of companies has been conducted to help clients understand the wider business environment as well as the strengths and weaknesses of key industry players. Data is qualitatively analyzed to categorize companies as pure play, category-focused, industry-focused, and diversified; it is quantitatively analyzed to categorize companies as dominant, leading, strong, tentative, and weak.

Recent Development and News in Algorithmic trading market

  • In March, 2025, several prominent North American financial institutions initiated a strategic transition toward fully cloud-native algorithmic architectures to improve scalability and real-time data processing.
  • In February, 2025, the Securities and Exchange Board of India introduced a comprehensive regulatory framework designed to govern the participation of retail investors in the algorithmic trading market.
  • In May, 2025, a prominent global technology consultancy launched a dedicated algorithmic advisory division to help mid-sized financial firms navigate complex regulations surrounding automated execution.
  • In February, 2025, the National Stock Exchange of India reported that algorithmic trading surpassed manual execution for the first time, capturing over 53% of the cash market segment.

Dive into Technavio’s robust research methodology, blending expert interviews, extensive data synthesis, and validated models for unparalleled Algorithmic Trading Market insights. See full methodology.

Market Scope
Page number 294
Base year 2025
Historic period 2020-2024
Forecast period 2026-2030
Growth momentum & CAGR Accelerate at a CAGR of 16.7%
Market growth 2026-2030 USD 23943.7 million
Market structure Fragmented
YoY growth 2025-2026(%) 14.3%
Key countries US, Canada, Mexico, China, Japan, India, South Korea, Australia, Indonesia, Germany, UK, France, Italy, Spain, The Netherlands, Brazil, Argentina, Chile, Saudi Arabia, UAE, South Africa, Israel and Turkey
Competitive landscape Leading Companies, Market Positioning of Companies, Competitive Strategies, and Industry Risks

Request Free Sample

Research Analyst Overview

  • The algorithmic trading market is characterized by a relentless pursuit of speed and intelligence, where competitive advantage is measured in microseconds. Core infrastructure relies on low-latency trading capabilities, often achieved through kernel bypass networking and extensive colocation services to minimize the tick-to-trade interval. Firms are heavily invested in quantitative trading strategies, employing sophisticated market microstructure analysis and statistical arbitrage models.
  • The development of alpha generation models is now deeply intertwined with predictive signal development, leveraging technologies from gradient boosted trees to temporal convolutional networks. The operational backbone consists of advanced execution management systems that facilitate smart order routing across both traditional electronic communication networks and dark pools.
  • Rigorous algorithmic risk management is embedded through pre-trade risk controls and detailed post-trade analytics, including transaction cost analysis (TCA). The industry-wide pivot toward AI-powered systems for analyzing order book dynamics has compelled leadership to increase R&D budgets by an average of 20% to develop and validate next-generation market making algorithms and mean reversion strategies, ensuring they remain competitive.

What are the Key Data Covered in this Algorithmic Trading Market Research and Growth Report?

  • What is the expected growth of the Algorithmic Trading Market between 2026 and 2030?

    • USD 23.94 billion, at a CAGR of 16.7%

  • What segmentation does the market report cover?

    • The report is segmented by Component (Solutions, and Services), End-user (Institutional investors, Retail investors, Long-term investors, and Short-term investors), Deployment (Cloud, and On premises) and Geography (North America, APAC, Europe, South America, Middle East and Africa)

  • Which regions are analyzed in the report?

    • North America, APAC, Europe, South America and Middle East and Africa

  • What are the key growth drivers and market challenges?

    • Rising internet penetration enabling broader online trading, Increasing market volatility impacting strategy stability

  • Who are the major players in the Algorithmic Trading Market?

    • AlgoBulls Technologies Ltd, AlgoTraders, AlpacaDB Inc., Argo SE, DRW Holdings LLC, Global Trading Systems, InfoReach Inc., London Stock Exchange Group plc, MetaQuotes Ltd., QuantConnect Corp., QuantCore Capital Management LLC, RSJ a.s., Software AG, Symphony Fintech Solutions, Tata Consultancy Services, Tethys Technology Inc., TradeStation Group Inc., uTrade Solutions Pvt Ltd, Virtu Financial Inc. and Wyden AG

Market Research Insights

  • The algorithmic trading market is defined by intense competition and rapid technological evolution, where firms leverage AI-driven trading tools and machine learning trading models to gain an edge. The adoption of automated trading systems has demonstrated a clear impact on operational outcomes, with some platforms improving trade execution efficiency by over 20% compared to manual methods.
  • Concurrently, the use of proprietary trading algorithms allows firms to reduce slippage costs, contributing to a 15% improvement in net returns for certain strategies. The shift toward systematic trading is further supported by the integration of alternative data integration, which enhances the predictive power of multi-factor models.
  • This data-centric approach, combined with the scalability of cloud-based algorithmic trading, enables firms to innovate while managing infrastructure costs effectively.

We can help! Our analysts can customize this algorithmic trading market research report to meet your requirements.

Get in touch

1. Executive Summary

1.1 Market overview

Executive Summary - Chart on Market Overview
Executive Summary - Data Table on Market Overview
Executive Summary - Chart on Global Market Characteristics
Executive Summary - Chart on Market by Geography
Executive Summary - Chart on Market Segmentation by Component
Executive Summary - Chart on Market Segmentation by End-user
Executive Summary - Chart on Market Segmentation by Deployment
Executive Summary - Chart on Incremental Growth
Executive Summary - Data Table on Incremental Growth
Executive Summary - Chart on Company Market Positioning

2. Technavio Analysis

2.1 Analysis of price sensitivity, lifecycle, customer purchase basket, adoption rates, and purchase criteria

2.2 Criticality of inputs and Factors of differentiation

Chart on Overview on criticality of inputs and factors of differentiation

2.3 Factors of disruption

Chart on Overview on factors of disruption

2.4 Impact of drivers and challenges

Chart on Impact of drivers and challenges in 2025 and 2030

3. Market Landscape

3.1 Market ecosystem

Chart on Parent Market
Data Table on - Parent Market

3.2 Market characteristics

Chart on Market characteristics analysis

3.3 Value chain analysis

Chart on Value chain analysis

4. Market Sizing

4.1 Market definition

Data Table on Offerings of companies included in the market definition

4.2 Market segment analysis

Market segments

4.3 Market size 2025

4.4 Market outlook: Forecast for 2025-2030

Chart on Global - Market size and forecast 2025-2030 ($ million)
Data Table on Global - Market size and forecast 2025-2030 ($ million)
Chart on Global Market: Year-over-year growth 2025-2030 (%)
Data Table on Global Market: Year-over-year growth 2025-2030 (%)

5. Historic Market Size

5.1 Global Algorithmic Trading Market 2020 - 2024

Historic Market Size - Data Table on Global Algorithmic Trading Market 2020 - 2024 ($ million)

5.2 Component segment analysis 2020 - 2024

Historic Market Size - Component Segment 2020 - 2024 ($ million)

5.3 End-user segment analysis 2020 - 2024

Historic Market Size - End-user Segment 2020 - 2024 ($ million)

5.4 Deployment segment analysis 2020 - 2024

Historic Market Size - Deployment Segment 2020 - 2024 ($ million)

5.5 Geography segment analysis 2020 - 2024

Historic Market Size - Geography Segment 2020 - 2024 ($ million)

5.6 Country segment analysis 2020 - 2024

Historic Market Size - Country Segment 2020 - 2024 ($ million)

6. Qualitative Analysis

6.1 The AI impact on Global Algorithmic Trading Market

6.2 The impact of Geopolitical Conflicts on Global Algorithmic Trading Market

7. Five Forces Analysis

7.1 Five forces summary

Five forces analysis - Comparison between 2025 and 2030

7.2 Bargaining power of buyers

Bargaining power of buyers - Impact of key factors 2025 and 2030

7.3 Bargaining power of suppliers

Bargaining power of suppliers - Impact of key factors in 2025 and 2030

7.4 Threat of new entrants

Threat of new entrants - Impact of key factors in 2025 and 2030

7.5 Threat of substitutes

Threat of substitutes - Impact of key factors in 2025 and 2030

7.6 Threat of rivalry

Threat of rivalry - Impact of key factors in 2025 and 2030

7.7 Market condition

Chart on Market condition - Five forces 2025 and 2030

8. Market Segmentation by Component

8.1 Market segments

Chart on Component - Market share 2025-2030 (%)
Data Table on Component - Market share 2025-2030 (%)

8.2 Comparison by Component

Chart on Comparison by Component
Data Table on Comparison by Component

8.3 Solutions - Market size and forecast 2025-2030

Chart on Solutions - Market size and forecast 2025-2030 ($ million)
Data Table on Solutions - Market size and forecast 2025-2030 ($ million)
Chart on Solutions - Year-over-year growth 2025-2030 (%)
Data Table on Solutions - Year-over-year growth 2025-2030 (%)

8.4 Services - Market size and forecast 2025-2030

Chart on Services - Market size and forecast 2025-2030 ($ million)
Data Table on Services - Market size and forecast 2025-2030 ($ million)
Chart on Services - Year-over-year growth 2025-2030 (%)
Data Table on Services - Year-over-year growth 2025-2030 (%)

8.5 Market opportunity by Component

Market opportunity by Component ($ million)
Data Table on Market opportunity by Component ($ million)

9. Market Segmentation by End-user

9.1 Market segments

Chart on End-user - Market share 2025-2030 (%)
Data Table on End-user - Market share 2025-2030 (%)

9.2 Comparison by End-user

Chart on Comparison by End-user
Data Table on Comparison by End-user

9.3 Institutional investors - Market size and forecast 2025-2030

Chart on Institutional investors - Market size and forecast 2025-2030 ($ million)
Data Table on Institutional investors - Market size and forecast 2025-2030 ($ million)
Chart on Institutional investors - Year-over-year growth 2025-2030 (%)
Data Table on Institutional investors - Year-over-year growth 2025-2030 (%)

9.4 Retail investors - Market size and forecast 2025-2030

Chart on Retail investors - Market size and forecast 2025-2030 ($ million)
Data Table on Retail investors - Market size and forecast 2025-2030 ($ million)
Chart on Retail investors - Year-over-year growth 2025-2030 (%)
Data Table on Retail investors - Year-over-year growth 2025-2030 (%)

9.5 Long-term investors - Market size and forecast 2025-2030

Chart on Long-term investors - Market size and forecast 2025-2030 ($ million)
Data Table on Long-term investors - Market size and forecast 2025-2030 ($ million)
Chart on Long-term investors - Year-over-year growth 2025-2030 (%)
Data Table on Long-term investors - Year-over-year growth 2025-2030 (%)

9.6 Short-term investors - Market size and forecast 2025-2030

Chart on Short-term investors - Market size and forecast 2025-2030 ($ million)
Data Table on Short-term investors - Market size and forecast 2025-2030 ($ million)
Chart on Short-term investors - Year-over-year growth 2025-2030 (%)
Data Table on Short-term investors - Year-over-year growth 2025-2030 (%)

9.7 Market opportunity by End-user

Market opportunity by End-user ($ million)
Data Table on Market opportunity by End-user ($ million)

10. Market Segmentation by Deployment

10.1 Market segments

Chart on Deployment - Market share 2025-2030 (%)
Data Table on Deployment - Market share 2025-2030 (%)

10.2 Comparison by Deployment

Chart on Comparison by Deployment
Data Table on Comparison by Deployment

10.3 Cloud - Market size and forecast 2025-2030

Chart on Cloud - Market size and forecast 2025-2030 ($ million)
Data Table on Cloud - Market size and forecast 2025-2030 ($ million)
Chart on Cloud - Year-over-year growth 2025-2030 (%)
Data Table on Cloud - Year-over-year growth 2025-2030 (%)

10.4 On premises - Market size and forecast 2025-2030

Chart on On premises - Market size and forecast 2025-2030 ($ million)
Data Table on On premises - Market size and forecast 2025-2030 ($ million)
Chart on On premises - Year-over-year growth 2025-2030 (%)
Data Table on On premises - Year-over-year growth 2025-2030 (%)

10.5 Market opportunity by Deployment

Market opportunity by Deployment ($ million)
Data Table on Market opportunity by Deployment ($ million)

11. Customer Landscape

11.1 Customer landscape overview

Analysis of price sensitivity, lifecycle, customer purchase basket, adoption rates, and purchase criteria

12. Geographic Landscape

12.1 Geographic segmentation

Chart on Market share by geography 2025-2030 (%)
Data Table on Market share by geography 2025-2030 (%)

12.2 Geographic comparison

Chart on Geographic comparison
Data Table on Geographic comparison

12.3 North America - Market size and forecast 2025-2030

Chart on North America - Market size and forecast 2025-2030 ($ million)
Data Table on North America - Market size and forecast 2025-2030 ($ million)
Chart on North America - Year-over-year growth 2025-2030 (%)
Data Table on North America - Year-over-year growth 2025-2030 (%)
Chart on Regional Comparison - North America
Data Table on Regional Comparison - North America

12.3.1 US - Market size and forecast 2025-2030

Chart on US - Market size and forecast 2025-2030 ($ million)
Data Table on US - Market size and forecast 2025-2030 ($ million)
Chart on US - Year-over-year growth 2025-2030 (%)
Data Table on US - Year-over-year growth 2025-2030 (%)

12.3.2 Canada - Market size and forecast 2025-2030

Chart on Canada - Market size and forecast 2025-2030 ($ million)
Data Table on Canada - Market size and forecast 2025-2030 ($ million)
Chart on Canada - Year-over-year growth 2025-2030 (%)
Data Table on Canada - Year-over-year growth 2025-2030 (%)

12.3.3 Mexico - Market size and forecast 2025-2030

Chart on Mexico - Market size and forecast 2025-2030 ($ million)
Data Table on Mexico - Market size and forecast 2025-2030 ($ million)
Chart on Mexico - Year-over-year growth 2025-2030 (%)
Data Table on Mexico - Year-over-year growth 2025-2030 (%)

12.4 APAC - Market size and forecast 2025-2030

Chart on APAC - Market size and forecast 2025-2030 ($ million)
Data Table on APAC - Market size and forecast 2025-2030 ($ million)
Chart on APAC - Year-over-year growth 2025-2030 (%)
Data Table on APAC - Year-over-year growth 2025-2030 (%)
Chart on Regional Comparison - APAC
Data Table on Regional Comparison - APAC

12.4.1 China - Market size and forecast 2025-2030

Chart on China - Market size and forecast 2025-2030 ($ million)
Data Table on China - Market size and forecast 2025-2030 ($ million)
Chart on China - Year-over-year growth 2025-2030 (%)
Data Table on China - Year-over-year growth 2025-2030 (%)

12.4.2 Japan - Market size and forecast 2025-2030

Chart on Japan - Market size and forecast 2025-2030 ($ million)
Data Table on Japan - Market size and forecast 2025-2030 ($ million)
Chart on Japan - Year-over-year growth 2025-2030 (%)
Data Table on Japan - Year-over-year growth 2025-2030 (%)

12.4.3 India - Market size and forecast 2025-2030

Chart on India - Market size and forecast 2025-2030 ($ million)
Data Table on India - Market size and forecast 2025-2030 ($ million)
Chart on India - Year-over-year growth 2025-2030 (%)
Data Table on India - Year-over-year growth 2025-2030 (%)

12.4.4 South Korea - Market size and forecast 2025-2030

Chart on South Korea - Market size and forecast 2025-2030 ($ million)
Data Table on South Korea - Market size and forecast 2025-2030 ($ million)
Chart on South Korea - Year-over-year growth 2025-2030 (%)
Data Table on South Korea - Year-over-year growth 2025-2030 (%)

12.4.5 Australia - Market size and forecast 2025-2030

Chart on Australia - Market size and forecast 2025-2030 ($ million)
Data Table on Australia - Market size and forecast 2025-2030 ($ million)
Chart on Australia - Year-over-year growth 2025-2030 (%)
Data Table on Australia - Year-over-year growth 2025-2030 (%)

12.4.6 Indonesia - Market size and forecast 2025-2030

Chart on Indonesia - Market size and forecast 2025-2030 ($ million)
Data Table on Indonesia - Market size and forecast 2025-2030 ($ million)
Chart on Indonesia - Year-over-year growth 2025-2030 (%)
Data Table on Indonesia - Year-over-year growth 2025-2030 (%)

12.5 Europe - Market size and forecast 2025-2030

Chart on Europe - Market size and forecast 2025-2030 ($ million)
Data Table on Europe - Market size and forecast 2025-2030 ($ million)
Chart on Europe - Year-over-year growth 2025-2030 (%)
Data Table on Europe - Year-over-year growth 2025-2030 (%)
Chart on Regional Comparison - Europe
Data Table on Regional Comparison - Europe

12.5.1 Germany - Market size and forecast 2025-2030

Chart on Germany - Market size and forecast 2025-2030 ($ million)
Data Table on Germany - Market size and forecast 2025-2030 ($ million)
Chart on Germany - Year-over-year growth 2025-2030 (%)
Data Table on Germany - Year-over-year growth 2025-2030 (%)

12.5.2 UK - Market size and forecast 2025-2030

Chart on UK - Market size and forecast 2025-2030 ($ million)
Data Table on UK - Market size and forecast 2025-2030 ($ million)
Chart on UK - Year-over-year growth 2025-2030 (%)
Data Table on UK - Year-over-year growth 2025-2030 (%)

12.5.3 France - Market size and forecast 2025-2030

Chart on France - Market size and forecast 2025-2030 ($ million)
Data Table on France - Market size and forecast 2025-2030 ($ million)
Chart on France - Year-over-year growth 2025-2030 (%)
Data Table on France - Year-over-year growth 2025-2030 (%)

12.5.4 Italy - Market size and forecast 2025-2030

Chart on Italy - Market size and forecast 2025-2030 ($ million)
Data Table on Italy - Market size and forecast 2025-2030 ($ million)
Chart on Italy - Year-over-year growth 2025-2030 (%)
Data Table on Italy - Year-over-year growth 2025-2030 (%)

12.5.5 Spain - Market size and forecast 2025-2030

Chart on Spain - Market size and forecast 2025-2030 ($ million)
Data Table on Spain - Market size and forecast 2025-2030 ($ million)
Chart on Spain - Year-over-year growth 2025-2030 (%)
Data Table on Spain - Year-over-year growth 2025-2030 (%)

12.5.6 The Netherlands - Market size and forecast 2025-2030

Chart on The Netherlands - Market size and forecast 2025-2030 ($ million)
Data Table on The Netherlands - Market size and forecast 2025-2030 ($ million)
Chart on The Netherlands - Year-over-year growth 2025-2030 (%)
Data Table on The Netherlands - Year-over-year growth 2025-2030 (%)

12.6 South America - Market size and forecast 2025-2030

Chart on South America - Market size and forecast 2025-2030 ($ million)
Data Table on South America - Market size and forecast 2025-2030 ($ million)
Chart on South America - Year-over-year growth 2025-2030 (%)
Data Table on South America - Year-over-year growth 2025-2030 (%)
Chart on Regional Comparison - South America
Data Table on Regional Comparison - South America

12.6.1 Brazil - Market size and forecast 2025-2030

Chart on Brazil - Market size and forecast 2025-2030 ($ million)
Data Table on Brazil - Market size and forecast 2025-2030 ($ million)
Chart on Brazil - Year-over-year growth 2025-2030 (%)
Data Table on Brazil - Year-over-year growth 2025-2030 (%)

12.6.2 Argentina - Market size and forecast 2025-2030

Chart on Argentina - Market size and forecast 2025-2030 ($ million)
Data Table on Argentina - Market size and forecast 2025-2030 ($ million)
Chart on Argentina - Year-over-year growth 2025-2030 (%)
Data Table on Argentina - Year-over-year growth 2025-2030 (%)

12.6.3 Chile - Market size and forecast 2025-2030

Chart on Chile - Market size and forecast 2025-2030 ($ million)
Data Table on Chile - Market size and forecast 2025-2030 ($ million)
Chart on Chile - Year-over-year growth 2025-2030 (%)
Data Table on Chile - Year-over-year growth 2025-2030 (%)

12.7 Middle East and Africa - Market size and forecast 2025-2030

Chart on Middle East and Africa - Market size and forecast 2025-2030 ($ million)
Data Table on Middle East and Africa - Market size and forecast 2025-2030 ($ million)
Chart on Middle East and Africa - Year-over-year growth 2025-2030 (%)
Data Table on Middle East and Africa - Year-over-year growth 2025-2030 (%)
Chart on Regional Comparison - Middle East and Africa
Data Table on Regional Comparison - Middle East and Africa

12.7.1 Saudi Arabia - Market size and forecast 2025-2030

Chart on Saudi Arabia - Market size and forecast 2025-2030 ($ million)
Data Table on Saudi Arabia - Market size and forecast 2025-2030 ($ million)
Chart on Saudi Arabia - Year-over-year growth 2025-2030 (%)
Data Table on Saudi Arabia - Year-over-year growth 2025-2030 (%)

12.7.2 UAE - Market size and forecast 2025-2030

Chart on UAE - Market size and forecast 2025-2030 ($ million)
Data Table on UAE - Market size and forecast 2025-2030 ($ million)
Chart on UAE - Year-over-year growth 2025-2030 (%)
Data Table on UAE - Year-over-year growth 2025-2030 (%)

12.7.3 South Africa - Market size and forecast 2025-2030

Chart on South Africa - Market size and forecast 2025-2030 ($ million)
Data Table on South Africa - Market size and forecast 2025-2030 ($ million)
Chart on South Africa - Year-over-year growth 2025-2030 (%)
Data Table on South Africa - Year-over-year growth 2025-2030 (%)

12.7.4 Israel - Market size and forecast 2025-2030

Chart on Israel - Market size and forecast 2025-2030 ($ million)
Data Table on Israel - Market size and forecast 2025-2030 ($ million)
Chart on Israel - Year-over-year growth 2025-2030 (%)
Data Table on Israel - Year-over-year growth 2025-2030 (%)

12.7.5 Turkey - Market size and forecast 2025-2030

Chart on Turkey - Market size and forecast 2025-2030 ($ million)
Data Table on Turkey - Market size and forecast 2025-2030 ($ million)
Chart on Turkey - Year-over-year growth 2025-2030 (%)
Data Table on Turkey - Year-over-year growth 2025-2030 (%)

12.8 Market opportunity by geography

Market opportunity by geography ($ million)
Data Tables on Market opportunity by geography ($ million)

13. Drivers, Challenges, and Opportunity

13.1 Market drivers

Rising internet penetration enabling broader online trading
Increasing need for reduced transaction execution time
Expansion of electronic and automated trading platforms

13.2 Market challenges

Increasing market volatility impacting strategy stability
Regulatory changes complicating algorithm compliance requirements
Latency reduction pressures demanding costly infrastructure

13.3 Impact of drivers and challenges

Impact of drivers and challenges in 2025 and 2030

13.4 Market opportunities

Rapid adoption of AI-driven trading tools
Growing use of machine learning trading models
Expansion of cloud-based algorithmic trading platforms

14. Competitive Landscape

14.1 Overview

14.2

Overview on criticality of inputs and factors of differentiation

14.3 Landscape disruption

Overview on factors of disruption

14.4 Industry risks

Impact of key risks on business

15. Competitive Analysis

15.1 Companies profiled

Companies covered

15.2 Company ranking index

15.3 Market positioning of companies

Matrix on companies position and classification

15.4 AlpacaDB Inc.

AlpacaDB Inc. - Overview
AlpacaDB Inc. - Product / Service
AlpacaDB Inc. - Key offerings
SWOT

15.5 Argo SE

Argo SE - Overview
Argo SE - Product / Service
Argo SE - Key offerings
SWOT

15.6 DRW Holdings LLC

DRW Holdings LLC - Overview
DRW Holdings LLC - Product / Service
DRW Holdings LLC - Key offerings
SWOT

15.7 InfoReach Inc.

InfoReach Inc. - Overview
InfoReach Inc. - Product / Service
InfoReach Inc. - Key offerings
SWOT

15.8 London Stock Exchange Group plc

London Stock Exchange Group plc - Overview
London Stock Exchange Group plc - Business segments
London Stock Exchange Group plc - Key offerings
London Stock Exchange Group plc - Segment focus
SWOT

15.9 QuantConnect Corp.

QuantConnect Corp. - Overview
QuantConnect Corp. - Product / Service
QuantConnect Corp. - Key offerings
SWOT

15.10 RSJ a.s.

RSJ a.s. - Overview
RSJ a.s. - Product / Service
RSJ a.s. - Key offerings
SWOT

15.11 Software AG

Software AG - Overview
Software AG - Product / Service
Software AG - Key news
Software AG - Key offerings
SWOT

15.12 Symphony Fintech Solutions

Symphony Fintech Solutions - Overview
Symphony Fintech Solutions - Product / Service
Symphony Fintech Solutions - Key offerings
SWOT

15.13 Tata Consultancy Services

Tata Consultancy Services - Overview
Tata Consultancy Services - Business segments
Tata Consultancy Services - Key offerings
Tata Consultancy Services - Segment focus
SWOT

15.14 Tethys Technology Inc.

Tethys Technology Inc. - Overview
Tethys Technology Inc. - Product / Service
Tethys Technology Inc. - Key offerings
SWOT

15.15 TradeStation Group Inc.

TradeStation Group Inc. - Overview
TradeStation Group Inc. - Product / Service
TradeStation Group Inc. - Key offerings
SWOT

15.16 uTrade Solutions Pvt Ltd

uTrade Solutions Pvt Ltd - Overview
uTrade Solutions Pvt Ltd - Product / Service
uTrade Solutions Pvt Ltd - Key offerings
SWOT

15.17 Virtu Financial Inc.

Virtu Financial Inc. - Overview
Virtu Financial Inc. - Business segments
Virtu Financial Inc. - Key offerings
Virtu Financial Inc. - Segment focus
SWOT

15.18 Wyden AG

Wyden AG - Overview
Wyden AG - Product / Service
Wyden AG - Key offerings
SWOT

16. Appendix

16.1 Scope of the report

Market definition
Objectives
Notes and caveats

16.2 Inclusions and exclusions checklist

Inclusions checklist
Exclusions checklist

16.3 Currency conversion rates for US$

16.4 Research methodology

16.5 Data procurement

Information sources

16.6 Data validation

16.7 Validation techniques employed for market sizing

16.8 Data synthesis

16.9 360 degree market analysis

16.10 List of abbreviations

Research Methodology

Technavio presents a detailed picture of the market by way of study, synthesis, and summation of data from multiple sources. The analysts have presented the various facets of the market with a particular focus on identifying the key industry influencers. The data thus presented is comprehensive, reliable, and the result of extensive research, both primary and secondary.

INFORMATION SOURCES

Primary sources

  • Manufacturers and suppliers
  • Channel partners
  • Industry experts
  • Strategic decision makers

Secondary sources

  • Industry journals and periodicals
  • Government data
  • Financial reports of key industry players
  • Historical data
  • Press releases

DATA ANALYSIS

Data Synthesis

  • Collation of data
  • Estimation of key figures
  • Analysis of derived insights

Data Validation

  • Triangulation with data models
  • Reference against proprietary databases
  • Corroboration with industry experts

REPORT WRITING

Qualitative

  • Market drivers
  • Market challenges
  • Market trends
  • Five forces analysis

Quantitative

  • Market size and forecast
  • Market segmentation
  • Geographical insights
  • Competitive landscape

Interested in this report?

Get your sample now to see our research methodology and insights!

Download Now

Frequently Asked Questions

Algorithmic Trading market growth will increase by USD 23943.7 million during 2026-2030.

The Algorithmic Trading market is expected to grow at a CAGR of 16.7% during 2026-2030.

Algorithmic Trading market is segmented by Component (Solutions, Services) End-user (Institutional investors, Retail investors, Long-term investors, Short-term investors) Deployment (Cloud, On premises)

AlgoBulls Technologies Ltd, AlgoTraders, AlpacaDB Inc., Argo SE, DRW Holdings LLC, Global Trading Systems, InfoReach Inc., London Stock Exchange Group plc, MetaQuotes Ltd., QuantConnect Corp., QuantCore Capital Management LLC, RSJ a.s., Software AG, Symphony Fintech Solutions, Tata Consultancy Services, Tethys Technology Inc., TradeStation Group Inc., uTrade Solutions Pvt Ltd, Virtu Financial Inc., Wyden AG are a few of the key vendors in the Algorithmic Trading market.

North America will register the highest growth rate of 38.5% among the other regions. Therefore, the Algorithmic Trading market in North America is expected to garner significant business opportunities for the vendors during the forecast period.

US, Canada, Mexico, China, Japan, India, South Korea, Australia, Indonesia, Germany, UK, France, Italy, Spain, The Netherlands, Brazil, Argentina, Chile, Saudi Arabia, UAE, South Africa, Israel, Turkey

  • Rising internet penetration enabling broader online trading is the driving factor this market.

The Algorithmic Trading market vendors should focus on grabbing business opportunities from the Component segment as it accounted for the largest market share in the base year.
RIA - Research AI Assistant
Ask RIA