AI In Energy Management Market Analysis, Size, and Forecast 2025-2029: APAC (China, India, and Japan), North America (US, Canada, and Mexico), Europe (Germany, France, and UK), South America (Brazil, Argentina, and Colombia), Middle East and Africa (UAE, Saudi Arabia, and Israel), and Rest of World (ROW)

AI In Energy Management Market Analysis, Size, and Forecast 2025-2029:
APAC (China, India, and Japan), North America (US, Canada, and Mexico), Europe (Germany, France, and UK), South America (Brazil, Argentina, and Colombia), Middle East and Africa (UAE, Saudi Arabia, and Israel), and Rest of World (ROW)

Published: Dec 2025 321 Pages SKU: IRTNTR81047

Market Overview at a Glance

$16.06 B
Market Opportunity
20.8%
CAGR 2024 - 2029
40.4%
APAC Growth
$2.52 B
Renewable energy management segment 2023

AI In Energy Management Market Size 2025-2029

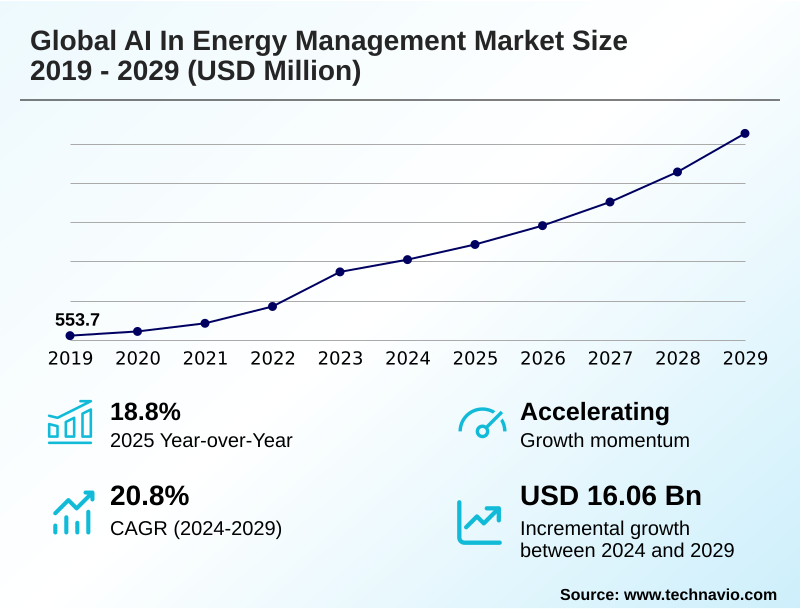
The ai in energy management market size is valued to increase by USD 16.06 billion, at a CAGR of 20.8% from 2024 to 2029. Imperative for grid modernization and stability will drive the ai in energy management market.

Major Market Trends & Insights

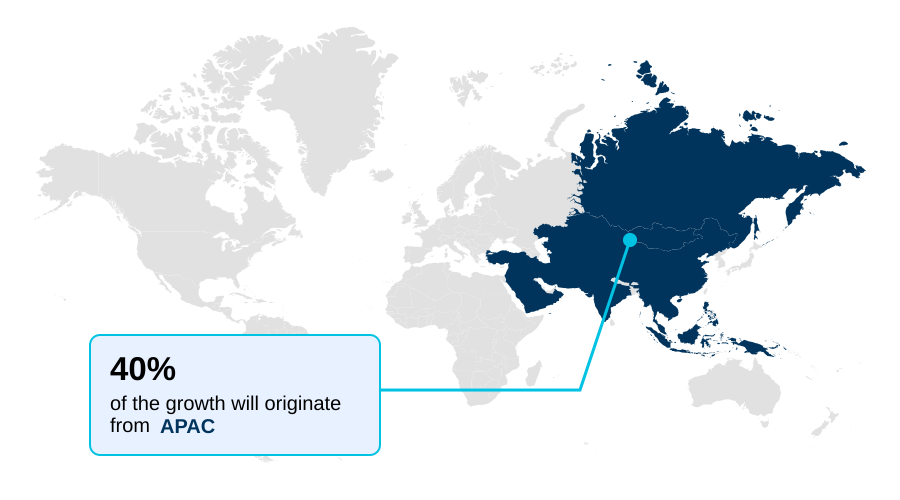
  • APAC dominated the market and accounted for a 40.4% growth during the forecast period.
  • By Application - Renewable energy management segment was valued at USD 2.52 billion in 2023
  • By Technology - Machine learning segment accounted for the largest market revenue share in 2023

Market Size & Forecast

  • Market Opportunities: USD 25.74 billion
  • Market Future Opportunities: USD 16.06 billion
  • CAGR from 2024 to 2029 : 20.8%

Market Summary

  • The ai in energy management market is driven by the need to modernize critical infrastructure and enhance operational efficiency. This transformation involves deploying sophisticated systems for ai for grid modernization and asset performance management. The global push for decarbonization accelerates the adoption of decarbonization technologies, where ai in energy management plays a pivotal role.
  • For instance, machine learning in utilities is crucial for integrating variable power sources by enabling precise renewable energy forecasting. A key business scenario involves a utility using predictive maintenance algorithms to analyze iot sensor data fusion from its aging transformer fleet.
  • This prescriptive maintenance in energy approach allows the firm to anticipate failures, schedule repairs proactively, and prevent costly outages, extending asset lifespan and ensuring intelligent grid management. However, this digital shift is not without challenges. Integrating advanced systems with legacy scada system integration is complex, and the industry faces a significant talent shortage.
  • Moreover, heightened cybersecurity for smart grids is essential to protect against adversarial attack detection and ensure the integrity of data from advanced metering infrastructure.

What will be the Size of the AI In Energy Management Market during the forecast period?

Get Key Insights on Market Forecast (PDF) Request Free Sample

How is the AI In Energy Management Market Segmented?

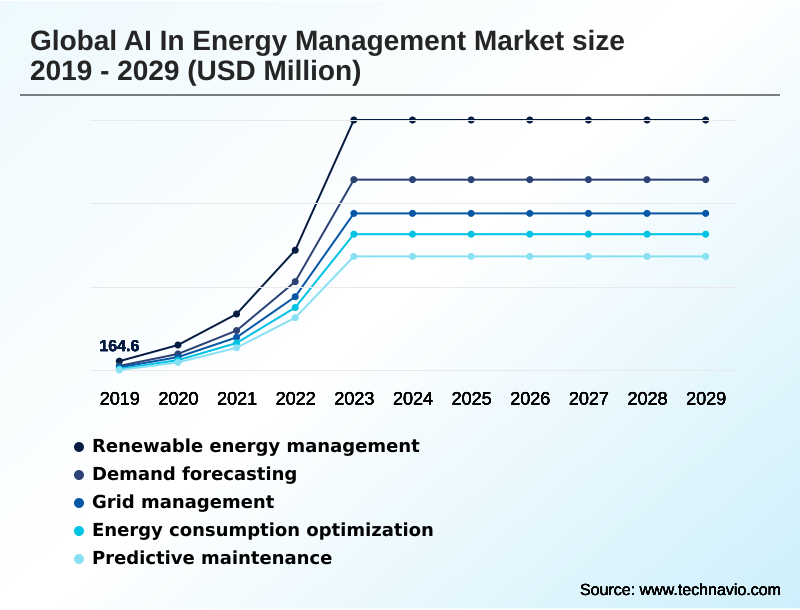
The ai in energy management industry research report provides comprehensive data (region-wise segment analysis), with forecasts and estimates in "USD million" for the period 2025-2029, as well as historical data from 2019-2023 for the following segments.

  • Application
    • Renewable energy management
    • Demand forecasting
    • Grid management
    • Energy consumption optimization
    • Predictive maintenance
  • Technology
    • Machine learning
    • Predictive analytics
    • NLP
    • Computer vision
  • End-user
    • Utilities
    • Manufacturing
    • Residential
    • Retail
  • Geography
    • APAC
      • China
      • India
      • Japan
    • North America
      • US
      • Canada
      • Mexico
    • Europe
      • Germany
      • France
      • UK
    • South America
      • Brazil
      • Argentina
      • Colombia
    • Middle East and Africa
      • UAE
      • Saudi Arabia
      • Israel
    • Rest of World (ROW)

By Application Insights

The renewable energy management segment is estimated to witness significant growth during the forecast period.

The management of renewable energy sources is fundamentally reshaped by AI, which is critical for ai for renewable integration.

The inherent variability of solar and wind power necessitates sophisticated renewable energy forecasting and solar power forecasting ai to maintain grid balance. Machine learning in utilities enables highly accurate predictions, while grid stability analytics allow operators to manage fluctuations.

AI in wind energy applications include turbine blade optimization to maximize output. Furthermore, AI orchestrates distributed energy resource management through virtual power plant platforms, aggregating assets like residential solar.

These platforms rely on advanced battery storage optimization and power flow optimization algorithms for intelligent grid management, with systems leveraging real-time energy monitoring to enhance reliability, boosting efficiency by up to 20%.

Request Free Sample

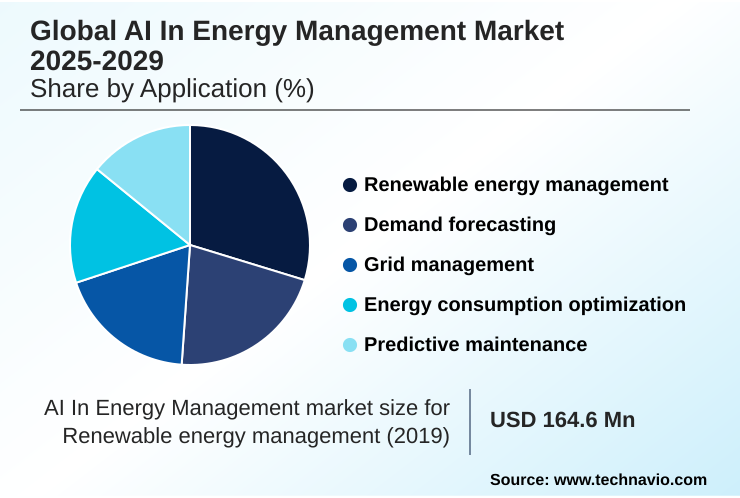
The Renewable energy management segment was valued at USD 2.52 billion in 2023 and showed a gradual increase during the forecast period.

Request Free Sample

Regional Analysis

APAC is estimated to contribute 40.4% to the growth of the global market during the forecast period.Technavio’s analysts have elaborately explained the regional trends and drivers that shape the market during the forecast period.

See How AI In Energy Management Market Demand is Rising in APAC Request Free Sample

The geographic landscape is diverse, with North America leading adoption due to significant investments in grid-enhancing technologies. The region accounts for over 30% of the market opportunity, with the US market alone valued at 2252 million.

In contrast, APAC is the fastest-growing region, contributing over 40% to the incremental growth, driven by massive urbanization and the deployment of energy data analytics platforms.

Advanced applications such as demand response optimization and smart meter data analytics are becoming standard. European markets focus on ai for sustainable energy and utility customer engagement through home energy management systems.

Across all regions, load balancing algorithms and automated grid control are critical for grid stability, while the rise of electric vehicles necessitates sophisticated ev charging management solutions.

Market Dynamics

Our researchers analyzed the data with 2024 as the base year, along with the key drivers, trends, and challenges. A holistic analysis of drivers will help companies refine their marketing strategies to gain a competitive advantage.

  • Strategic deployment of AI is reshaping energy operations from generation to consumption. The use of ai algorithms for grid load balancing is becoming critical for maintaining stability in grids with high renewable penetration. In the wind sector, predictive maintenance for wind turbines is a game-changer, while in commercial buildings, optimizing hvac systems with ai is delivering significant energy savings.
  • Utilities are leveraging demand forecasting using machine learning to achieve greater accuracy than traditional methods. The concept of the digital twin for power plant operations is moving from theory to practice, allowing for sophisticated simulations and prescriptive maintenance. A major focus is on securing smart grids from cyberattacks, as the consequences of a breach are severe.
  • Addressing ai-based renewable energy integration challenges remains a top priority. The push for explainable ai models for utility regulation is growing, driven by the need for transparency in decision-making. Planners are using generative ai for energy market simulation to test strategies against a wide range of future scenarios.
  • The growth of electric vehicles has made optimizing ev charging with ai a key area of innovation. For distribution utilities, reducing non-technical losses with ai offers a direct path to improved financial performance, with some systems showing more than double the detection rate of manual methods. Similarly, real-time fault detection in power grids drastically reduces outage durations.
  • Ai for energy consumption pattern analysis is enabling more personalized customer services, while computer vision for power line inspection enhances safety and efficiency. Technicians are also using natural language processing for maintenance logs to uncover hidden trends. The challenge of integrating ai with legacy scada systems is being addressed by the development of specialized middleware.
  • Finally, the creation of a robust ai platform for distributed energy resources is seen as essential, although it must address concerns around data privacy in smart meter analytics and create viable ai models for wholesale energy pricing while a cost-benefit analysis of ai in utilities is done.

What are the key market drivers leading to the rise in the adoption of AI In Energy Management Industry?

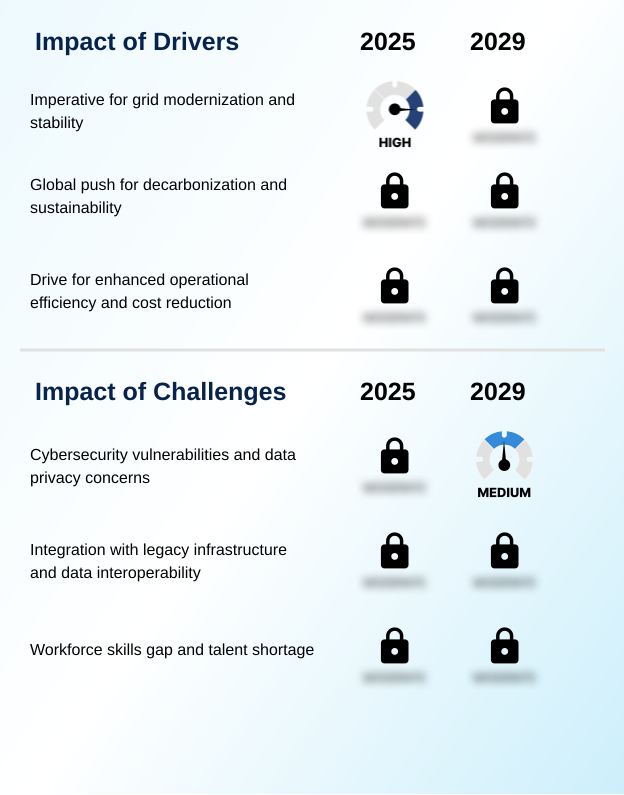
  • The imperative for grid modernization and enhanced stability is a key driver, compelling the adoption of intelligent technologies to manage an increasingly complex energy landscape.

  • The drive for operational efficiency is a primary catalyst, with predictive maintenance algorithms reducing equipment downtime by up to 70%.
  • The global push for decarbonization technologies necessitates ai for grid modernization and the effective management of renewables, supported by ai-driven demand forecasting and battery storage optimization.
  • AI-powered power flow optimization and grid congestion analysis are critical for maintaining stability as grids become more complex. AI-accelerated power flow models are reducing delays in the interconnection process for new energy sources.
  • Moreover, AI addresses significant revenue loss challenges; advanced systems for non-technical loss detection and electricity theft detection analyze data from advanced metering infrastructure to identify anomalies, directly impacting the financial health of utilities and reinforcing security for ai for critical infrastructure.

What are the market trends shaping the AI In Energy Management Industry?

  • The proliferation of generative AI for advanced simulation and optimization is emerging as a significant market trend, enabling more sophisticated strategic foresight and resilient management of complex energy systems.

  • A key trend is the rise of generative ai for energy simulation and digital twin simulation, which allows for advanced asset degradation modeling and risk assessment. These technologies improve planning and can reduce building energy use by optimizing for factors like natural light. Explainable ai in energy is gaining prominence to ensure transparency in high-risk applications, especially with new regulations.
  • Smart building energy optimization is driven by hvac optimization ai and real-time electricity pricing, leading to consumption reductions of at least 8%. In grid operations, self-healing grid technology and vegetation management ai enhance resilience and prevent outages. Furthermore, energy trading ai and sophisticated energy trading algorithms are transforming wholesale markets, enabling faster and more accurate decision-making.

What challenges does the AI In Energy Management Industry face during its growth?

  • Significant cybersecurity vulnerabilities and data privacy concerns present a key challenge, impeding market growth as energy grids become more interconnected and data-reliant.

  • A primary challenge is cybersecurity for smart grids, as increased connectivity expands the attack surface. Systems require robust adversarial attack detection and data poisoning mitigation to protect critical functions. Integrating modern machine learning in utilities with legacy infrastructure, including complex scada system integration, creates significant technical hurdles. The der interconnection process is often a bottleneck, hampering ai for renewable integration.
  • Data interoperability and quality issues stemming from siloed systems impede the effectiveness of energy consumption analytics and fault detection and diagnostics. Furthermore, a pronounced skills gap hinders progress, with 43% of utility executives citing a lack of expertise as a critical barrier to fully leveraging the potential of distributed energy resource management and iot sensor data fusion.

Exclusive Technavio Analysis on Customer Landscape

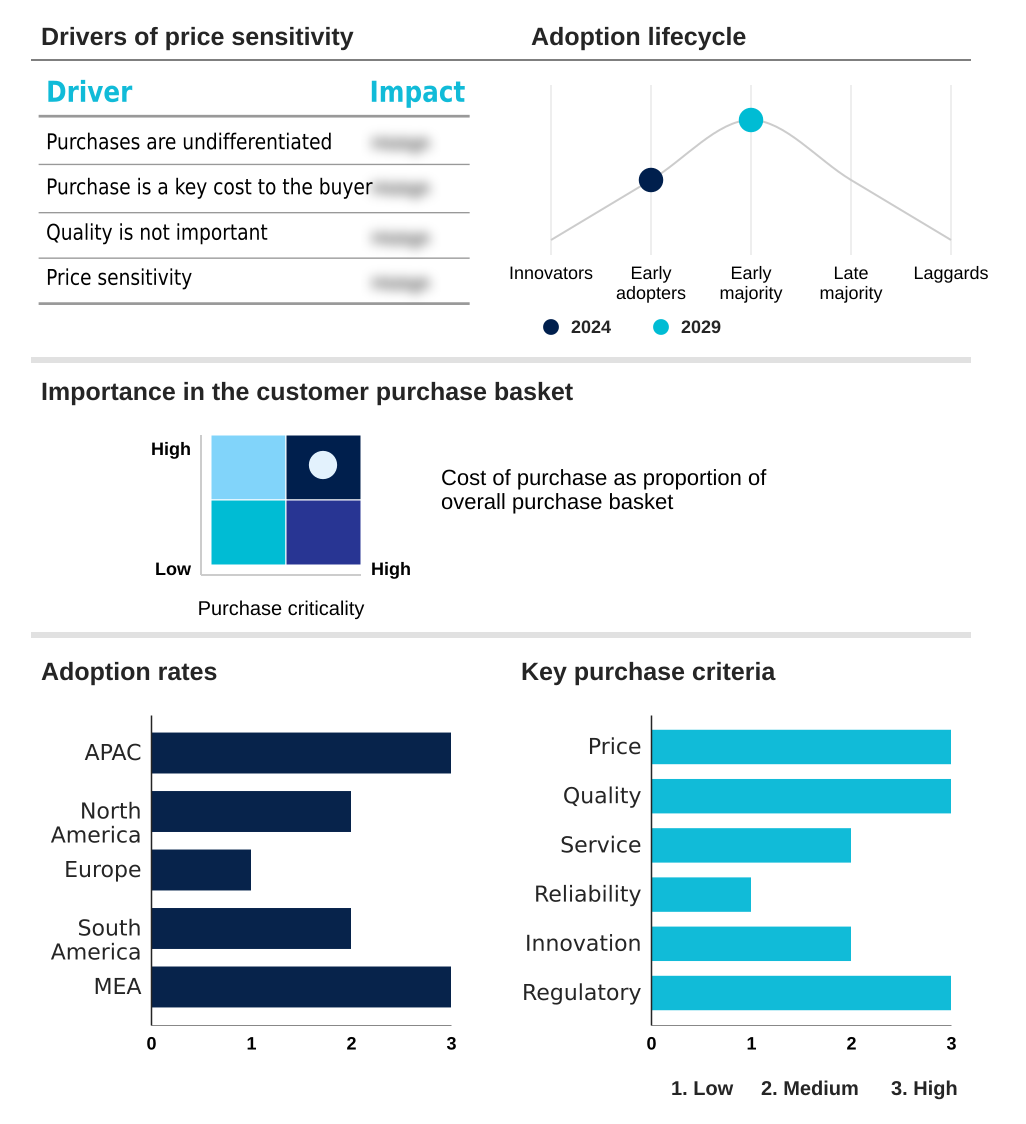
The ai in energy management market forecasting report includes the adoption lifecycle of the market, covering from the innovator’s stage to the laggard’s stage. It focuses on adoption rates in different regions based on penetration. Furthermore, the ai in energy management market report also includes key purchase criteria and drivers of price sensitivity to help companies evaluate and develop their market growth analysis strategies.

Customer Landscape of AI In Energy Management Industry

Competitive Landscape

Companies are implementing various strategies, such as strategic alliances, ai in energy management market forecast, partnerships, mergers and acquisitions, geographical expansion, and product/service launches, to enhance their presence in the industry.

ABB Ltd. - Offers a specialized platform focusing on automation and predictive analytics to optimize power distribution and enhance operational intelligence.

The industry research and growth report includes detailed analyses of the competitive landscape of the market and information about key companies, including:

  • ABB Ltd.
  • Alpiq Holding AG
  • Amazon Web Services Inc.
  • Atos SE
  • BIDGELY INC.
  • C3.ai Inc.
  • Enel Spa
  • GE Vernova Inc.
  • Grid4C
  • Honeywell International Inc.
  • IBM Corp.
  • Innowatts Inc.
  • iRasus
  • Microsoft Corp.
  • Oracle Corp.
  • Schneider Electric SE
  • Siemens AG
  • Tesla Inc.
  • Vestas Wind Systems AS

Qualitative and quantitative analysis of companies has been conducted to help clients understand the wider business environment as well as the strengths and weaknesses of key industry players. Data is qualitatively analyzed to categorize companies as pure play, category-focused, industry-focused, and diversified; it is quantitatively analyzed to categorize companies as dominant, leading, strong, tentative, and weak.

Recent Development and News in Ai in energy management market

  • In September 2024, Schneider Electric launched an AI-powered feature for its Wiser Home app to optimize the energy consumption of home appliances based on user habits and real-time data.
  • In December 2024, Schneider Electric announced a collaboration with NVIDIA to create a new data center reference design tailored for high-density, liquid-cooled AI clusters.
  • In March 2025, National Grid Partners announced its intention to invest $100 million in AI startups focused on advancing energy technologies, including firms specializing in AI-powered energy forecasting.
  • In April 2025, the U.S. Department of Energy announced new initiatives to accelerate AI innovation, including a report on AI for Energy and plans to co-locate data centers on federal lands.

Dive into Technavio’s robust research methodology, blending expert interviews, extensive data synthesis, and validated models for unparalleled AI In Energy Management Market insights. See full methodology.

Market Scope
Page number 321
Base year 2024
Historic period 2019-2023
Forecast period 2025-2029
Growth momentum & CAGR Accelerate at a CAGR of 20.8%
Market growth 2025-2029 USD 16064.2 million
Market structure Fragmented
YoY growth 2024-2025(%) 18.8%
Key countries China, India, Japan, South Korea, Australia, Indonesia, US, Canada, Mexico, Germany, France, UK, The Netherlands, Italy, Spain, Brazil, Argentina, Colombia, UAE, Saudi Arabia, Israel, South Africa and Turkey
Competitive landscape Leading Companies, Market Positioning of Companies, Competitive Strategies, and Industry Risks

Request Free Sample

Research Analyst Overview

  • The AI in energy management market is defined by a strategic shift toward data-driven operations. Core applications revolve around predictive maintenance algorithms and renewable energy forecasting, which are essential for managing modern energy systems. The implementation of demand response optimization and load balancing algorithms using smart meter data analytics is becoming standard practice.
  • Advanced digital twin simulation and energy efficiency modeling are enabling unprecedented levels of foresight in asset performance management and ai for grid modernization. A key trend is the use of vegetation management ai and computer vision for power line inspection to enhance grid resilience, a critical boardroom consideration for mitigating climate-related risks.
  • Virtual power plant platforms and ev charging management solutions are addressing the complexities of distributed energy. This transition is supported by technologies like iot sensor data fusion for real-time energy monitoring and hvac optimization ai for consumption reduction.
  • The adoption of predictive maintenance for wind turbines has been shown to reduce maintenance costs by 20%, showcasing a clear ROI that justifies strategic investment in these intelligent systems, from power flow optimization to automated grid control.

What are the Key Data Covered in this AI In Energy Management Market Research and Growth Report?

  • What is the expected growth of the AI In Energy Management Market between 2025 and 2029?

    • USD 16.06 billion, at a CAGR of 20.8%

  • What segmentation does the market report cover?

    • The report is segmented by Application (Renewable energy management, Demand forecasting, Grid management, Energy consumption optimization, Predictive maintenance), Technology (Machine learning, Predictive analytics, NLP, Computer vision), End-user (Utilities, Manufacturing, Residential, Retail) and Geography (APAC, North America, Europe, South America, Middle East and Africa)

  • Which regions are analyzed in the report?

    • APAC, North America, Europe, South America and Middle East and Africa

  • What are the key growth drivers and market challenges?

    • Imperative for grid modernization and stability, Cybersecurity vulnerabilities and data privacy concerns

  • Who are the major players in the AI In Energy Management Market?

    • ABB Ltd., Alpiq Holding AG, Amazon Web Services Inc., Atos SE, BIDGELY INC., C3.ai Inc., Enel Spa, GE Vernova Inc., Grid4C, Honeywell International Inc., IBM Corp., Innowatts Inc., iRasus, Microsoft Corp., Oracle Corp., Schneider Electric SE, Siemens AG, Tesla Inc. and Vestas Wind Systems AS

Market Research Insights

  • Market dynamics are increasingly shaped by ai-powered energy solutions that deliver tangible business outcomes. The adoption of intelligent grid management is driven by significant efficiency gains, as prescriptive maintenance in energy can reduce unplanned downtime by as much as 30%.
  • However, progress is tempered by a critical skills gap, with 43% of utility executives citing a lack of expertise as a primary barrier to implementing machine learning in utilities. The push for decarbonization technologies fuels investment in ai for renewable integration and smart building energy optimization.
  • As the iot in energy sector expands, so do concerns around operational technology security and cybersecurity for smart grids. Success hinges on balancing innovation in areas like deep learning for energy and generative ai for energy simulation with the need for robust security and a skilled workforce.

We can help! Our analysts can customize this ai in energy management market research report to meet your requirements.

Get in touch

1. Executive Summary

1.1 Market overview

Executive Summary - Chart on Market Overview
Executive Summary - Data Table on Market Overview
Executive Summary - Chart on Global Market Characteristics
Executive Summary - Chart on Market by Geography
Executive Summary - Chart on Market Segmentation by Application
Executive Summary - Chart on Market Segmentation by Technology
Executive Summary - Chart on Market Segmentation by End-user
Executive Summary - Chart on Incremental Growth
Executive Summary - Data Table on Incremental Growth
Executive Summary - Chart on Company Market Positioning

2. Technavio Analysis

2.1 Analysis of price sensitivity, lifecycle, customer purchase basket, adoption rates, and purchase criteria

2.2 Criticality of inputs and Factors of differentiation

Chart on Overview on criticality of inputs and factors of differentiation

2.3 Factors of disruption

Chart on Overview on factors of disruption

2.4 Impact of drivers and challenges

Chart on Impact of drivers and challenges in 2024 and 2029

3. Market Landscape

3.1 Market ecosystem

Chart on Parent Market
Data Table on - Parent Market

3.2 Market characteristics

Chart on Market characteristics analysis

3.3 Value chain analysis

Chart on Value chain analysis

4. Market Sizing

4.1 Market definition

Data Table on Offerings of companies included in the market definition

4.2 Market segment analysis

Market segments

4.3 Market size 2024

4.4 Market outlook: Forecast for 2024-2029

Chart on Global - Market size and forecast 2024-2029 ($ million)
Data Table on Global - Market size and forecast 2024-2029 ($ million)
Chart on Global Market: Year-over-year growth 2024-2029 (%)
Data Table on Global Market: Year-over-year growth 2024-2029 (%)

5. Historic Market Size

5.1 Global AI In Energy Management Market 2019 - 2023

Historic Market Size - Data Table on Global AI In Energy Management Market 2019 - 2023 ($ million)

5.2 Application segment analysis 2019 - 2023

Historic Market Size - Application Segment 2019 - 2023 ($ million)

5.3 Technology segment analysis 2019 - 2023

Historic Market Size - Technology Segment 2019 - 2023 ($ million)

5.4 End-user segment analysis 2019 - 2023

Historic Market Size - End-user Segment 2019 - 2023 ($ million)

5.5 Geography segment analysis 2019 - 2023

Historic Market Size - Geography Segment 2019 - 2023 ($ million)

5.6 Country segment analysis 2019 - 2023

Historic Market Size - Country Segment 2019 - 2023 ($ million)

6. Five Forces Analysis

6.1 Five forces summary

Five forces analysis - Comparison between 2024 and 2029

6.2 Bargaining power of buyers

Bargaining power of buyers - Impact of key factors 2024 and 2029

6.3 Bargaining power of suppliers

Bargaining power of suppliers - Impact of key factors in 2024 and 2029

6.4 Threat of new entrants

Threat of new entrants - Impact of key factors in 2024 and 2029

6.5 Threat of substitutes

Threat of substitutes - Impact of key factors in 2024 and 2029

6.6 Threat of rivalry

Threat of rivalry - Impact of key factors in 2024 and 2029

6.7 Market condition

Chart on Market condition - Five forces 2024 and 2029

7. Market Segmentation by Application

7.1 Market segments

Chart on Application - Market share 2024-2029 (%)
Data Table on Application - Market share 2024-2029 (%)

7.2 Comparison by Application

Chart on Comparison by Application
Data Table on Comparison by Application

7.3 Renewable energy management - Market size and forecast 2024-2029

Chart on Renewable energy management - Market size and forecast 2024-2029 ($ million)
Data Table on Renewable energy management - Market size and forecast 2024-2029 ($ million)
Chart on Renewable energy management - Year-over-year growth 2024-2029 (%)
Data Table on Renewable energy management - Year-over-year growth 2024-2029 (%)

7.4 Demand forecasting - Market size and forecast 2024-2029

Chart on Demand forecasting - Market size and forecast 2024-2029 ($ million)
Data Table on Demand forecasting - Market size and forecast 2024-2029 ($ million)
Chart on Demand forecasting - Year-over-year growth 2024-2029 (%)
Data Table on Demand forecasting - Year-over-year growth 2024-2029 (%)

7.5 Grid management - Market size and forecast 2024-2029

Chart on Grid management - Market size and forecast 2024-2029 ($ million)
Data Table on Grid management - Market size and forecast 2024-2029 ($ million)
Chart on Grid management - Year-over-year growth 2024-2029 (%)
Data Table on Grid management - Year-over-year growth 2024-2029 (%)

7.6 Energy consumption optimization - Market size and forecast 2024-2029

Chart on Energy consumption optimization - Market size and forecast 2024-2029 ($ million)
Data Table on Energy consumption optimization - Market size and forecast 2024-2029 ($ million)
Chart on Energy consumption optimization - Year-over-year growth 2024-2029 (%)
Data Table on Energy consumption optimization - Year-over-year growth 2024-2029 (%)

7.7 Predictive maintenance - Market size and forecast 2024-2029

Chart on Predictive maintenance - Market size and forecast 2024-2029 ($ million)
Data Table on Predictive maintenance - Market size and forecast 2024-2029 ($ million)
Chart on Predictive maintenance - Year-over-year growth 2024-2029 (%)
Data Table on Predictive maintenance - Year-over-year growth 2024-2029 (%)

7.8 Market opportunity by Application

Market opportunity by Application ($ million)
Data Table on Market opportunity by Application ($ million)

8. Market Segmentation by Technology

8.1 Market segments

Chart on Technology - Market share 2024-2029 (%)
Data Table on Technology - Market share 2024-2029 (%)

8.2 Comparison by Technology

Chart on Comparison by Technology
Data Table on Comparison by Technology

8.3 Machine learning - Market size and forecast 2024-2029

Chart on Machine learning - Market size and forecast 2024-2029 ($ million)
Data Table on Machine learning - Market size and forecast 2024-2029 ($ million)
Chart on Machine learning - Year-over-year growth 2024-2029 (%)
Data Table on Machine learning - Year-over-year growth 2024-2029 (%)

8.4 Predictive analytics - Market size and forecast 2024-2029

Chart on Predictive analytics - Market size and forecast 2024-2029 ($ million)
Data Table on Predictive analytics - Market size and forecast 2024-2029 ($ million)
Chart on Predictive analytics - Year-over-year growth 2024-2029 (%)
Data Table on Predictive analytics - Year-over-year growth 2024-2029 (%)

8.5 NLP - Market size and forecast 2024-2029

Chart on NLP - Market size and forecast 2024-2029 ($ million)
Data Table on NLP - Market size and forecast 2024-2029 ($ million)
Chart on NLP - Year-over-year growth 2024-2029 (%)
Data Table on NLP - Year-over-year growth 2024-2029 (%)

8.6 Computer vision - Market size and forecast 2024-2029

Chart on Computer vision - Market size and forecast 2024-2029 ($ million)
Data Table on Computer vision - Market size and forecast 2024-2029 ($ million)
Chart on Computer vision - Year-over-year growth 2024-2029 (%)
Data Table on Computer vision - Year-over-year growth 2024-2029 (%)

8.7 Market opportunity by Technology

Market opportunity by Technology ($ million)
Data Table on Market opportunity by Technology ($ million)

9. Market Segmentation by End-user

9.1 Market segments

Chart on End-user - Market share 2024-2029 (%)
Data Table on End-user - Market share 2024-2029 (%)

9.2 Comparison by End-user

Chart on Comparison by End-user
Data Table on Comparison by End-user

9.3 Utilities - Market size and forecast 2024-2029

Chart on Utilities - Market size and forecast 2024-2029 ($ million)
Data Table on Utilities - Market size and forecast 2024-2029 ($ million)
Chart on Utilities - Year-over-year growth 2024-2029 (%)
Data Table on Utilities - Year-over-year growth 2024-2029 (%)

9.4 Manufacturing - Market size and forecast 2024-2029

Chart on Manufacturing - Market size and forecast 2024-2029 ($ million)
Data Table on Manufacturing - Market size and forecast 2024-2029 ($ million)
Chart on Manufacturing - Year-over-year growth 2024-2029 (%)
Data Table on Manufacturing - Year-over-year growth 2024-2029 (%)

9.5 Residential - Market size and forecast 2024-2029

Chart on Residential - Market size and forecast 2024-2029 ($ million)
Data Table on Residential - Market size and forecast 2024-2029 ($ million)
Chart on Residential - Year-over-year growth 2024-2029 (%)
Data Table on Residential - Year-over-year growth 2024-2029 (%)

9.6 Retail - Market size and forecast 2024-2029

Chart on Retail - Market size and forecast 2024-2029 ($ million)
Data Table on Retail - Market size and forecast 2024-2029 ($ million)
Chart on Retail - Year-over-year growth 2024-2029 (%)
Data Table on Retail - Year-over-year growth 2024-2029 (%)

9.7 Market opportunity by End-user

Market opportunity by End-user ($ million)
Data Table on Market opportunity by End-user ($ million)

10. Customer Landscape

10.1 Customer landscape overview

Analysis of price sensitivity, lifecycle, customer purchase basket, adoption rates, and purchase criteria

11. Geographic Landscape

11.1 Geographic segmentation

Chart on Market share by geography 2024-2029 (%)
Data Table on Market share by geography 2024-2029 (%)

11.2 Geographic comparison

Chart on Geographic comparison
Data Table on Geographic comparison

11.3 APAC - Market size and forecast 2024-2029

Chart on APAC - Market size and forecast 2024-2029 ($ million)
Data Table on APAC - Market size and forecast 2024-2029 ($ million)
Chart on APAC - Year-over-year growth 2024-2029 (%)
Data Table on APAC - Year-over-year growth 2024-2029 (%)
Chart on Regional Comparison - APAC
Data Table on Regional Comparison - APAC

11.3.1 China - Market size and forecast 2024-2029

Chart on China - Market size and forecast 2024-2029 ($ million)
Data Table on China - Market size and forecast 2024-2029 ($ million)
Chart on China - Year-over-year growth 2024-2029 (%)
Data Table on China - Year-over-year growth 2024-2029 (%)

11.3.2 India - Market size and forecast 2024-2029

Chart on India - Market size and forecast 2024-2029 ($ million)
Data Table on India - Market size and forecast 2024-2029 ($ million)
Chart on India - Year-over-year growth 2024-2029 (%)
Data Table on India - Year-over-year growth 2024-2029 (%)

11.3.3 Japan - Market size and forecast 2024-2029

Chart on Japan - Market size and forecast 2024-2029 ($ million)
Data Table on Japan - Market size and forecast 2024-2029 ($ million)
Chart on Japan - Year-over-year growth 2024-2029 (%)
Data Table on Japan - Year-over-year growth 2024-2029 (%)

11.3.4 South Korea - Market size and forecast 2024-2029

Chart on South Korea - Market size and forecast 2024-2029 ($ million)
Data Table on South Korea - Market size and forecast 2024-2029 ($ million)
Chart on South Korea - Year-over-year growth 2024-2029 (%)
Data Table on South Korea - Year-over-year growth 2024-2029 (%)

11.3.5 Australia - Market size and forecast 2024-2029

Chart on Australia - Market size and forecast 2024-2029 ($ million)
Data Table on Australia - Market size and forecast 2024-2029 ($ million)
Chart on Australia - Year-over-year growth 2024-2029 (%)
Data Table on Australia - Year-over-year growth 2024-2029 (%)

11.3.6 Indonesia - Market size and forecast 2024-2029

Chart on Indonesia - Market size and forecast 2024-2029 ($ million)
Data Table on Indonesia - Market size and forecast 2024-2029 ($ million)
Chart on Indonesia - Year-over-year growth 2024-2029 (%)
Data Table on Indonesia - Year-over-year growth 2024-2029 (%)

11.4 North America - Market size and forecast 2024-2029

Chart on North America - Market size and forecast 2024-2029 ($ million)
Data Table on North America - Market size and forecast 2024-2029 ($ million)
Chart on North America - Year-over-year growth 2024-2029 (%)
Data Table on North America - Year-over-year growth 2024-2029 (%)
Chart on Regional Comparison - North America
Data Table on Regional Comparison - North America

11.4.1 US - Market size and forecast 2024-2029

Chart on US - Market size and forecast 2024-2029 ($ million)
Data Table on US - Market size and forecast 2024-2029 ($ million)
Chart on US - Year-over-year growth 2024-2029 (%)
Data Table on US - Year-over-year growth 2024-2029 (%)

11.4.2 Canada - Market size and forecast 2024-2029

Chart on Canada - Market size and forecast 2024-2029 ($ million)
Data Table on Canada - Market size and forecast 2024-2029 ($ million)
Chart on Canada - Year-over-year growth 2024-2029 (%)
Data Table on Canada - Year-over-year growth 2024-2029 (%)

11.4.3 Mexico - Market size and forecast 2024-2029

Chart on Mexico - Market size and forecast 2024-2029 ($ million)
Data Table on Mexico - Market size and forecast 2024-2029 ($ million)
Chart on Mexico - Year-over-year growth 2024-2029 (%)
Data Table on Mexico - Year-over-year growth 2024-2029 (%)

11.5 Europe - Market size and forecast 2024-2029

Chart on Europe - Market size and forecast 2024-2029 ($ million)
Data Table on Europe - Market size and forecast 2024-2029 ($ million)
Chart on Europe - Year-over-year growth 2024-2029 (%)
Data Table on Europe - Year-over-year growth 2024-2029 (%)
Chart on Regional Comparison - Europe
Data Table on Regional Comparison - Europe

11.5.1 Germany - Market size and forecast 2024-2029

Chart on Germany - Market size and forecast 2024-2029 ($ million)
Data Table on Germany - Market size and forecast 2024-2029 ($ million)
Chart on Germany - Year-over-year growth 2024-2029 (%)
Data Table on Germany - Year-over-year growth 2024-2029 (%)

11.5.2 France - Market size and forecast 2024-2029

Chart on France - Market size and forecast 2024-2029 ($ million)
Data Table on France - Market size and forecast 2024-2029 ($ million)
Chart on France - Year-over-year growth 2024-2029 (%)
Data Table on France - Year-over-year growth 2024-2029 (%)

11.5.3 UK - Market size and forecast 2024-2029

Chart on UK - Market size and forecast 2024-2029 ($ million)
Data Table on UK - Market size and forecast 2024-2029 ($ million)
Chart on UK - Year-over-year growth 2024-2029 (%)
Data Table on UK - Year-over-year growth 2024-2029 (%)

11.5.4 The Netherlands - Market size and forecast 2024-2029

Chart on The Netherlands - Market size and forecast 2024-2029 ($ million)
Data Table on The Netherlands - Market size and forecast 2024-2029 ($ million)
Chart on The Netherlands - Year-over-year growth 2024-2029 (%)
Data Table on The Netherlands - Year-over-year growth 2024-2029 (%)

11.5.5 Italy - Market size and forecast 2024-2029

Chart on Italy - Market size and forecast 2024-2029 ($ million)
Data Table on Italy - Market size and forecast 2024-2029 ($ million)
Chart on Italy - Year-over-year growth 2024-2029 (%)
Data Table on Italy - Year-over-year growth 2024-2029 (%)

11.5.6 Spain - Market size and forecast 2024-2029

Chart on Spain - Market size and forecast 2024-2029 ($ million)
Data Table on Spain - Market size and forecast 2024-2029 ($ million)
Chart on Spain - Year-over-year growth 2024-2029 (%)
Data Table on Spain - Year-over-year growth 2024-2029 (%)

11.6 South America - Market size and forecast 2024-2029

Chart on South America - Market size and forecast 2024-2029 ($ million)
Data Table on South America - Market size and forecast 2024-2029 ($ million)
Chart on South America - Year-over-year growth 2024-2029 (%)
Data Table on South America - Year-over-year growth 2024-2029 (%)
Chart on Regional Comparison - South America
Data Table on Regional Comparison - South America

11.6.1 Brazil - Market size and forecast 2024-2029

Chart on Brazil - Market size and forecast 2024-2029 ($ million)
Data Table on Brazil - Market size and forecast 2024-2029 ($ million)
Chart on Brazil - Year-over-year growth 2024-2029 (%)
Data Table on Brazil - Year-over-year growth 2024-2029 (%)

11.6.2 Argentina - Market size and forecast 2024-2029

Chart on Argentina - Market size and forecast 2024-2029 ($ million)
Data Table on Argentina - Market size and forecast 2024-2029 ($ million)
Chart on Argentina - Year-over-year growth 2024-2029 (%)
Data Table on Argentina - Year-over-year growth 2024-2029 (%)

11.6.3 Colombia - Market size and forecast 2024-2029

Chart on Colombia - Market size and forecast 2024-2029 ($ million)
Data Table on Colombia - Market size and forecast 2024-2029 ($ million)
Chart on Colombia - Year-over-year growth 2024-2029 (%)
Data Table on Colombia - Year-over-year growth 2024-2029 (%)

11.7 Middle East and Africa - Market size and forecast 2024-2029

Chart on Middle East and Africa - Market size and forecast 2024-2029 ($ million)
Data Table on Middle East and Africa - Market size and forecast 2024-2029 ($ million)
Chart on Middle East and Africa - Year-over-year growth 2024-2029 (%)
Data Table on Middle East and Africa - Year-over-year growth 2024-2029 (%)
Chart on Regional Comparison - Middle East and Africa
Data Table on Regional Comparison - Middle East and Africa

11.7.1 UAE - Market size and forecast 2024-2029

Chart on UAE - Market size and forecast 2024-2029 ($ million)
Data Table on UAE - Market size and forecast 2024-2029 ($ million)
Chart on UAE - Year-over-year growth 2024-2029 (%)
Data Table on UAE - Year-over-year growth 2024-2029 (%)

11.7.2 Saudi Arabia - Market size and forecast 2024-2029

Chart on Saudi Arabia - Market size and forecast 2024-2029 ($ million)
Data Table on Saudi Arabia - Market size and forecast 2024-2029 ($ million)
Chart on Saudi Arabia - Year-over-year growth 2024-2029 (%)
Data Table on Saudi Arabia - Year-over-year growth 2024-2029 (%)

11.7.3 Israel - Market size and forecast 2024-2029

Chart on Israel - Market size and forecast 2024-2029 ($ million)
Data Table on Israel - Market size and forecast 2024-2029 ($ million)
Chart on Israel - Year-over-year growth 2024-2029 (%)
Data Table on Israel - Year-over-year growth 2024-2029 (%)

11.7.4 South Africa - Market size and forecast 2024-2029

Chart on South Africa - Market size and forecast 2024-2029 ($ million)
Data Table on South Africa - Market size and forecast 2024-2029 ($ million)
Chart on South Africa - Year-over-year growth 2024-2029 (%)
Data Table on South Africa - Year-over-year growth 2024-2029 (%)

11.7.5 Turkey - Market size and forecast 2024-2029

Chart on Turkey - Market size and forecast 2024-2029 ($ million)
Data Table on Turkey - Market size and forecast 2024-2029 ($ million)
Chart on Turkey - Year-over-year growth 2024-2029 (%)
Data Table on Turkey - Year-over-year growth 2024-2029 (%)

11.8 Market opportunity by geography

Market opportunity by geography ($ million)
Data Tables on Market opportunity by geography ($ million)

12. Drivers, Challenges, and Opportunity

12.1 Market drivers

Imperative for grid modernization and stability
Global push for decarbonization and sustainability
Drive for enhanced operational efficiency and cost reduction

12.2 Market challenges

Cybersecurity vulnerabilities and data privacy concerns
Integration with legacy infrastructure and data interoperability
Workforce skills gap and talent shortage

12.3 Impact of drivers and challenges

Impact of drivers and challenges in 2024 and 2029

12.4 Market opportunities

Proliferation of generative AI for advanced simulation and optimization
Rise of AI-powered digital twins for predictive and prescriptive asset management
Increasing focus on explainable AI (XAI) for transparency and trust

13. Competitive Landscape

13.1 Overview

13.2

Overview on criticality of inputs and factors of differentiation

13.3 Landscape disruption

Overview on factors of disruption

13.4 Industry risks

Impact of key risks on business

14. Competitive Analysis

14.1 Companies profiled

Companies covered

14.2 Company ranking index

14.3 Market positioning of companies

Matrix on companies position and classification

14.4 ABB Ltd.

ABB Ltd. - Overview
ABB Ltd. - Business segments
ABB Ltd. - Key news
ABB Ltd. - Key offerings
ABB Ltd. - Segment focus
SWOT

14.5 Alpiq Holding AG

Alpiq Holding AG - Overview
Alpiq Holding AG - Product / Service
Alpiq Holding AG - Key offerings
SWOT

14.6 Amazon Web Services Inc.

Amazon Web Services Inc. - Overview
Amazon Web Services Inc. - Product / Service
Amazon Web Services Inc. - Key news
Amazon Web Services Inc. - Key offerings
SWOT

14.7 Atos SE

Atos SE - Overview
Atos SE - Business segments
Atos SE - Key news
Atos SE - Key offerings
Atos SE - Segment focus
SWOT

14.8 BIDGELY INC.

BIDGELY INC. - Overview
BIDGELY INC. - Product / Service
BIDGELY INC. - Key offerings
SWOT

14.9 C3.ai Inc.

C3.ai Inc. - Overview
C3.ai Inc. - Product / Service
C3.ai Inc. - Key news
C3.ai Inc. - Key offerings
SWOT

14.10 GE Vernova Inc.

GE Vernova Inc. - Overview
GE Vernova Inc. - Business segments
GE Vernova Inc. - Key offerings
GE Vernova Inc. - Segment focus
SWOT

14.11 Honeywell International Inc.

Honeywell International Inc. - Overview
Honeywell International Inc. - Business segments
Honeywell International Inc. - Key news
Honeywell International Inc. - Key offerings
Honeywell International Inc. - Segment focus
SWOT

14.12 IBM Corp.

IBM Corp. - Overview
IBM Corp. - Business segments
IBM Corp. - Key news
IBM Corp. - Key offerings
IBM Corp. - Segment focus
SWOT

14.13 Microsoft Corp.

Microsoft Corp. - Overview
Microsoft Corp. - Business segments
Microsoft Corp. - Key news
Microsoft Corp. - Key offerings
Microsoft Corp. - Segment focus
SWOT

14.14 Oracle Corp.

Oracle Corp. - Overview
Oracle Corp. - Business segments
Oracle Corp. - Key news
Oracle Corp. - Key offerings
Oracle Corp. - Segment focus
SWOT

14.15 Schneider Electric SE

Schneider Electric SE - Overview
Schneider Electric SE - Business segments
Schneider Electric SE - Key news
Schneider Electric SE - Key offerings
Schneider Electric SE - Segment focus
SWOT

14.16 Siemens AG

Siemens AG - Overview
Siemens AG - Business segments
Siemens AG - Key news
Siemens AG - Key offerings
Siemens AG - Segment focus
SWOT

14.17 Tesla Inc.

Tesla Inc. - Overview
Tesla Inc. - Business segments
Tesla Inc. - Key news
Tesla Inc. - Key offerings
Tesla Inc. - Segment focus
SWOT

14.18 Vestas Wind Systems AS

Vestas Wind Systems AS - Overview
Vestas Wind Systems AS - Business segments
Vestas Wind Systems AS - Key offerings
Vestas Wind Systems AS - Segment focus
SWOT

15. Appendix

15.1 Scope of the report

Market definition
Objectives
Notes and caveats

15.2 Inclusions and exclusions checklist

Inclusions checklist
Exclusions checklist

15.3 Currency conversion rates for US$

15.4 Research methodology

15.5 Data procurement

Information sources

15.6 Data validation

15.7 Validation techniques employed for market sizing

15.8 Data synthesis

15.9 360 degree market analysis

15.10 List of abbreviations

Research Methodology

Technavio presents a detailed picture of the market by way of study, synthesis, and summation of data from multiple sources. The analysts have presented the various facets of the market with a particular focus on identifying the key industry influencers. The data thus presented is comprehensive, reliable, and the result of extensive research, both primary and secondary.

INFORMATION SOURCES

Primary sources

  • Manufacturers and suppliers
  • Channel partners
  • Industry experts
  • Strategic decision makers

Secondary sources

  • Industry journals and periodicals
  • Government data
  • Financial reports of key industry players
  • Historical data
  • Press releases

DATA ANALYSIS

Data Synthesis

  • Collation of data
  • Estimation of key figures
  • Analysis of derived insights

Data Validation

  • Triangulation with data models
  • Reference against proprietary databases
  • Corroboration with industry experts

REPORT WRITING

Qualitative

  • Market drivers
  • Market challenges
  • Market trends
  • Five forces analysis

Quantitative

  • Market size and forecast
  • Market segmentation
  • Geographical insights
  • Competitive landscape

Interested in this report?

Get your sample now to see our research methodology and insights!

Download Now

Frequently Asked Questions

AI In Energy Management market growth will increase by USD 16064.2 million during 2025-2029 .

The AI In Energy Management market is expected to grow at a CAGR of 20.8% during 2025-2029 .

AI In Energy Management market is segmented by Application (Renewable energy management, Demand forecasting, Grid management, Energy consumption optimization, Predictive maintenance) Technology (Machine learning, Predictive analytics, NLP, Computer vision) End-user (Utilities, Manufacturing, Residential, Retail)

ABB Ltd., Alpiq Holding AG, Amazon Web Services Inc., Atos SE, BIDGELY INC., C3.ai Inc., Enel Spa, GE Vernova Inc., Grid4C, Honeywell International Inc., IBM Corp., Innowatts Inc., iRasus, Microsoft Corp., Oracle Corp., Schneider Electric SE, Siemens AG, Tesla Inc., Vestas Wind Systems AS are a few of the key vendors in the AI In Energy Management market.

APAC will register the highest growth rate of 40.4% among the other regions. Therefore, the AI In Energy Management market in APAC is expected to garner significant business opportunities for the vendors during the forecast period.

China, India, Japan, South Korea, Australia, Indonesia, US, Canada, Mexico, Germany, France, UK, The Netherlands, Italy, Spain, Brazil, Argentina, Colombia, UAE, Saudi Arabia, Israel, South Africa, Turkey

  • Imperative for grid modernization and stability is the driving factor this market.

The AI In Energy Management market vendors should focus on grabbing business opportunities from the Application segment as it accounted for the largest market share in the base year.