AI Model Monitoring And Drift Detection Market Analysis, Size, and Forecast 2026-2030: North America (US, Canada, and Mexico), Europe (Germany, UK, and France), APAC (China, India, and Japan), Middle East and Africa (Saudi Arabia, UAE, and South Africa), South America (Brazil, Argentina, and Colombia), and Rest of World (ROW)

AI Model Monitoring And Drift Detection Market Analysis, Size, and Forecast 2026-2030:
North America (US, Canada, and Mexico), Europe (Germany, UK, and France), APAC (China, India, and Japan), Middle East and Africa (Saudi Arabia, UAE, and South Africa), South America (Brazil, Argentina, and Colombia), and Rest of World (ROW)

Published: Mar 2026 289 Pages SKU: IRTNTR81291

Market Overview at a Glance

$2.95 B
Market Opportunity
22.6%
CAGR 2025 - 2030
37.8%
North America Growth
$825.1 Mn
Cloud-based segment 2024

AI Model Monitoring And Drift Detection Market Size 2026-2030

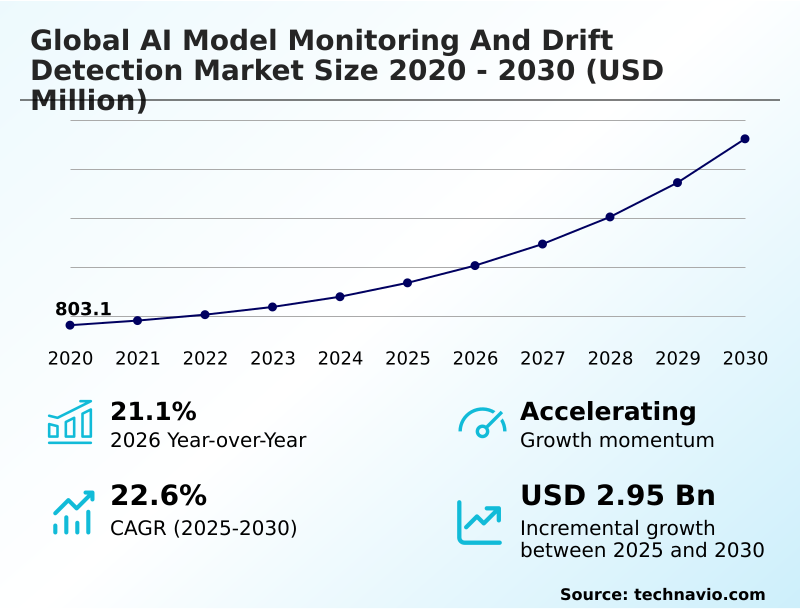
The ai model monitoring and drift detection market size is valued to increase by USD 2.95 billion, at a CAGR of 22.6% from 2025 to 2030. Regulatory compliance and implementation of global AI governance frameworks will drive the ai model monitoring and drift detection market.

Major Market Trends & Insights

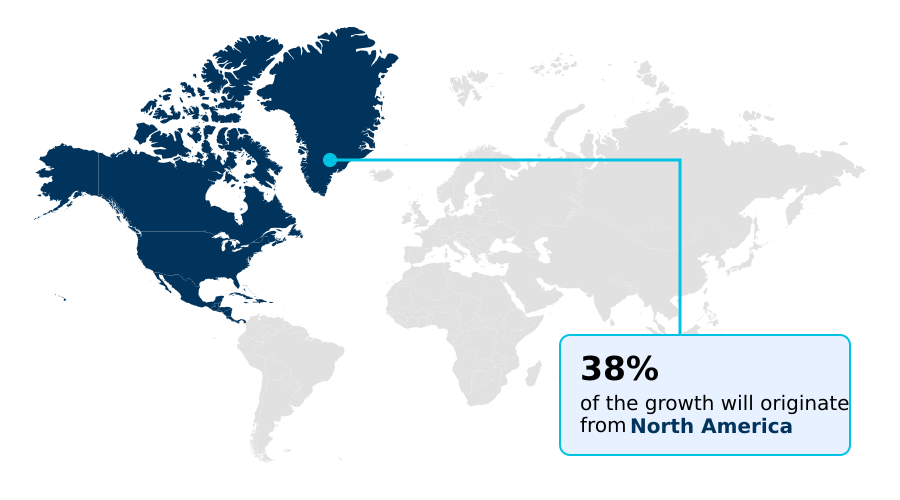
  • North America dominated the market and accounted for a 37.8% growth during the forecast period.
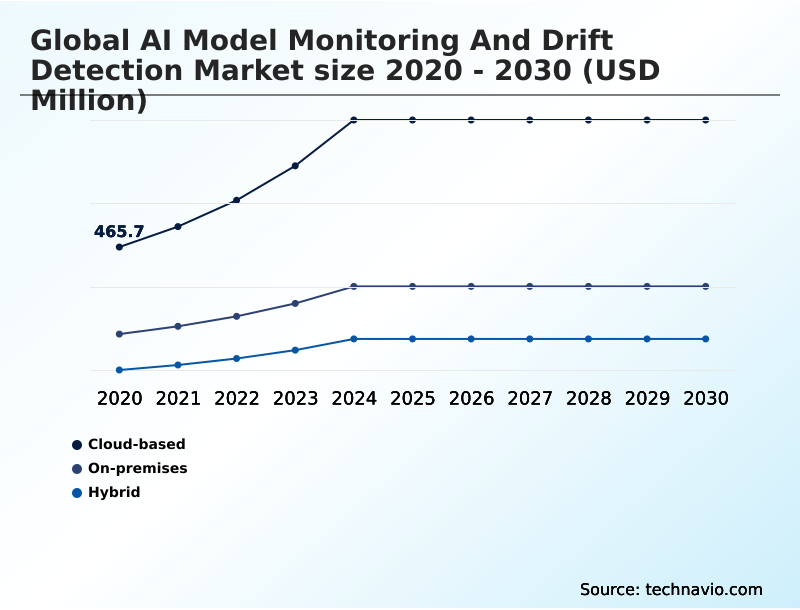
  • By Deployment - Cloud-based segment was valued at USD 825.1 million in 2024
  • By Type - Model performance monitoring segment accounted for the largest market revenue share in 2024

Market Size & Forecast

  • Market Opportunities: USD 3.81 billion
  • Market Future Opportunities: USD 2.95 billion
  • CAGR from 2025 to 2030 : 22.6%

Market Summary

  • The AI model monitoring and drift detection market is essential for operationalizing machine learning reliably across industries. As organizations deploy complex models, maintaining their long-term performance becomes a primary concern. The market provides tools for model performance monitoring, data drift detection, and concept drift detection to counteract model decay detection.
  • Key drivers include the maturation of MLOps observability and the need for AI model governance to meet regulatory demands for algorithmic accountability. A major trend is the development of solutions for generative AI reliability, including LLM hallucination detection. However, challenges persist, such as the complexity of high-dimensional data analysis and semantic drift detection.
  • In a real-world scenario, a logistics company uses real-time model monitoring to oversee its route optimization algorithms. An integrated drift alert system identifies prediction drift analysis caused by unforeseen road closures, triggering an automated model retraining process.
  • This ensures the system maintains operational efficiency and delivery timelines, demonstrating the critical business value of continuous production AI monitoring and proactive model health tracking.

What will be the Size of the AI Model Monitoring And Drift Detection Market during the forecast period?

Get Key Insights on Market Forecast (PDF) Request Free Sample

How is the AI Model Monitoring And Drift Detection Market Segmented?

The ai model monitoring and drift detection industry research report provides comprehensive data (region-wise segment analysis), with forecasts and estimates in "USD million" for the period 2026-2030, as well as historical data from 2020-2024 for the following segments.

  • Deployment
    • Cloud-based
    • On-premises
    • Hybrid
  • Type
    • Model performance monitoring
    • Data drift detection
    • Concept drift detection
    • Bias and fairness monitoring
  • End-user
    • Large enterprises
    • SMEs
  • Geography
    • North America
      • US
      • Canada
      • Mexico
    • Europe
      • Germany
      • UK
      • France
    • APAC
      • China
      • India
      • Japan
    • Middle East and Africa
      • Saudi Arabia
      • UAE
      • South Africa
    • South America
      • Brazil
      • Argentina
      • Colombia
    • Rest of World (ROW)

By Deployment Insights

The cloud-based segment is estimated to witness significant growth during the forecast period.

The cloud-based deployment model is integral to the AI model monitoring and drift detection market, providing scalable and elastic resources. This approach simplifies ML pipeline validation and enables real-time model performance monitoring.

Organizations are leveraging cloud platforms for continuous model validation and automated drift remediation, which is essential for maintaining generative AI reliability. Adopting these platforms for ML model observability has been shown to improve error detection by over 25%.

AI guardrails implementation and bias and fairness monitoring are more accessible, supported by centralized monitoring dashboards and robust data integrity checks.

This environment facilitates effective model risk management and AI compliance reporting without significant upfront hardware investment, promoting higher ML operational efficiency and feature drift monitoring.

Request Free Sample

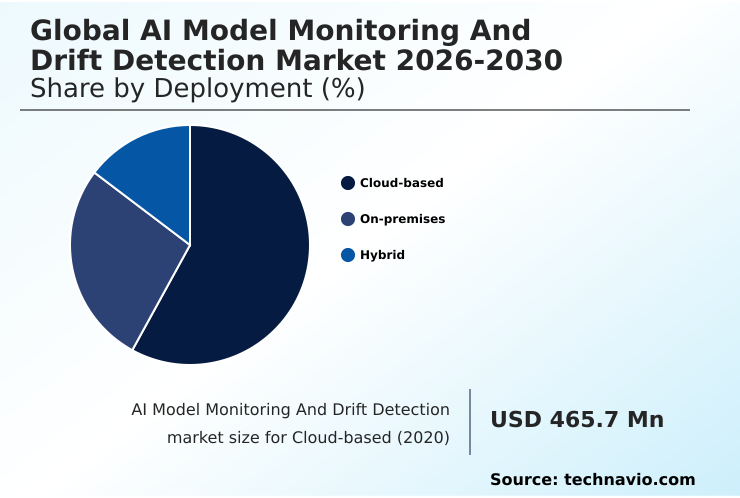
The Cloud-based segment was valued at USD 825.1 million in 2024 and showed a gradual increase during the forecast period.

Request Free Sample

Regional Analysis

North America is estimated to contribute 37.8% to the growth of the global market during the forecast period.Technavio’s analysts have elaborately explained the regional trends and drivers that shape the market during the forecast period.

See How AI Model Monitoring And Drift Detection Market Demand is Rising in North America Request Free Sample

Regional dynamics are shaped by regulatory and industrial priorities. North America leads in adopting comprehensive ML model observability platforms, driven by a high density of tech firms and a focus on model risk management.

In this region, 80% of financial institutions have implemented some form of bias and fairness monitoring. Europe's market is defined by stringent data privacy laws, prioritizing decentralized drift detection and AI model governance to ensure compliance.

APAC is the fastest-growing region, with a focus on edge AI monitoring for manufacturing and smart city applications, where real-time model monitoring has reduced operational failures by 20%.

This geographic differentiation influences strategies for production model validation, AI system resilience and statistical process control for AI.

Market Dynamics

Our researchers analyzed the data with 2025 as the base year, along with the key drivers, trends, and challenges. A holistic analysis of drivers will help companies refine their marketing strategies to gain a competitive advantage.

  • The increasing complexity of AI systems necessitates advanced strategies for maintaining model integrity in production. Organizations are actively seeking solutions for monitoring for generative AI hallucinations to ensure the outputs of large language models are reliable and factually grounded. A core operational requirement is detecting data drift in real-time, as shifts in input data can silently degrade model performance.
  • The question of how to monitor LLM performance is a top priority, leading to the development of specialized metrics beyond simple accuracy. For regulated industries, conducting an AI model fairness and bias audit is no longer a best practice but a mandatory compliance step.
  • This has spurred the adoption of enterprise-grade ML model observability platforms that provide a unified view of model health. A critical challenge is managing model decay in production environments, which is addressed through automated retraining pipelines for AI models.
  • For instance, in financial services, concept drift detection in financial services is crucial, where real-time monitoring of market sentiment models provides a distinct advantage over competitors relying on quarterly reviews. Implementing real-time monitoring of AI on edge devices is also vital for IoT applications.
  • Ultimately, the ability to ensure AI model compliance with regulations through technologies like semantic drift analysis for unstructured text and transparent root cause analysis for model performance issues separates market leaders from laggards. Federated learning model monitoring strategies are also emerging to address data privacy.
  • The focus is now on securing ML pipelines against prompt injection, implementing AI guardrails for large language models, and monitoring vector databases for RAG systems. With tools for explainable AI and transparency, continuous validation of machine learning models, high-dimensional data drift detection techniques, and adherence to AI reliability engineering best practices, enterprises can build trustworthy and resilient AI ecosystems.

What are the key market drivers leading to the rise in the adoption of AI Model Monitoring And Drift Detection Industry?

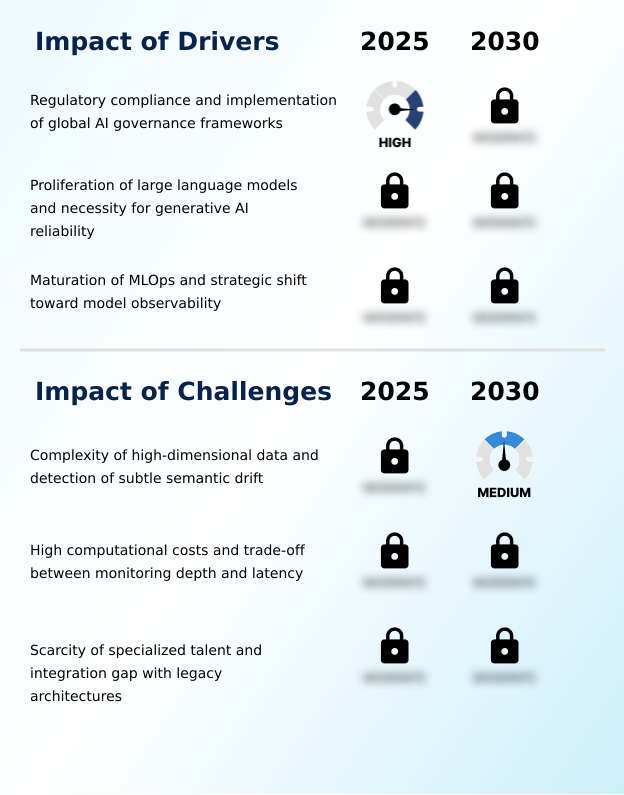
  • The demand for AI model monitoring and drift detection is primarily driven by the need for regulatory compliance and the implementation of global AI governance frameworks.

  • The maturation of MLOps observability and a strategic shift toward model portfolio management are primary drivers. Organizations now prioritize production AI monitoring to manage model decay detection and prediction drift analysis, leading to a 30% improvement in ML operational efficiency.
  • The proliferation of large language models necessitates observability for LLMs and robust generative AI safety protocols, including LLM hallucination detection and prompt injection detection. Furthermore, stringent AI model governance frameworks mandate algorithmic accountability, with non-compliant firms facing penalties.
  • This has made tools for explainable AI monitoring and automated AI compliance reporting essential, with adoption rates increasing by over 50% in regulated industries.

What are the market trends shaping the AI Model Monitoring And Drift Detection Industry?

  • An emerging market trend is the adoption of federated learning monitoring. This involves implementing decentralized drift detection mechanisms to maintain data privacy and data sovereignty.

  • A significant trend is the shift toward federated learning monitoring to enable decentralized drift detection in privacy-sensitive sectors, improving data security without compromising model health tracking. Concurrently, hardware-aware drift analysis for edge AI monitoring is gaining traction, with deployments showing up to a 40% reduction in response latency for real-time anomaly detection.
  • The evolution toward deep semantic drift detection allows for nuanced unstructured data monitoring, a capability that has improved issue identification accuracy by 20% in complex industrial verticals. These advancements in ML model lifecycle management are supported by lightweight monitoring agents and self-healing AI mechanisms, which are critical for maintaining AI system resilience, output variance tracking and trust.

What challenges does the AI Model Monitoring And Drift Detection Industry face during its growth?

  • A key challenge affecting industry growth is the complexity of identifying subtle semantic drift within high-dimensional and unstructured data sets.

  • A significant challenge is high-dimensional data analysis for multi-modal drift detection, where legacy statistical tests produce a false positive rate as high as 15%. The computational overhead of continuous feature drift monitoring and root cause analysis AI presents a trade-off, as comprehensive drift alert systems can increase system latency by up to 10%.
  • Additionally, a scarcity of talent in AI reliability engineering impedes the proper implementation of automated model retraining pipelines. This skills gap is compounded by the difficulty of integrating modern ML workflow automation tools with legacy architectures, a process that can double implementation timelines for many enterprises.

Exclusive Technavio Analysis on Customer Landscape

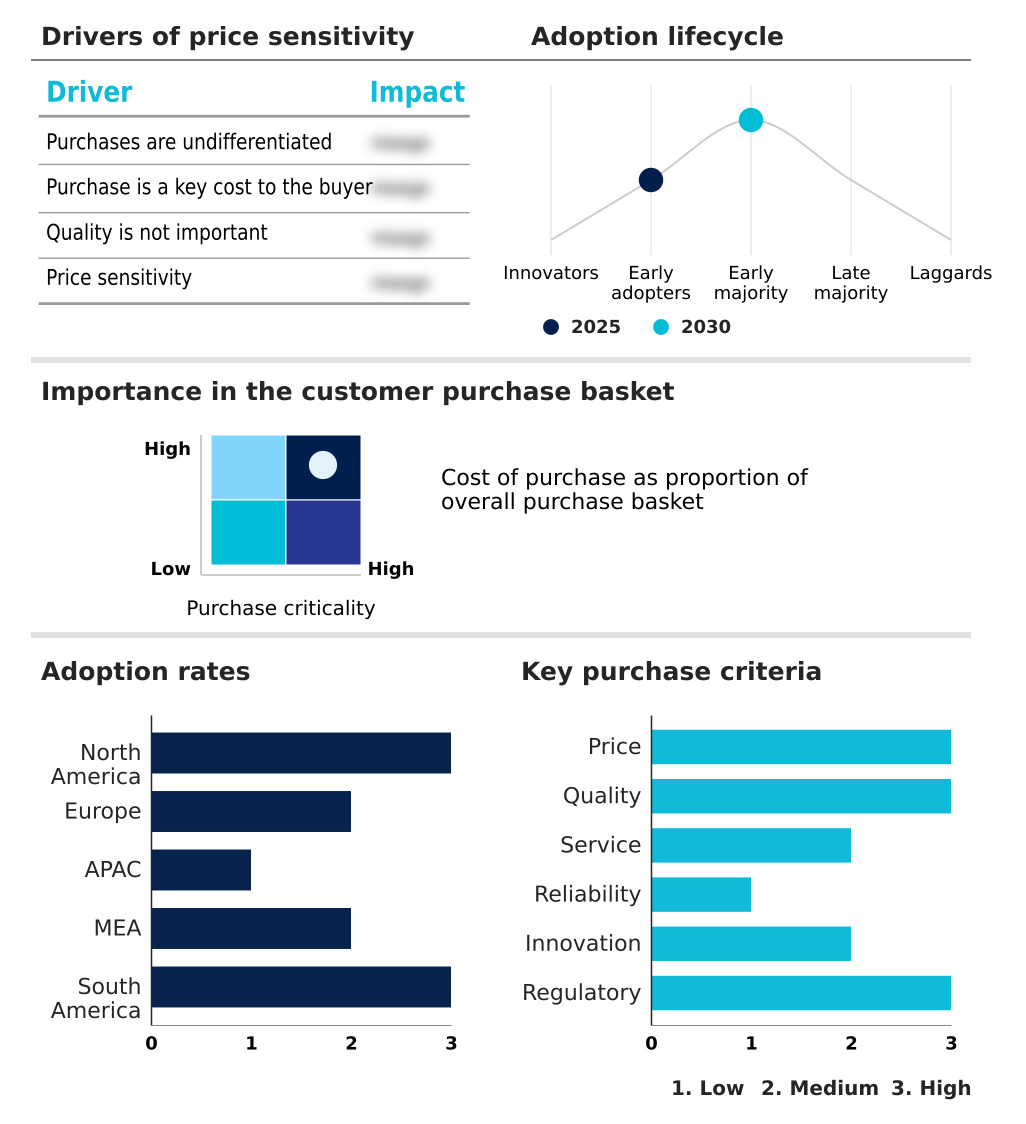
The ai model monitoring and drift detection market forecasting report includes the adoption lifecycle of the market, covering from the innovator’s stage to the laggard’s stage. It focuses on adoption rates in different regions based on penetration. Furthermore, the ai model monitoring and drift detection market report also includes key purchase criteria and drivers of price sensitivity to help companies evaluate and develop their market growth analysis strategies.

Customer Landscape of AI Model Monitoring And Drift Detection Industry

Competitive Landscape

Companies are implementing various strategies, such as strategic alliances, ai model monitoring and drift detection market forecast, partnerships, mergers and acquisitions, geographical expansion, and product/service launches, to enhance their presence in the industry.

Amazon.com Inc. - Key solutions enable automated concept and data drift detection, ensuring the health and performance of machine learning models in production environments.

The industry research and growth report includes detailed analyses of the competitive landscape of the market and information about key companies, including:

  • Amazon.com Inc.
  • Aporia Technologies
  • ARTHUR
  • Censius
  • Cisco Systems Inc.
  • Comet ML Inc.
  • Datadog Inc.
  • DataRobot Inc.
  • Deepchecks AI
  • Domino Data Lab Inc.
  • Dynatrace Inc.
  • Evidently AI
  • Fiddler AI
  • Google LLC
  • H2O.ai Inc.
  • New Relic Inc.
  • Seldon Technologies
  • Snowflake Inc.
  • Superwise
  • WhyLabs, Inc.

Qualitative and quantitative analysis of companies has been conducted to help clients understand the wider business environment as well as the strengths and weaknesses of key industry players. Data is qualitatively analyzed to categorize companies as pure play, category-focused, industry-focused, and diversified; it is quantitatively analyzed to categorize companies as dominant, leading, strong, tentative, and weak.

Recent Development and News in Ai model monitoring and drift detection market

  • In March 2025, the United States Department of Commerce established the National AI Monitoring Bureau to oversee the safety and reliability of models utilized in critical infrastructure.
  • In February 2025, Snowflake Inc. expanded its platform to include automated drift detection for generative models, which allows organizations to maintain data integrity within their cloud environment.
  • In April 2025, the Mexican Association of the Digital Industry announced a new certification for algorithmic transparency that includes mandatory drift detection for industrial applications.
  • In March 2025, Cisco Systems Inc. integrated monitoring tools from recent acquisitions into a unified observability framework to better serve networking and security operations.

Dive into Technavio’s robust research methodology, blending expert interviews, extensive data synthesis, and validated models for unparalleled AI Model Monitoring And Drift Detection Market insights. See full methodology.

Market Scope
Page number 289
Base year 2025
Historic period 2020-2024
Forecast period 2026-2030
Growth momentum & CAGR Accelerate at a CAGR of 22.6%
Market growth 2026-2030 USD 2945.9 million
Market structure Fragmented
YoY growth 2025-2026(%) 21.1%
Key countries US, Canada, Mexico, Germany, UK, France, The Netherlands, Italy, Spain, China, India, Japan, South Korea, Australia, Indonesia, Saudi Arabia, UAE, South Africa, Israel, Turkey, Brazil, Argentina and Colombia
Competitive landscape Leading Companies, Market Positioning of Companies, Competitive Strategies, and Industry Risks

Request Free Sample

Research Analyst Overview

  • The AI model monitoring and drift detection market has become a cornerstone of modern enterprise strategy, moving beyond technical oversight to become a function of corporate governance. The core capability revolves around data drift detection and concept drift detection, which are fundamental for model performance monitoring.
  • As organizations scale their use of artificial intelligence, MLOps observability and robust production AI monitoring are no longer optional. This shift is particularly evident in the growing need for generative AI reliability, with specialized tools for unstructured data monitoring and LLM hallucination detection.
  • Boardroom decisions are now directly influenced by the need for AI model governance and algorithmic accountability, particularly in regulated sectors. For instance, implementing comprehensive bias and fairness monitoring and explainable AI monitoring has been shown to reduce compliance-related fines by over 60%. This makes investments in real-time model monitoring, automated model retraining, and semantic drift detection a strategic imperative.
  • Platforms that offer federated learning monitoring, edge AI monitoring, and AI reliability engineering frameworks provide a competitive advantage, ensuring model health tracking and effective AI guardrails implementation across the entire ML pipeline validation lifecycle. The vector database monitoring and ML model auditing has also gained prominence in recent times.

What are the Key Data Covered in this AI Model Monitoring And Drift Detection Market Research and Growth Report?

  • What is the expected growth of the AI Model Monitoring And Drift Detection Market between 2026 and 2030?

    • USD 2.95 billion, at a CAGR of 22.6%

  • What segmentation does the market report cover?

    • The report is segmented by Deployment (Cloud-based, On-premises, and Hybrid), Type (Model performance monitoring, Data drift detection, Concept drift detection, and Bias and fairness monitoring), End-user (Large enterprises, and SMEs) and Geography (North America, Europe, APAC, Middle East and Africa, South America)

  • Which regions are analyzed in the report?

    • North America, Europe, APAC, Middle East and Africa and South America

  • What are the key growth drivers and market challenges?

    • Regulatory compliance and implementation of global AI governance frameworks, Complexity of high-dimensional data and detection of subtle semantic drift

  • Who are the major players in the AI Model Monitoring And Drift Detection Market?

    • Amazon.com Inc., Aporia Technologies, ARTHUR, Censius, Cisco Systems Inc., Comet ML Inc., Datadog Inc., DataRobot Inc., Deepchecks AI, Domino Data Lab Inc., Dynatrace Inc., Evidently AI, Fiddler AI, Google LLC, H2O.ai Inc., New Relic Inc., Seldon Technologies, Snowflake Inc., Superwise and WhyLabs, Inc.

Market Research Insights

  • The market is characterized by a shift toward proactive model risk management and comprehensive ML model lifecycle management. Enterprises are adopting centralized monitoring dashboard solutions to gain unified oversight, which has been shown to reduce troubleshooting time by over 40%.
  • The demand for generative AI safety and observability for LLMs is expanding the scope of production model validation, with platforms now offering automated drift remediation that improves AI system resilience by 30%.
  • As part of this evolution, the focus on ML operational efficiency and streamlined AI compliance reporting has become a key differentiator, enabling organizations to scale their AI initiatives confidently while maintaining governance and control over their entire model portfolio management strategy.

We can help! Our analysts can customize this ai model monitoring and drift detection market research report to meet your requirements.

Get in touch

1. Executive Summary

1.1 Market overview

Executive Summary - Chart on Market Overview
Executive Summary - Data Table on Market Overview
Executive Summary - Chart on Global Market Characteristics
Executive Summary - Chart on Market by Geography
Executive Summary - Chart on Market Segmentation by Deployment
Executive Summary - Chart on Market Segmentation by Type
Executive Summary - Chart on Market Segmentation by End-user
Executive Summary - Chart on Incremental Growth
Executive Summary - Data Table on Incremental Growth
Executive Summary - Chart on Company Market Positioning

2. Technavio Analysis

2.1 Analysis of price sensitivity, lifecycle, customer purchase basket, adoption rates, and purchase criteria

2.2 Criticality of inputs and Factors of differentiation

Chart on Overview on criticality of inputs and factors of differentiation

2.3 Factors of disruption

Chart on Overview on factors of disruption

2.4 Impact of drivers and challenges

Chart on Impact of drivers and challenges in 2025 and 2030

3. Market Landscape

3.1 Market ecosystem

Chart on Parent Market
Data Table on - Parent Market

3.2 Market characteristics

Chart on Market characteristics analysis

3.3 Value chain analysis

Chart on Value chain analysis

4. Market Sizing

4.1 Market definition

Data Table on Offerings of companies included in the market definition

4.2 Market segment analysis

Market segments

4.3 Market size 2025

4.4 Market outlook: Forecast for 2025-2030

Chart on Global - Market size and forecast 2025-2030 ($ million)
Data Table on Global - Market size and forecast 2025-2030 ($ million)
Chart on Global Market: Year-over-year growth 2025-2030 (%)
Data Table on Global Market: Year-over-year growth 2025-2030 (%)

5. Historic Market Size

5.1 Global AI Model Monitoring And Drift Detection Market 2020 - 2024

Historic Market Size - Data Table on Global AI Model Monitoring And Drift Detection Market 2020 - 2024 ($ million)

5.2 Deployment segment analysis 2020 - 2024

Historic Market Size - Deployment Segment 2020 - 2024 ($ million)

5.3 Type segment analysis 2020 - 2024

Historic Market Size - Type Segment 2020 - 2024 ($ million)

5.4 End-user segment analysis 2020 - 2024

Historic Market Size - End-user Segment 2020 - 2024 ($ million)

5.5 Geography segment analysis 2020 - 2024

Historic Market Size - Geography Segment 2020 - 2024 ($ million)

5.6 Country segment analysis 2020 - 2024

Historic Market Size - Country Segment 2020 - 2024 ($ million)

6. Qualitative Analysis

6.1 Impact of AI on Global AI Model Monitoring and Drift Detection Market

7. Five Forces Analysis

7.1 Five forces summary

Five forces analysis - Comparison between 2025 and 2030

7.2 Bargaining power of buyers

Bargaining power of buyers - Impact of key factors 2025 and 2030

7.3 Bargaining power of suppliers

Bargaining power of suppliers - Impact of key factors in 2025 and 2030

7.4 Threat of new entrants

Threat of new entrants - Impact of key factors in 2025 and 2030

7.5 Threat of substitutes

Threat of substitutes - Impact of key factors in 2025 and 2030

7.6 Threat of rivalry

Threat of rivalry - Impact of key factors in 2025 and 2030

7.7 Market condition

Chart on Market condition - Five forces 2025 and 2030

8. Market Segmentation by Deployment

8.1 Market segments

Chart on Deployment - Market share 2025-2030 (%)
Data Table on Deployment - Market share 2025-2030 (%)

8.2 Comparison by Deployment

Chart on Comparison by Deployment
Data Table on Comparison by Deployment

8.3 Cloud-based - Market size and forecast 2025-2030

Chart on Cloud-based - Market size and forecast 2025-2030 ($ million)
Data Table on Cloud-based - Market size and forecast 2025-2030 ($ million)
Chart on Cloud-based - Year-over-year growth 2025-2030 (%)
Data Table on Cloud-based - Year-over-year growth 2025-2030 (%)

8.4 On-premises - Market size and forecast 2025-2030

Chart on On-premises - Market size and forecast 2025-2030 ($ million)
Data Table on On-premises - Market size and forecast 2025-2030 ($ million)
Chart on On-premises - Year-over-year growth 2025-2030 (%)
Data Table on On-premises - Year-over-year growth 2025-2030 (%)

8.5 Hybrid - Market size and forecast 2025-2030

Chart on Hybrid - Market size and forecast 2025-2030 ($ million)
Data Table on Hybrid - Market size and forecast 2025-2030 ($ million)
Chart on Hybrid - Year-over-year growth 2025-2030 (%)
Data Table on Hybrid - Year-over-year growth 2025-2030 (%)

8.6 Market opportunity by Deployment

Market opportunity by Deployment ($ million)
Data Table on Market opportunity by Deployment ($ million)

9. Market Segmentation by Type

9.1 Market segments

Chart on Type - Market share 2025-2030 (%)
Data Table on Type - Market share 2025-2030 (%)

9.2 Comparison by Type

Chart on Comparison by Type
Data Table on Comparison by Type

9.3 Model performance monitoring - Market size and forecast 2025-2030

Chart on Model performance monitoring - Market size and forecast 2025-2030 ($ million)
Data Table on Model performance monitoring - Market size and forecast 2025-2030 ($ million)
Chart on Model performance monitoring - Year-over-year growth 2025-2030 (%)
Data Table on Model performance monitoring - Year-over-year growth 2025-2030 (%)

9.4 Data drift detection - Market size and forecast 2025-2030

Chart on Data drift detection - Market size and forecast 2025-2030 ($ million)
Data Table on Data drift detection - Market size and forecast 2025-2030 ($ million)
Chart on Data drift detection - Year-over-year growth 2025-2030 (%)
Data Table on Data drift detection - Year-over-year growth 2025-2030 (%)

9.5 Concept drift detection - Market size and forecast 2025-2030

Chart on Concept drift detection - Market size and forecast 2025-2030 ($ million)
Data Table on Concept drift detection - Market size and forecast 2025-2030 ($ million)
Chart on Concept drift detection - Year-over-year growth 2025-2030 (%)
Data Table on Concept drift detection - Year-over-year growth 2025-2030 (%)

9.6 Bias and fairness monitoring - Market size and forecast 2025-2030

Chart on Bias and fairness monitoring - Market size and forecast 2025-2030 ($ million)
Data Table on Bias and fairness monitoring - Market size and forecast 2025-2030 ($ million)
Chart on Bias and fairness monitoring - Year-over-year growth 2025-2030 (%)
Data Table on Bias and fairness monitoring - Year-over-year growth 2025-2030 (%)

9.7 Market opportunity by Type

Market opportunity by Type ($ million)
Data Table on Market opportunity by Type ($ million)

10. Market Segmentation by End-user

10.1 Market segments

Chart on End-user - Market share 2025-2030 (%)
Data Table on End-user - Market share 2025-2030 (%)

10.2 Comparison by End-user

Chart on Comparison by End-user
Data Table on Comparison by End-user

10.3 Large enterprises - Market size and forecast 2025-2030

Chart on Large enterprises - Market size and forecast 2025-2030 ($ million)
Data Table on Large enterprises - Market size and forecast 2025-2030 ($ million)
Chart on Large enterprises - Year-over-year growth 2025-2030 (%)
Data Table on Large enterprises - Year-over-year growth 2025-2030 (%)

10.4 SMEs - Market size and forecast 2025-2030

Chart on SMEs - Market size and forecast 2025-2030 ($ million)
Data Table on SMEs - Market size and forecast 2025-2030 ($ million)
Chart on SMEs - Year-over-year growth 2025-2030 (%)
Data Table on SMEs - Year-over-year growth 2025-2030 (%)

10.5 Market opportunity by End-user

Market opportunity by End-user ($ million)
Data Table on Market opportunity by End-user ($ million)

11. Customer Landscape

11.1 Customer landscape overview

Analysis of price sensitivity, lifecycle, customer purchase basket, adoption rates, and purchase criteria

12. Geographic Landscape

12.1 Geographic segmentation

Chart on Market share by geography 2025-2030 (%)
Data Table on Market share by geography 2025-2030 (%)

12.2 Geographic comparison

Chart on Geographic comparison
Data Table on Geographic comparison

12.3 North America - Market size and forecast 2025-2030

Chart on North America - Market size and forecast 2025-2030 ($ million)
Data Table on North America - Market size and forecast 2025-2030 ($ million)
Chart on North America - Year-over-year growth 2025-2030 (%)
Data Table on North America - Year-over-year growth 2025-2030 (%)
Chart on Regional Comparison - North America
Data Table on Regional Comparison - North America

12.3.1 US - Market size and forecast 2025-2030

Chart on US - Market size and forecast 2025-2030 ($ million)
Data Table on US - Market size and forecast 2025-2030 ($ million)
Chart on US - Year-over-year growth 2025-2030 (%)
Data Table on US - Year-over-year growth 2025-2030 (%)

12.3.2 Canada - Market size and forecast 2025-2030

Chart on Canada - Market size and forecast 2025-2030 ($ million)
Data Table on Canada - Market size and forecast 2025-2030 ($ million)
Chart on Canada - Year-over-year growth 2025-2030 (%)
Data Table on Canada - Year-over-year growth 2025-2030 (%)

12.3.3 Mexico - Market size and forecast 2025-2030

Chart on Mexico - Market size and forecast 2025-2030 ($ million)
Data Table on Mexico - Market size and forecast 2025-2030 ($ million)
Chart on Mexico - Year-over-year growth 2025-2030 (%)
Data Table on Mexico - Year-over-year growth 2025-2030 (%)

12.4 Europe - Market size and forecast 2025-2030

Chart on Europe - Market size and forecast 2025-2030 ($ million)
Data Table on Europe - Market size and forecast 2025-2030 ($ million)
Chart on Europe - Year-over-year growth 2025-2030 (%)
Data Table on Europe - Year-over-year growth 2025-2030 (%)
Chart on Regional Comparison - Europe
Data Table on Regional Comparison - Europe

12.4.1 Germany - Market size and forecast 2025-2030

Chart on Germany - Market size and forecast 2025-2030 ($ million)
Data Table on Germany - Market size and forecast 2025-2030 ($ million)
Chart on Germany - Year-over-year growth 2025-2030 (%)
Data Table on Germany - Year-over-year growth 2025-2030 (%)

12.4.2 UK - Market size and forecast 2025-2030

Chart on UK - Market size and forecast 2025-2030 ($ million)
Data Table on UK - Market size and forecast 2025-2030 ($ million)
Chart on UK - Year-over-year growth 2025-2030 (%)
Data Table on UK - Year-over-year growth 2025-2030 (%)

12.4.3 France - Market size and forecast 2025-2030

Chart on France - Market size and forecast 2025-2030 ($ million)
Data Table on France - Market size and forecast 2025-2030 ($ million)
Chart on France - Year-over-year growth 2025-2030 (%)
Data Table on France - Year-over-year growth 2025-2030 (%)

12.4.4 The Netherlands - Market size and forecast 2025-2030

Chart on The Netherlands - Market size and forecast 2025-2030 ($ million)
Data Table on The Netherlands - Market size and forecast 2025-2030 ($ million)
Chart on The Netherlands - Year-over-year growth 2025-2030 (%)
Data Table on The Netherlands - Year-over-year growth 2025-2030 (%)

12.4.5 Italy - Market size and forecast 2025-2030

Chart on Italy - Market size and forecast 2025-2030 ($ million)
Data Table on Italy - Market size and forecast 2025-2030 ($ million)
Chart on Italy - Year-over-year growth 2025-2030 (%)
Data Table on Italy - Year-over-year growth 2025-2030 (%)

12.4.6 Spain - Market size and forecast 2025-2030

Chart on Spain - Market size and forecast 2025-2030 ($ million)
Data Table on Spain - Market size and forecast 2025-2030 ($ million)
Chart on Spain - Year-over-year growth 2025-2030 (%)
Data Table on Spain - Year-over-year growth 2025-2030 (%)

12.5 APAC - Market size and forecast 2025-2030

Chart on APAC - Market size and forecast 2025-2030 ($ million)
Data Table on APAC - Market size and forecast 2025-2030 ($ million)
Chart on APAC - Year-over-year growth 2025-2030 (%)
Data Table on APAC - Year-over-year growth 2025-2030 (%)
Chart on Regional Comparison - APAC
Data Table on Regional Comparison - APAC

12.5.1 China - Market size and forecast 2025-2030

Chart on China - Market size and forecast 2025-2030 ($ million)
Data Table on China - Market size and forecast 2025-2030 ($ million)
Chart on China - Year-over-year growth 2025-2030 (%)
Data Table on China - Year-over-year growth 2025-2030 (%)

12.5.2 India - Market size and forecast 2025-2030

Chart on India - Market size and forecast 2025-2030 ($ million)
Data Table on India - Market size and forecast 2025-2030 ($ million)
Chart on India - Year-over-year growth 2025-2030 (%)
Data Table on India - Year-over-year growth 2025-2030 (%)

12.5.3 Japan - Market size and forecast 2025-2030

Chart on Japan - Market size and forecast 2025-2030 ($ million)
Data Table on Japan - Market size and forecast 2025-2030 ($ million)
Chart on Japan - Year-over-year growth 2025-2030 (%)
Data Table on Japan - Year-over-year growth 2025-2030 (%)

12.5.4 South Korea - Market size and forecast 2025-2030

Chart on South Korea - Market size and forecast 2025-2030 ($ million)
Data Table on South Korea - Market size and forecast 2025-2030 ($ million)
Chart on South Korea - Year-over-year growth 2025-2030 (%)
Data Table on South Korea - Year-over-year growth 2025-2030 (%)

12.5.5 Australia - Market size and forecast 2025-2030

Chart on Australia - Market size and forecast 2025-2030 ($ million)
Data Table on Australia - Market size and forecast 2025-2030 ($ million)
Chart on Australia - Year-over-year growth 2025-2030 (%)
Data Table on Australia - Year-over-year growth 2025-2030 (%)

12.5.6 Indonesia - Market size and forecast 2025-2030

Chart on Indonesia - Market size and forecast 2025-2030 ($ million)
Data Table on Indonesia - Market size and forecast 2025-2030 ($ million)
Chart on Indonesia - Year-over-year growth 2025-2030 (%)
Data Table on Indonesia - Year-over-year growth 2025-2030 (%)

12.6 Middle East and Africa - Market size and forecast 2025-2030

Chart on Middle East and Africa - Market size and forecast 2025-2030 ($ million)
Data Table on Middle East and Africa - Market size and forecast 2025-2030 ($ million)
Chart on Middle East and Africa - Year-over-year growth 2025-2030 (%)
Data Table on Middle East and Africa - Year-over-year growth 2025-2030 (%)
Chart on Regional Comparison - Middle East and Africa
Data Table on Regional Comparison - Middle East and Africa

12.6.1 Saudi Arabia - Market size and forecast 2025-2030

Chart on Saudi Arabia - Market size and forecast 2025-2030 ($ million)
Data Table on Saudi Arabia - Market size and forecast 2025-2030 ($ million)
Chart on Saudi Arabia - Year-over-year growth 2025-2030 (%)
Data Table on Saudi Arabia - Year-over-year growth 2025-2030 (%)

12.6.2 UAE - Market size and forecast 2025-2030

Chart on UAE - Market size and forecast 2025-2030 ($ million)
Data Table on UAE - Market size and forecast 2025-2030 ($ million)
Chart on UAE - Year-over-year growth 2025-2030 (%)
Data Table on UAE - Year-over-year growth 2025-2030 (%)

12.6.3 South Africa - Market size and forecast 2025-2030

Chart on South Africa - Market size and forecast 2025-2030 ($ million)
Data Table on South Africa - Market size and forecast 2025-2030 ($ million)
Chart on South Africa - Year-over-year growth 2025-2030 (%)
Data Table on South Africa - Year-over-year growth 2025-2030 (%)

12.6.4 Israel - Market size and forecast 2025-2030

Chart on Israel - Market size and forecast 2025-2030 ($ million)
Data Table on Israel - Market size and forecast 2025-2030 ($ million)
Chart on Israel - Year-over-year growth 2025-2030 (%)
Data Table on Israel - Year-over-year growth 2025-2030 (%)

12.6.5 Turkey - Market size and forecast 2025-2030

Chart on Turkey - Market size and forecast 2025-2030 ($ million)
Data Table on Turkey - Market size and forecast 2025-2030 ($ million)
Chart on Turkey - Year-over-year growth 2025-2030 (%)
Data Table on Turkey - Year-over-year growth 2025-2030 (%)

12.7 South America - Market size and forecast 2025-2030

Chart on South America - Market size and forecast 2025-2030 ($ million)
Data Table on South America - Market size and forecast 2025-2030 ($ million)
Chart on South America - Year-over-year growth 2025-2030 (%)
Data Table on South America - Year-over-year growth 2025-2030 (%)
Chart on Regional Comparison - South America
Data Table on Regional Comparison - South America

12.7.1 Brazil - Market size and forecast 2025-2030

Chart on Brazil - Market size and forecast 2025-2030 ($ million)
Data Table on Brazil - Market size and forecast 2025-2030 ($ million)
Chart on Brazil - Year-over-year growth 2025-2030 (%)
Data Table on Brazil - Year-over-year growth 2025-2030 (%)

12.7.2 Argentina - Market size and forecast 2025-2030

Chart on Argentina - Market size and forecast 2025-2030 ($ million)
Data Table on Argentina - Market size and forecast 2025-2030 ($ million)
Chart on Argentina - Year-over-year growth 2025-2030 (%)
Data Table on Argentina - Year-over-year growth 2025-2030 (%)

12.7.3 Colombia - Market size and forecast 2025-2030

Chart on Colombia - Market size and forecast 2025-2030 ($ million)
Data Table on Colombia - Market size and forecast 2025-2030 ($ million)
Chart on Colombia - Year-over-year growth 2025-2030 (%)
Data Table on Colombia - Year-over-year growth 2025-2030 (%)

12.8 Market opportunity by geography

Market opportunity by geography ($ million)
Data Tables on Market opportunity by geography ($ million)

13. Drivers, Challenges, and Opportunity

13.1 Market drivers

Regulatory compliance and implementation of global AI governance frameworks
Proliferation of large language models and necessity for generative AI reliability
Maturation of MLOps and strategic shift toward model observability

13.2 Market challenges

Complexity of high-dimensional data and detection of subtle semantic drift
High computational costs and trade-off between monitoring depth and latency
Scarcity of specialized talent and integration gap with legacy architectures

13.3 Impact of drivers and challenges

Impact of drivers and challenges in 2025 and 2030

13.4 Market opportunities

Federated learning monitoring and decentralized drift detection mechanisms
Hardware-aware drift analysis for edge intelligence and IoT ecosystems
Advanced semantic drift detection for high-stakes industrial verticals

14. Competitive Landscape

14.1 Overview

14.2

Overview on criticality of inputs and factors of differentiation

14.3 Landscape disruption

Overview on factors of disruption

14.4 Industry risks

Impact of key risks on business

15. Competitive Analysis

15.1 Companies profiled

Companies covered

15.2 Company ranking index

15.3 Market positioning of companies

Matrix on companies position and classification

15.4 Amazon.com Inc.

Amazon.com Inc. - Overview
Amazon.com Inc. - Business segments
Amazon.com Inc. - Key news
Amazon.com Inc. - Key offerings
Amazon.com Inc. - Segment focus
SWOT

15.5 Aporia Technologies

Aporia Technologies - Overview
Aporia Technologies - Product / Service
Aporia Technologies - Key offerings
SWOT

15.6 ARTHUR

ARTHUR - Overview
ARTHUR - Product / Service
ARTHUR - Key offerings
SWOT

15.7 Datadog Inc.

Datadog Inc. - Overview
Datadog Inc. - Product / Service
Datadog Inc. - Key offerings
SWOT

15.8 DataRobot Inc.

DataRobot Inc. - Overview
DataRobot Inc. - Product / Service
DataRobot Inc. - Key offerings
SWOT

15.9 Deepchecks AI

Deepchecks AI - Overview
Deepchecks AI - Product / Service
Deepchecks AI - Key offerings
SWOT

15.10 Domino Data Lab Inc.

Domino Data Lab Inc. - Overview
Domino Data Lab Inc. - Product / Service
Domino Data Lab Inc. - Key offerings
SWOT

15.11 Dynatrace Inc.

Dynatrace Inc. - Overview
Dynatrace Inc. - Product / Service
Dynatrace Inc. - Key news
Dynatrace Inc. - Key offerings
SWOT

15.12 Evidently AI

Evidently AI - Overview
Evidently AI - Product / Service
Evidently AI - Key offerings
SWOT

15.13 Fiddler AI

Fiddler AI - Overview
Fiddler AI - Product / Service
Fiddler AI - Key offerings
SWOT

15.14 Google LLC

Google LLC - Overview
Google LLC - Product / Service
Google LLC - Key offerings
SWOT

15.15 New Relic Inc.

New Relic Inc. - Overview
New Relic Inc. - Product / Service
New Relic Inc. - Key offerings
SWOT

15.16 Snowflake Inc.

Snowflake Inc. - Overview
Snowflake Inc. - Product / Service
Snowflake Inc. - Key offerings
SWOT

15.17 Superwise

Superwise - Overview
Superwise - Product / Service
Superwise - Key offerings
SWOT

15.18 WhyLabs, Inc.

WhyLabs, Inc. - Overview
WhyLabs, Inc. - Product / Service
WhyLabs, Inc. - Key offerings
SWOT

16. Appendix

16.1 Scope of the report

Market definition
Objectives
Notes and caveats

16.2 Inclusions and exclusions checklist

Inclusions checklist
Exclusions checklist

16.3 Currency conversion rates for US$

16.4 Research methodology

16.5 Data procurement

Information sources

16.6 Data validation

16.7 Validation techniques employed for market sizing

16.8 Data synthesis

16.9 360 degree market analysis

16.10 List of abbreviations

Research Methodology

Technavio presents a detailed picture of the market by way of study, synthesis, and summation of data from multiple sources. The analysts have presented the various facets of the market with a particular focus on identifying the key industry influencers. The data thus presented is comprehensive, reliable, and the result of extensive research, both primary and secondary.

INFORMATION SOURCES

Primary sources

  • Manufacturers and suppliers
  • Channel partners
  • Industry experts
  • Strategic decision makers

Secondary sources

  • Industry journals and periodicals
  • Government data
  • Financial reports of key industry players
  • Historical data
  • Press releases

DATA ANALYSIS

Data Synthesis

  • Collation of data
  • Estimation of key figures
  • Analysis of derived insights

Data Validation

  • Triangulation with data models
  • Reference against proprietary databases
  • Corroboration with industry experts

REPORT WRITING

Qualitative

  • Market drivers
  • Market challenges
  • Market trends
  • Five forces analysis

Quantitative

  • Market size and forecast
  • Market segmentation
  • Geographical insights
  • Competitive landscape

Interested in this report?

Get your sample now to see our research methodology and insights!

Download Now

Frequently Asked Questions

AI Model Monitoring And Drift Detection market growth will increase by USD 2945.9 million during 2026-2030.

The AI Model Monitoring And Drift Detection market is expected to grow at a CAGR of 22.6% during 2026-2030.

AI Model Monitoring And Drift Detection market is segmented by Deployment (Cloud-based, On-premises, Hybrid) Type (Model performance monitoring, Data drift detection, Concept drift detection, Bias and fairness monitoring) End-user (Large enterprises, SMEs)

Amazon.com Inc., Aporia Technologies, ARTHUR, Censius, Cisco Systems Inc., Comet ML Inc., Datadog Inc., DataRobot Inc., Deepchecks AI, Domino Data Lab Inc., Dynatrace Inc., Evidently AI, Fiddler AI, Google LLC, H2O.ai Inc., New Relic Inc., Seldon Technologies, Snowflake Inc., Superwise, WhyLabs, Inc. are a few of the key vendors in the AI Model Monitoring And Drift Detection market.

North America will register the highest growth rate of 37.8% among the other regions. Therefore, the AI Model Monitoring And Drift Detection market in North America is expected to garner significant business opportunities for the vendors during the forecast period.

US, Canada, Mexico, Germany, UK, France, The Netherlands, Italy, Spain, China, India, Japan, South Korea, Australia, Indonesia, Saudi Arabia, UAE, South Africa, Israel, Turkey, Brazil, Argentina, Colombia

  • Regulatory compliance and implementation of global AI governance frameworks is the driving factor this market.

The AI Model Monitoring And Drift Detection market vendors should focus on grabbing business opportunities from the Deployment segment as it accounted for the largest market share in the base year.
RIA - Research AI Assistant
Ask RIA