AI Model Optimization Tools Market Analysis, Size, and Forecast 2026-2030: North America (US, Canada, and Mexico), Europe (Germany, UK, and France), APAC (China, Japan, and India), Middle East and Africa (Saudi Arabia, UAE, and Israel), South America (Brazil, Argentina, and Chile), and Rest of World (ROW)

AI Model Optimization Tools Market Analysis, Size, and Forecast 2026-2030:
North America (US, Canada, and Mexico), Europe (Germany, UK, and France), APAC (China, Japan, and India), Middle East and Africa (Saudi Arabia, UAE, and Israel), South America (Brazil, Argentina, and Chile), and Rest of World (ROW)

Published: May 2026 318 Pages SKU: IRTNTR81373

Market Overview at a Glance

$1.98 B
Market Opportunity
22.1%
CAGR 2025 - 2030
40.6%
North America Growth
$501.5 Mn
Cloud based segment 2024

Ai Model Optimization Tools Market Size and Growth Forecast 2026-2030

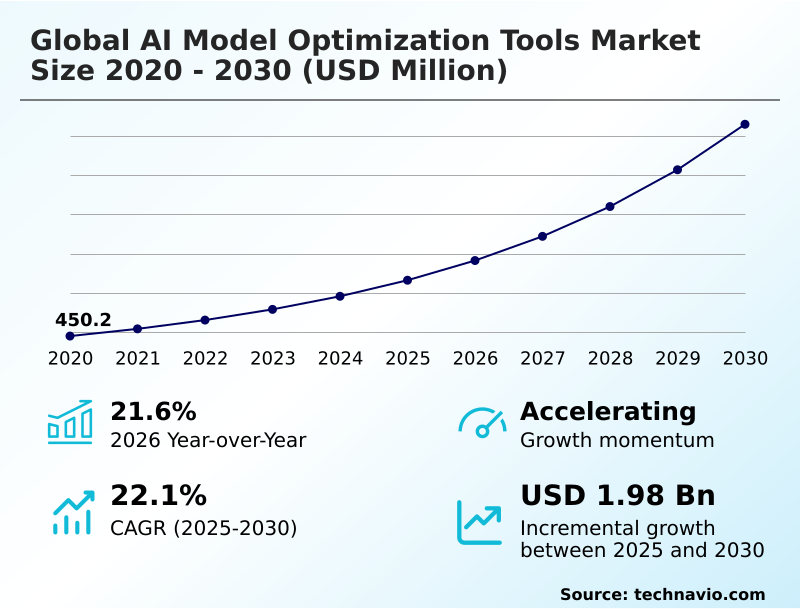
The Ai Model Optimization Tools Market size was valued at USD 1.16 billion in 2025 growing at a CAGR of 22.1% during the forecast period 2026-2030.

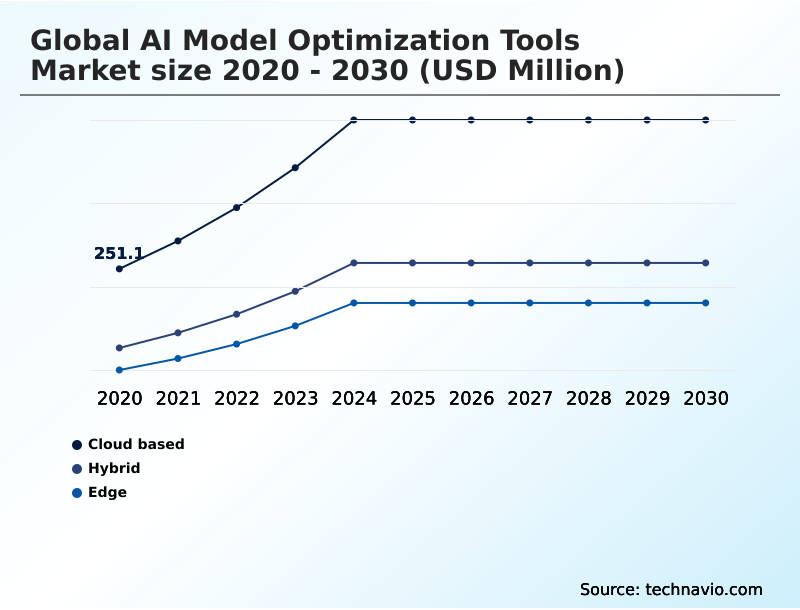
North America accounts for 40.6% of incremental growth during the forecast period. The Cloud based segment by Deployment was valued at USD 501.5 million in 2024, while the Generative AI segment holds the largest revenue share by Application.

The market is projected to grow by USD 2.70 billion from 2020 to 2030, with USD 1.98 billion of the growth expected during the forecast period of 2025 to 2030.

Get Key Insights on Market Forecast (PDF) Request Free Sample

Ai Model Optimization Tools Market Overview

The AI model optimization tools market is expanding as organizations move beyond experimental AI to large-scale operational deployments, driven by the need to balance computational demand with budgetary and hardware constraints. This expansion is reflected in a year-over-year growth of 21.6%, with North America alone contributing to 40.6% of the market's incremental growth. Core techniques such as weight pruning and quantization are no longer optional but are strategic necessities for commercial viability, especially for complex large language models. For instance, an automotive plant implementing quality control with on-device AI deployment uses optimized computer vision models on its assembly line cameras. This hardware-aware optimization allows for real-time defect detection directly on edge devices, achieving latency reduction and eliminating the costs of cloud processing while ensuring high model fidelity. This shift underscores the industry's focus on embedding efficient, powerful AI into operational workflows, transforming raw data into actionable intelligence at the source and improving return on investment.

Drivers, Trends, and Challenges in the Ai Model Optimization Tools Market

Strategic decision-making in the AI model optimization tools market requires a thorough competitive analysis, as enterprises weigh the trade-offs between various techniques. The choice between Pytorch vs Tensorflow for model optimization often depends on the existing MLOps pipeline and the need for specific hardware integrations.

As organizations scale, the cost-benefit analysis of cloud AI optimization becomes critical, especially when dealing with large language models. The impact of hardware fragmentation on AI performance continues to be a central issue, pushing vendors to develop better cross-platform solutions.

Implementing continuous optimization in MLOps is becoming a best practice, but it introduces challenges in maintaining AI model fidelity, a concern highlighted in frameworks like the draft ISO AI Efficiency Framework. For instance, an automotive firm developing autonomous vehicles must balance aggressive model compression with the non-negotiable safety requirements, evaluating security implications.

The role of AI optimization in sustainable computing is also gaining prominence, as companies are now tasked with reporting the energy consumption of their AI workloads. The future of automated neural architecture search promises to alleviate some of these complexities by discovering optimal, hardware-specific model designs automatically.

The ability to measure AI model optimization ROI accurately will ultimately determine the technology's adoption rate across different industries.

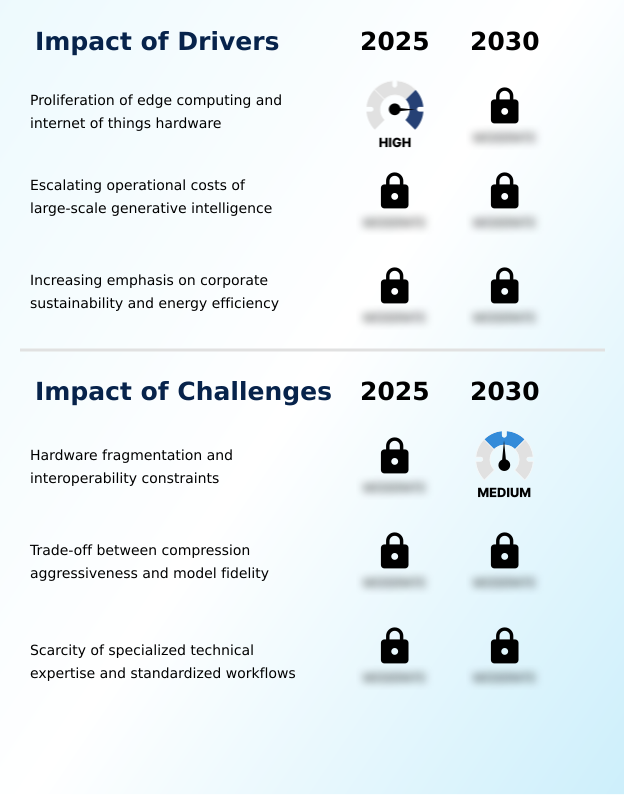
Primary Growth Driver: The proliferation of edge computing and Internet of Things hardware is a key driver for the market, creating demand for optimized AI models on resource-constrained devices.

The market is propelled by three interconnected forces that are making model optimization a strategic necessity.

First, the proliferation of edge computing and IoT hardware creates immense demand for lightweight models that can operate under strict power and memory constraints, driving techniques like structural pruning.

Second, the escalating operational costs of large-scale generative intelligence are forcing enterprises to adopt optimization to achieve commercial viability and manage inference cost reduction.

Finally, a growing emphasis on corporate sustainability and energy efficiency, in line with ESG mandates and regulations such as the EU Energy Efficiency Directive, is pushing organizations to minimize the carbon footprint of their data centers through power consumption optimization.

These drivers collectively shift optimization from a technical niche to a core business requirement.

Emerging Market Trend: The adoption of hardware-aware automated neural architecture search is emerging as a significant trend. This approach optimizes model efficiency for specific silicon, influencing deployment strategies across the industry.

Key trends are reshaping the deployment of artificial intelligence, driven by the need for greater efficiency and accessibility. The integration of continuous optimization within enterprise MLOps pipelines is becoming standard practice, ensuring that models remain efficient throughout their lifecycle.

This is complemented by the rise of hardware-aware automated neural architecture search, which automates the discovery of optimal model structures for specific hardware targets, from data center accelerators to edge devices. A significant shift is occurring toward ultra-low precision quantization, especially for generative intelligence, enabling massive models to run on consumer devices.

This trend toward on-device AI deployment is critical for applications requiring low latency and enhanced data privacy, fundamentally changing how users interact with AI.

Key Industry Challenge: Hardware fragmentation and interoperability constraints present a key challenge to industry growth, complicating cross-platform model deployment and increasing development overhead.

Despite strong drivers, the market faces significant structural challenges that temper growth. The primary obstacle is hardware fragmentation, where the diversity of silicon architectures necessitates bespoke optimization, increasing development costs and limiting model portability solutions. This creates significant cross-platform compatibility issues.

Another critical hurdle is the inherent trade-off between compression aggressiveness and model fidelity; overly aggressive quantization techniques can degrade performance, a risk that is unacceptable in high-stakes applications and a key focus of AI risk management.

Finally, a scarcity of specialized technical expertise, combining deep learning and low-level systems knowledge, creates a major bottleneck, hindering the widespread adoption of advanced optimization workflows and making AI deployment at scale difficult for many organizations.

Explore Full Market Dynamics Analysis Request Free Sample

Ai Model Optimization Tools Market Segmentation

The ai model optimization tools industry research report provides comprehensive data including region-wise segment analysis, with forecasts and analysis for the period 2026-2030, as well as historical data from 2020-2024 for the following segments.

Market Segment by Deployment
  • Cloud based
  • Hybrid
  • Edge
Market Segment by Application
  • Generative AI
  • Computer vision
  • NLP
  • Others
Market Segment by End-user
  • IT and telecom
  • Automotive
  • Healthcare
  • BFSI
  • Others
Market Segment by Geography
North America
US, Canada, Mexico
Europe
Germany, UK, France, Italy, Spain, The Netherlands
APAC
China, Japan, India, South Korea, Australia, Indonesia
Middle East and Africa
Saudi Arabia, UAE, Israel, South Africa, Egypt
South America
Brazil, Argentina, Chile

Deployment Segment Analysis

The cloud based segment is estimated to witness significant growth during the forecast period.

Cloud based deployment represents a primary segment of the AI model optimization tools market, as centralized data centers provide the vast computational resources necessary for large-scale training and refinement.

In this environment, optimization focuses on reducing the financial burden of high-end hardware utilization and increasing the throughput of complex machine learning models.

Cloud providers offer specialized toolchains to automate processes like knowledge distillation, enabling the creation of smaller, efficient models. This is particularly vital for managing inference cost reduction for generative AI inference.

With cloud based services projected to account for a significant share of the market, representing USD 597.9 million in 2025, the focus on AI accelerator utilization and model serving efficiency is paramount for achieving scalable enterprise AI strategy.

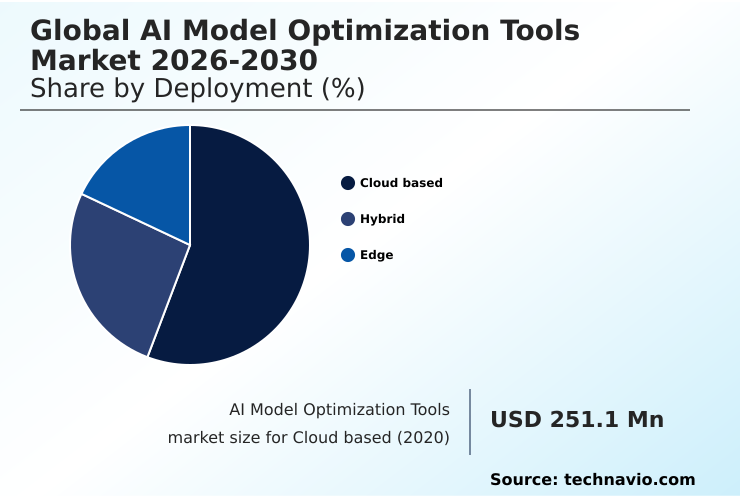
The Cloud based segment was valued at USD 501.5 million in 2024 and showed a gradual increase during the forecast period.

Ai Model Optimization Tools Market by Region: North America Leads with 40.6% Growth Share

North America is estimated to contribute 40.6% to the growth of the global market during the forecast period.

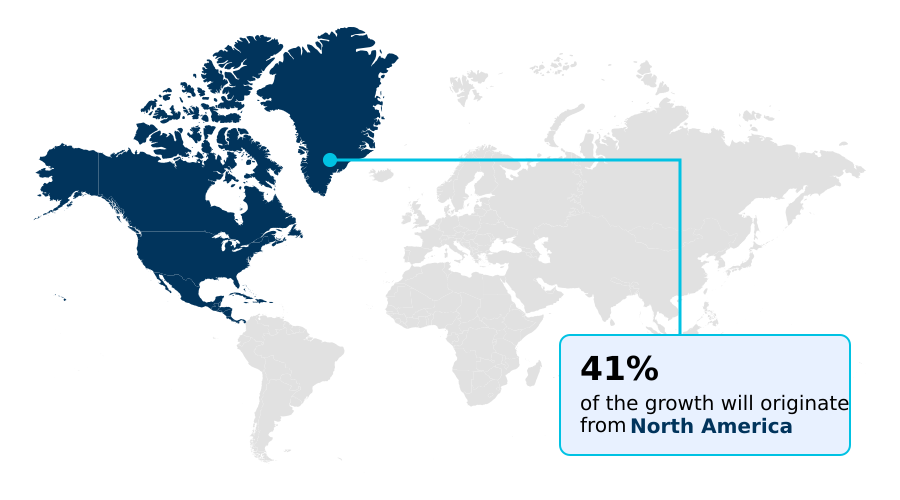
The geographic landscape is led by North America, which is projected to have a CAGR of 22.9% and holds a dominant market share due to its concentration of hyperscale data centers and foundational model developers.

This region focuses on inference cost reduction for cloud-based optimization.

In contrast, Europe, which accounts for 26.26% of the market opportunity, prioritizes AI regulatory compliance and green AI initiatives, driving demand for energy-efficient AI under frameworks like the EU AI Act.

APAC is the fastest-growing region, contributing 23.73% to market opportunity, with a strong emphasis on on-device AI deployment for mobile and consumer electronics, necessitating advanced model footprint reduction.

This regional diversity requires model portability solutions to address varying hardware and regulatory environments effectively.

Customer Landscape Analysis for the Ai Model Optimization Tools Market

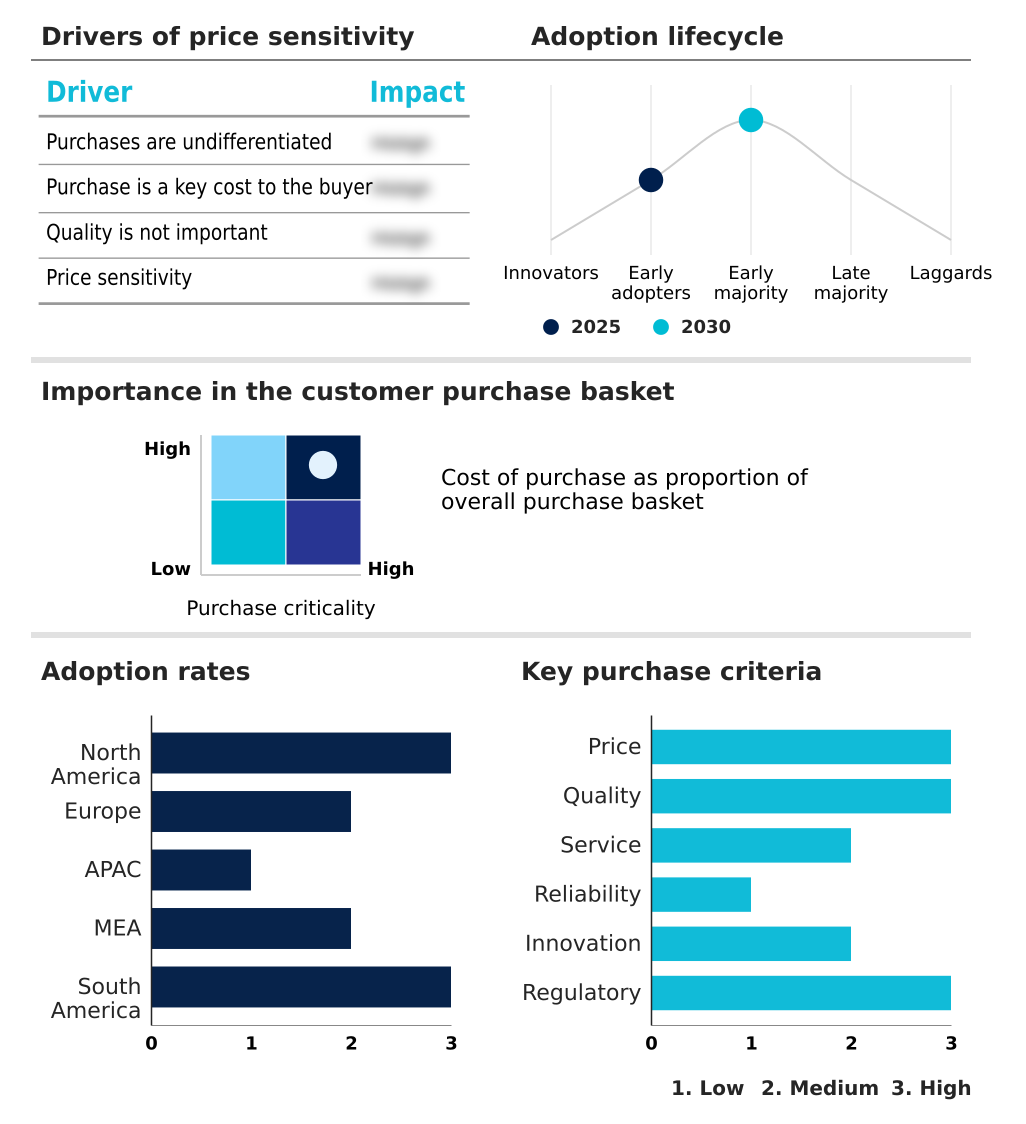
The ai model optimization tools market forecasting report includes the adoption lifecycle of the market, covering from the innovator’s stage to the laggard’s stage. It focuses on adoption rates in different regions based on penetration. Furthermore, the ai model optimization tools market report also includes key purchase criteria and drivers of price sensitivity to help companies evaluate and develop their market growth analysis strategies.

Competitive Landscape of the Ai Model Optimization Tools Market

Companies are implementing various strategies, such as strategic alliances, partnerships, mergers and acquisitions, geographical expansion, and product/service launches, to enhance their presence in the ai model optimization tools market industry.

Advanced Micro Devices Inc. - Delivering AI model optimization through high-performance GPUs and an enabling software stack for efficient training and inference workloads across diverse AI applications.

The industry research and growth report includes detailed analyses of the competitive landscape of the market and information about key companies, including:

  • Advanced Micro Devices Inc.
  • Amazon.com Inc.
  • Apple Inc.
  • Arm Ltd.
  • Baidu Inc.
  • Blaize
  • Cadence Design Systems Inc.
  • Google LLC
  • Hugging Face Inc.
  • IBM Corp.
  • Intel Corp.
  • Latent AI Inc.
  • Meta Platforms Inc.
  • Microsoft Corp.
  • NVIDIA Corp.
  • Oracle Corp.
  • Qualcomm Inc.
  • Red Hat Inc.
  • SAP SE
  • Synopsys Inc.

Qualitative and quantitative analysis of companies has been conducted to help clients understand the wider business environment as well as the strengths and weaknesses of key industry players. Data is qualitatively analyzed to categorize companies as pure play, category-focused, industry-focused, and diversified; it is quantitatively analyzed to categorize companies as dominant, leading, strong, tentative, and weak.

Recent Developments in the Ai Model Optimization Tools Market

  • In August 2025, Meta Platforms released an enhanced version of the ExecuTorch framework, which introduced streamlined support for four-bit quantization across a wider range of mobile and embedded chipsets.
  • In November 2025, Microsoft Corporation implemented a comprehensive energy-efficiency tracking system within the Azure AI model catalog, providing transparent metrics on the wattage consumed per inference task for various optimized architectures.
  • In May 2025, Google Cloud integrated new hardware-aware optimization protocols into the Vertex AI platform which specifically target the latest generation of Tensor Processing Units.
  • In May 2025, Arm Holdings introduced an updated version of the Ethos-U85 neural processing unit software suite, featuring hardware-native weight compression and automated pruning capabilities to reduce memory bandwidth for vision and voice tasks.

Research Analyst Overview: Ai Model Optimization Tools Market

The imperative to manage the escalating operational costs of large-scale generative intelligence is fundamentally reshaping enterprise IT strategy, making AI model optimization tools a central pillar of digital transformation. With the generative AI segment expanding rapidly, boardroom discussions now center on balancing capital expenditures on graphical processing units against the operational expenses of cloud services.

This requires a deep understanding of techniques like knowledge distillation and low-rank adaptation to ensure a positive return on investment. The technical trade-offs are significant; as highlighted in recent NIST reports, aggressive low-bit quantization can impact model fidelity, creating business risks that need careful management.

For procurement decision-makers, this translates to a complex evaluation of AI software stacks and AI accelerator hardware, moving beyond simple performance metrics to consider power consumption optimization and long-term sustainability. The goal is to achieve efficient model serving efficiency and latency reduction without compromising the accuracy needed for mission-critical real-time AI applications.

Dive into Technavio’s robust research methodology, blending expert interviews, extensive data synthesis, and validated models for unparalleled Ai Model Optimization Tools Market insights. See full methodology.

Request Free Sample

Market Scope
Page number 318
Base year 2025
Historic period 2020-2024
Forecast period 2026-2030
Growth momentum & CAGR Accelerate at a CAGR of 22.1%
Market growth 2026-2030 USD 1984.9 million
Market structure Fragmented
YoY growth 2025-2026(%) 21.6%
Key countries US, Canada, Mexico, Germany, UK, France, Italy, Spain, The Netherlands, China, Japan, India, South Korea, Australia, Indonesia, Saudi Arabia, UAE, Israel, South Africa, Egypt, Brazil, Argentina and Chile
Competitive landscape Leading Companies, Market Positioning of Companies, Competitive Strategies, and Industry Risks

Ai Model Optimization Tools Market: Key Questions Answered in This Report

  • What is the expected growth of the Ai Model Optimization Tools Market between 2026 and 2030?

    • The Ai Model Optimization Tools Market is expected to grow by USD 1.98 billion during 2026-2030, registering a CAGR of 22.1%. Year-over-year growth in 2026 is estimated at 21.6%%. This acceleration is shaped by proliferation of edge computing and internet of things hardware, which is intensifying demand across multiple end-use verticals covered in the report.

  • What segmentation does the market report cover?

    • The report is segmented by Deployment (Cloud based, Hybrid, and Edge), Application (Generative AI, Computer vision, NLP, and Others), End-user (IT and telecom, Automotive, Healthcare, BFSI, and Others) and Geography (North America, Europe, APAC, Middle East and Africa, South America). Among these, the Cloud based segment is estimated to witness significant growth during the forecast period, driven by rising adoption across key application areas. Each segment includes detailed qualitative and quantitative analysis, along with historical data from 2020-2024 and forecasts through 2030 with year-over-year growth rates.

  • Which regions are analyzed in the report?

    • The report covers North America, Europe, APAC, Middle East and Africa and South America. North America is estimated to contribute 40.6% to market growth during the forecast period. Country-level analysis includes US, Canada, Mexico, Germany, UK, France, Italy, Spain, The Netherlands, China, Japan, India, South Korea, Australia, Indonesia, Saudi Arabia, UAE, Israel, South Africa, Egypt, Brazil, Argentina and Chile, with dedicated market size tables and year-over-year growth for each.

  • What are the key growth drivers and market challenges?

    • The primary driver is proliferation of edge computing and internet of things hardware, which is accelerating investment and industry demand. The main challenge is hardware fragmentation and interoperability constraints, creating operational barriers for key market participants. The report quantifies the impact of each driver and challenge across 2026 and 2030 with comparative analysis.

  • Who are the major players in the Ai Model Optimization Tools Market?

    • Key vendors include Advanced Micro Devices Inc., Amazon.com Inc., Apple Inc., Arm Ltd., Baidu Inc., Blaize, Cadence Design Systems Inc., Google LLC, Hugging Face Inc., IBM Corp., Intel Corp., Latent AI Inc., Meta Platforms Inc., Microsoft Corp., NVIDIA Corp., Oracle Corp., Qualcomm Inc., Red Hat Inc., SAP SE and Synopsys Inc.. The report provides qualitative and quantitative analysis categorizing companies as dominant, leading, strong, tentative, and weak based on their market positioning. Company profiles include business segment analysis, SWOT assessment, key offerings, and recent strategic developments.

Ai Model Optimization Tools Market Research Insights

Market dynamics are shaped by the dual pressures of performance demand and operational efficiency, with generative AI applications growing faster than computer vision. This necessitates sophisticated model performance benchmarking and adherence to emerging standards like the EU AI Act, which influences AI model governance.

Enterprises are increasingly adopting a hybrid cloud optimization strategy to balance security with scalability, particularly in regulated sectors like finance. For example, a bank might use a public cloud for model training but deploy a pruned and quantized version of the algorithm on-premises for real-time fraud detection, ensuring data privacy enhancement and compliance.

This approach addresses the total cost of ownership while supporting complex digital transformation projects, making AI deployment at scale a more achievable goal for risk-averse organizations.

We can help! Our analysts can customize this ai model optimization tools market research report to meet your requirements.

Get in touch

1. Executive Summary

1.1 Market overview

Executive Summary - Chart on Market Overview
Executive Summary - Data Table on Market Overview
Executive Summary - Chart on Global Market Characteristics
Executive Summary - Chart on Market by Geography
Executive Summary - Chart on Market Segmentation by Deployment
Executive Summary - Chart on Market Segmentation by Application
Executive Summary - Chart on Market Segmentation by End-user
Executive Summary - Chart on Incremental Growth
Executive Summary - Data Table on Incremental Growth
Executive Summary - Chart on Company Market Positioning

2. Technavio Analysis

2.1 Analysis of price sensitivity, lifecycle, customer purchase basket, adoption rates, and purchase criteria

2.2 Criticality of inputs and Factors of differentiation

Chart on Overview on criticality of inputs and factors of differentiation

2.3 Factors of disruption

Chart on Overview on factors of disruption

2.4 Impact of drivers and challenges

Chart on Impact of drivers and challenges in 2025 and 2030

3. Market Landscape

3.1 Market ecosystem

Chart on Parent Market
Data Table on - Parent Market

3.2 Market characteristics

Chart on Market characteristics analysis

3.3 Value chain analysis

Chart on Value chain analysis

4. Market Sizing

4.1 Market definition

Data Table on Offerings of companies included in the market definition

4.2 Market segment analysis

Market segments

4.3 Market size 2025

4.4 Market outlook: Forecast for 2025-2030

Chart on Global - Market size and forecast 2025-2030 ($ million)
Data Table on Global - Market size and forecast 2025-2030 ($ million)
Chart on Global Market: Year-over-year growth 2025-2030 (%)
Data Table on Global Market: Year-over-year growth 2025-2030 (%)

5. Historic Market Size

5.1 Global AI Model Optimization Tools Market 2020 - 2024

Historic Market Size - Data Table on Global AI Model Optimization Tools Market 2020 - 2024 ($ million)

5.2 Deployment segment analysis 2020 - 2024

Historic Market Size - Deployment Segment 2020 - 2024 ($ million)

5.3 Application segment analysis 2020 - 2024

Historic Market Size - Application Segment 2020 - 2024 ($ million)

5.4 End-user segment analysis 2020 - 2024

Historic Market Size - End-user Segment 2020 - 2024 ($ million)

5.5 Geography segment analysis 2020 - 2024

Historic Market Size - Geography Segment 2020 - 2024 ($ million)

5.6 Country segment analysis 2020 - 2024

Historic Market Size - Country Segment 2020 - 2024 ($ million)

6. Qualitative Analysis

6.1 Impact of geopolitical conflicts on Global AI Model Optimization Tools Market

7. Five Forces Analysis

7.1 Five forces summary

Five forces analysis - Comparison between 2025 and 2030

7.2 Bargaining power of buyers

Bargaining power of buyers - Impact of key factors 2025 and 2030

7.3 Bargaining power of suppliers

Bargaining power of suppliers - Impact of key factors in 2025 and 2030

7.4 Threat of new entrants

Threat of new entrants - Impact of key factors in 2025 and 2030

7.5 Threat of substitutes

Threat of substitutes - Impact of key factors in 2025 and 2030

7.6 Threat of rivalry

Threat of rivalry - Impact of key factors in 2025 and 2030

7.7 Market condition

Chart on Market condition - Five forces 2025 and 2030

8. Market Segmentation by Deployment

8.1 Market segments

Chart on Deployment - Market share 2025-2030 (%)
Data Table on Deployment - Market share 2025-2030 (%)

8.2 Comparison by Deployment

Chart on Comparison by Deployment
Data Table on Comparison by Deployment

8.3 Cloud based - Market size and forecast 2025-2030

Chart on Cloud based - Market size and forecast 2025-2030 ($ million)
Data Table on Cloud based - Market size and forecast 2025-2030 ($ million)
Chart on Cloud based - Year-over-year growth 2025-2030 (%)
Data Table on Cloud based - Year-over-year growth 2025-2030 (%)

8.4 Hybrid - Market size and forecast 2025-2030

Chart on Hybrid - Market size and forecast 2025-2030 ($ million)
Data Table on Hybrid - Market size and forecast 2025-2030 ($ million)
Chart on Hybrid - Year-over-year growth 2025-2030 (%)
Data Table on Hybrid - Year-over-year growth 2025-2030 (%)

8.5 Edge - Market size and forecast 2025-2030

Chart on Edge - Market size and forecast 2025-2030 ($ million)
Data Table on Edge - Market size and forecast 2025-2030 ($ million)
Chart on Edge - Year-over-year growth 2025-2030 (%)
Data Table on Edge - Year-over-year growth 2025-2030 (%)

8.6 Market opportunity by Deployment

Market opportunity by Deployment ($ million)
Data Table on Market opportunity by Deployment ($ million)

9. Market Segmentation by Application

9.1 Market segments

Chart on Application - Market share 2025-2030 (%)
Data Table on Application - Market share 2025-2030 (%)

9.2 Comparison by Application

Chart on Comparison by Application
Data Table on Comparison by Application

9.3 Generative AI - Market size and forecast 2025-2030

Chart on Generative AI - Market size and forecast 2025-2030 ($ million)
Data Table on Generative AI - Market size and forecast 2025-2030 ($ million)
Chart on Generative AI - Year-over-year growth 2025-2030 (%)
Data Table on Generative AI - Year-over-year growth 2025-2030 (%)

9.4 Computer vision - Market size and forecast 2025-2030

Chart on Computer vision - Market size and forecast 2025-2030 ($ million)
Data Table on Computer vision - Market size and forecast 2025-2030 ($ million)
Chart on Computer vision - Year-over-year growth 2025-2030 (%)
Data Table on Computer vision - Year-over-year growth 2025-2030 (%)

9.5 NLP - Market size and forecast 2025-2030

Chart on NLP - Market size and forecast 2025-2030 ($ million)
Data Table on NLP - Market size and forecast 2025-2030 ($ million)
Chart on NLP - Year-over-year growth 2025-2030 (%)
Data Table on NLP - Year-over-year growth 2025-2030 (%)

9.6 Others - Market size and forecast 2025-2030

Chart on Others - Market size and forecast 2025-2030 ($ million)
Data Table on Others - Market size and forecast 2025-2030 ($ million)
Chart on Others - Year-over-year growth 2025-2030 (%)
Data Table on Others - Year-over-year growth 2025-2030 (%)

9.7 Market opportunity by Application

Market opportunity by Application ($ million)
Data Table on Market opportunity by Application ($ million)

10. Market Segmentation by End-user

10.1 Market segments

Chart on End-user - Market share 2025-2030 (%)
Data Table on End-user - Market share 2025-2030 (%)

10.2 Comparison by End-user

Chart on Comparison by End-user
Data Table on Comparison by End-user

10.3 IT and telecom - Market size and forecast 2025-2030

Chart on IT and telecom - Market size and forecast 2025-2030 ($ million)
Data Table on IT and telecom - Market size and forecast 2025-2030 ($ million)
Chart on IT and telecom - Year-over-year growth 2025-2030 (%)
Data Table on IT and telecom - Year-over-year growth 2025-2030 (%)

10.4 Automotive - Market size and forecast 2025-2030

Chart on Automotive - Market size and forecast 2025-2030 ($ million)
Data Table on Automotive - Market size and forecast 2025-2030 ($ million)
Chart on Automotive - Year-over-year growth 2025-2030 (%)
Data Table on Automotive - Year-over-year growth 2025-2030 (%)

10.5 Healthcare - Market size and forecast 2025-2030

Chart on Healthcare - Market size and forecast 2025-2030 ($ million)
Data Table on Healthcare - Market size and forecast 2025-2030 ($ million)
Chart on Healthcare - Year-over-year growth 2025-2030 (%)
Data Table on Healthcare - Year-over-year growth 2025-2030 (%)

10.6 BFSI - Market size and forecast 2025-2030

Chart on BFSI - Market size and forecast 2025-2030 ($ million)
Data Table on BFSI - Market size and forecast 2025-2030 ($ million)
Chart on BFSI - Year-over-year growth 2025-2030 (%)
Data Table on BFSI - Year-over-year growth 2025-2030 (%)

10.7 Others - Market size and forecast 2025-2030

Chart on Others - Market size and forecast 2025-2030 ($ million)
Data Table on Others - Market size and forecast 2025-2030 ($ million)
Chart on Others - Year-over-year growth 2025-2030 (%)
Data Table on Others - Year-over-year growth 2025-2030 (%)

10.8 Market opportunity by End-user

Market opportunity by End-user ($ million)
Data Table on Market opportunity by End-user ($ million)

11. Customer Landscape

11.1 Customer landscape overview

Analysis of price sensitivity, lifecycle, customer purchase basket, adoption rates, and purchase criteria

12. Geographic Landscape

12.1 Geographic segmentation

Chart on Market share by geography 2025-2030 (%)
Data Table on Market share by geography 2025-2030 (%)

12.2 Geographic comparison

Chart on Geographic comparison
Data Table on Geographic comparison

12.3 North America - Market size and forecast 2025-2030

Chart on North America - Market size and forecast 2025-2030 ($ million)
Data Table on North America - Market size and forecast 2025-2030 ($ million)
Chart on North America - Year-over-year growth 2025-2030 (%)
Data Table on North America - Year-over-year growth 2025-2030 (%)
Chart on Regional Comparison - North America
Data Table on Regional Comparison - North America

12.3.1 US - Market size and forecast 2025-2030

Chart on US - Market size and forecast 2025-2030 ($ million)
Data Table on US - Market size and forecast 2025-2030 ($ million)
Chart on US - Year-over-year growth 2025-2030 (%)
Data Table on US - Year-over-year growth 2025-2030 (%)

12.3.2 Canada - Market size and forecast 2025-2030

Chart on Canada - Market size and forecast 2025-2030 ($ million)
Data Table on Canada - Market size and forecast 2025-2030 ($ million)
Chart on Canada - Year-over-year growth 2025-2030 (%)
Data Table on Canada - Year-over-year growth 2025-2030 (%)

12.3.3 Mexico - Market size and forecast 2025-2030

Chart on Mexico - Market size and forecast 2025-2030 ($ million)
Data Table on Mexico - Market size and forecast 2025-2030 ($ million)
Chart on Mexico - Year-over-year growth 2025-2030 (%)
Data Table on Mexico - Year-over-year growth 2025-2030 (%)

12.4 Europe - Market size and forecast 2025-2030

Chart on Europe - Market size and forecast 2025-2030 ($ million)
Data Table on Europe - Market size and forecast 2025-2030 ($ million)
Chart on Europe - Year-over-year growth 2025-2030 (%)
Data Table on Europe - Year-over-year growth 2025-2030 (%)
Chart on Regional Comparison - Europe
Data Table on Regional Comparison - Europe

12.4.1 Germany - Market size and forecast 2025-2030

Chart on Germany - Market size and forecast 2025-2030 ($ million)
Data Table on Germany - Market size and forecast 2025-2030 ($ million)
Chart on Germany - Year-over-year growth 2025-2030 (%)
Data Table on Germany - Year-over-year growth 2025-2030 (%)

12.4.2 UK - Market size and forecast 2025-2030

Chart on UK - Market size and forecast 2025-2030 ($ million)
Data Table on UK - Market size and forecast 2025-2030 ($ million)
Chart on UK - Year-over-year growth 2025-2030 (%)
Data Table on UK - Year-over-year growth 2025-2030 (%)

12.4.3 France - Market size and forecast 2025-2030

Chart on France - Market size and forecast 2025-2030 ($ million)
Data Table on France - Market size and forecast 2025-2030 ($ million)
Chart on France - Year-over-year growth 2025-2030 (%)
Data Table on France - Year-over-year growth 2025-2030 (%)

12.4.4 Italy - Market size and forecast 2025-2030

Chart on Italy - Market size and forecast 2025-2030 ($ million)
Data Table on Italy - Market size and forecast 2025-2030 ($ million)
Chart on Italy - Year-over-year growth 2025-2030 (%)
Data Table on Italy - Year-over-year growth 2025-2030 (%)

12.4.5 Spain - Market size and forecast 2025-2030

Chart on Spain - Market size and forecast 2025-2030 ($ million)
Data Table on Spain - Market size and forecast 2025-2030 ($ million)
Chart on Spain - Year-over-year growth 2025-2030 (%)
Data Table on Spain - Year-over-year growth 2025-2030 (%)

12.4.6 The Netherlands - Market size and forecast 2025-2030

Chart on The Netherlands - Market size and forecast 2025-2030 ($ million)
Data Table on The Netherlands - Market size and forecast 2025-2030 ($ million)
Chart on The Netherlands - Year-over-year growth 2025-2030 (%)
Data Table on The Netherlands - Year-over-year growth 2025-2030 (%)

12.5 APAC - Market size and forecast 2025-2030

Chart on APAC - Market size and forecast 2025-2030 ($ million)
Data Table on APAC - Market size and forecast 2025-2030 ($ million)
Chart on APAC - Year-over-year growth 2025-2030 (%)
Data Table on APAC - Year-over-year growth 2025-2030 (%)
Chart on Regional Comparison - APAC
Data Table on Regional Comparison - APAC

12.5.1 China - Market size and forecast 2025-2030

Chart on China - Market size and forecast 2025-2030 ($ million)
Data Table on China - Market size and forecast 2025-2030 ($ million)
Chart on China - Year-over-year growth 2025-2030 (%)
Data Table on China - Year-over-year growth 2025-2030 (%)

12.5.2 Japan - Market size and forecast 2025-2030

Chart on Japan - Market size and forecast 2025-2030 ($ million)
Data Table on Japan - Market size and forecast 2025-2030 ($ million)
Chart on Japan - Year-over-year growth 2025-2030 (%)
Data Table on Japan - Year-over-year growth 2025-2030 (%)

12.5.3 India - Market size and forecast 2025-2030

Chart on India - Market size and forecast 2025-2030 ($ million)
Data Table on India - Market size and forecast 2025-2030 ($ million)
Chart on India - Year-over-year growth 2025-2030 (%)
Data Table on India - Year-over-year growth 2025-2030 (%)

12.5.4 South Korea - Market size and forecast 2025-2030

Chart on South Korea - Market size and forecast 2025-2030 ($ million)
Data Table on South Korea - Market size and forecast 2025-2030 ($ million)
Chart on South Korea - Year-over-year growth 2025-2030 (%)
Data Table on South Korea - Year-over-year growth 2025-2030 (%)

12.5.5 Australia - Market size and forecast 2025-2030

Chart on Australia - Market size and forecast 2025-2030 ($ million)
Data Table on Australia - Market size and forecast 2025-2030 ($ million)
Chart on Australia - Year-over-year growth 2025-2030 (%)
Data Table on Australia - Year-over-year growth 2025-2030 (%)

12.5.6 Indonesia - Market size and forecast 2025-2030

Chart on Indonesia - Market size and forecast 2025-2030 ($ million)
Data Table on Indonesia - Market size and forecast 2025-2030 ($ million)
Chart on Indonesia - Year-over-year growth 2025-2030 (%)
Data Table on Indonesia - Year-over-year growth 2025-2030 (%)

12.6 Middle East and Africa - Market size and forecast 2025-2030

Chart on Middle East and Africa - Market size and forecast 2025-2030 ($ million)
Data Table on Middle East and Africa - Market size and forecast 2025-2030 ($ million)
Chart on Middle East and Africa - Year-over-year growth 2025-2030 (%)
Data Table on Middle East and Africa - Year-over-year growth 2025-2030 (%)
Chart on Regional Comparison - Middle East and Africa
Data Table on Regional Comparison - Middle East and Africa

12.6.1 Saudi Arabia - Market size and forecast 2025-2030

Chart on Saudi Arabia - Market size and forecast 2025-2030 ($ million)
Data Table on Saudi Arabia - Market size and forecast 2025-2030 ($ million)
Chart on Saudi Arabia - Year-over-year growth 2025-2030 (%)
Data Table on Saudi Arabia - Year-over-year growth 2025-2030 (%)

12.6.2 UAE - Market size and forecast 2025-2030

Chart on UAE - Market size and forecast 2025-2030 ($ million)
Data Table on UAE - Market size and forecast 2025-2030 ($ million)
Chart on UAE - Year-over-year growth 2025-2030 (%)
Data Table on UAE - Year-over-year growth 2025-2030 (%)

12.6.3 Israel - Market size and forecast 2025-2030

Chart on Israel - Market size and forecast 2025-2030 ($ million)
Data Table on Israel - Market size and forecast 2025-2030 ($ million)
Chart on Israel - Year-over-year growth 2025-2030 (%)
Data Table on Israel - Year-over-year growth 2025-2030 (%)

12.6.4 South Africa - Market size and forecast 2025-2030

Chart on South Africa - Market size and forecast 2025-2030 ($ million)
Data Table on South Africa - Market size and forecast 2025-2030 ($ million)
Chart on South Africa - Year-over-year growth 2025-2030 (%)
Data Table on South Africa - Year-over-year growth 2025-2030 (%)

12.6.5 Egypt - Market size and forecast 2025-2030

Chart on Egypt - Market size and forecast 2025-2030 ($ million)
Data Table on Egypt - Market size and forecast 2025-2030 ($ million)
Chart on Egypt - Year-over-year growth 2025-2030 (%)
Data Table on Egypt - Year-over-year growth 2025-2030 (%)

12.7 South America - Market size and forecast 2025-2030

Chart on South America - Market size and forecast 2025-2030 ($ million)
Data Table on South America - Market size and forecast 2025-2030 ($ million)
Chart on South America - Year-over-year growth 2025-2030 (%)
Data Table on South America - Year-over-year growth 2025-2030 (%)
Chart on Regional Comparison - South America
Data Table on Regional Comparison - South America

12.7.1 Brazil - Market size and forecast 2025-2030

Chart on Brazil - Market size and forecast 2025-2030 ($ million)
Data Table on Brazil - Market size and forecast 2025-2030 ($ million)
Chart on Brazil - Year-over-year growth 2025-2030 (%)
Data Table on Brazil - Year-over-year growth 2025-2030 (%)

12.7.2 Argentina - Market size and forecast 2025-2030

Chart on Argentina - Market size and forecast 2025-2030 ($ million)
Data Table on Argentina - Market size and forecast 2025-2030 ($ million)
Chart on Argentina - Year-over-year growth 2025-2030 (%)
Data Table on Argentina - Year-over-year growth 2025-2030 (%)

12.7.3 Chile - Market size and forecast 2025-2030

Chart on Chile - Market size and forecast 2025-2030 ($ million)
Data Table on Chile - Market size and forecast 2025-2030 ($ million)
Chart on Chile - Year-over-year growth 2025-2030 (%)
Data Table on Chile - Year-over-year growth 2025-2030 (%)

12.8 Market opportunity by geography

Market opportunity by geography ($ million)
Data Tables on Market opportunity by geography ($ million)

13. Drivers, Challenges, and Opportunity

13.1 Market drivers

Proliferation of edge computing and internet of things hardware
Escalating operational costs of large-scale generative intelligence
Increasing emphasis on corporate sustainability and energy efficiency

13.2 Market challenges

Hardware fragmentation and interoperability constraints
Trade-off between compression aggressiveness and model fidelity
Scarcity of specialized technical expertise and standardized workflows

13.3 Impact of drivers and challenges

Impact of drivers and challenges in 2025 and 2030

13.4 Market opportunities

Adoption of hardware-aware automated neural architecture search
Rise of ultra-low precision quantization for generative intelligence
Integration of continuous optimization within enterprise MLOPS pipelines

14. Competitive Landscape

14.1 Overview

14.2

Overview on criticality of inputs and factors of differentiation

14.3 Landscape disruption

Overview on factors of disruption

14.4 Industry risks

Impact of key risks on business

15. Competitive Analysis

15.1 Companies profiled

Companies covered

15.2 Company ranking index

15.3 Market positioning of companies

Matrix on companies position and classification

15.4 Advanced Micro Devices Inc.

Advanced Micro Devices Inc. - Overview
Advanced Micro Devices Inc. - Business segments
Advanced Micro Devices Inc. - Key news
Advanced Micro Devices Inc. - Key offerings
Advanced Micro Devices Inc. - Segment focus
SWOT

15.5 Amazon.com Inc.

Amazon.com Inc. - Overview
Amazon.com Inc. - Business segments
Amazon.com Inc. - Key news
Amazon.com Inc. - Key offerings
Amazon.com Inc. - Segment focus
SWOT

15.6 Apple Inc.

Apple Inc. - Overview
Apple Inc. - Business segments
Apple Inc. - Key news
Apple Inc. - Key offerings
Apple Inc. - Segment focus
SWOT

15.7 Arm Ltd.

Arm Ltd. - Overview
Arm Ltd. - Product / Service
Arm Ltd. - Key offerings
SWOT

15.8 Baidu Inc.

Baidu Inc. - Overview
Baidu Inc. - Business segments
Baidu Inc. - Key offerings
Baidu Inc. - Segment focus
SWOT

15.9 Blaize

Blaize - Overview
Blaize - Product / Service
Blaize - Key offerings
SWOT

15.10 Cadence Design Systems Inc.

Cadence Design Systems Inc. - Overview
Cadence Design Systems Inc. - Business segments
Cadence Design Systems Inc. - Key news
Cadence Design Systems Inc. - Key offerings
Cadence Design Systems Inc. - Segment focus
SWOT

15.11 Google LLC

Google LLC - Overview
Google LLC - Product / Service
Google LLC - Key offerings
SWOT

15.12 Hugging Face Inc.

Hugging Face Inc. - Overview
Hugging Face Inc. - Product / Service
Hugging Face Inc. - Key offerings
SWOT

15.13 IBM Corp.

IBM Corp. - Overview
IBM Corp. - Business segments
IBM Corp. - Key news
IBM Corp. - Key offerings
IBM Corp. - Segment focus
SWOT

15.14 Intel Corp.

Intel Corp. - Overview
Intel Corp. - Business segments
Intel Corp. - Key offerings
Intel Corp. - Segment focus
SWOT

15.15 Latent AI Inc.

Latent AI Inc. - Overview
Latent AI Inc. - Product / Service
Latent AI Inc. - Key offerings
SWOT

15.16 Meta Platforms Inc.

Meta Platforms Inc. - Overview
Meta Platforms Inc. - Business segments
Meta Platforms Inc. - Key offerings
Meta Platforms Inc. - Segment focus
SWOT

15.17 Microsoft Corp.

Microsoft Corp. - Overview
Microsoft Corp. - Business segments
Microsoft Corp. - Key news
Microsoft Corp. - Key offerings
Microsoft Corp. - Segment focus
SWOT

15.18 NVIDIA Corp.

NVIDIA Corp. - Overview
NVIDIA Corp. - Business segments
NVIDIA Corp. - Key news
NVIDIA Corp. - Key offerings
NVIDIA Corp. - Segment focus
SWOT

16. Appendix

16.1 Scope of the report

Market definition
Objectives
Notes and caveats

16.2 Inclusions and exclusions checklist

Inclusions checklist
Exclusions checklist

16.3 Currency conversion rates for US$

16.4 Research methodology

16.5 Data procurement

Information sources

16.6 Data validation

16.7 Validation techniques employed for market sizing

16.8 Data synthesis

16.9 360 degree market analysis

16.10 List of abbreviations

Research Methodology

Technavio presents a detailed picture of the market by way of study, synthesis, and summation of data from multiple sources. The analysts have presented the various facets of the market with a particular focus on identifying the key industry influencers. The data thus presented is comprehensive, reliable, and the result of extensive research, both primary and secondary.

INFORMATION SOURCES

Primary sources

  • Manufacturers and suppliers
  • Channel partners
  • Industry experts
  • Strategic decision makers

Secondary sources

  • Industry journals and periodicals
  • Government data
  • Financial reports of key industry players
  • Historical data
  • Press releases

DATA ANALYSIS

Data Synthesis

  • Collation of data
  • Estimation of key figures
  • Analysis of derived insights

Data Validation

  • Triangulation with data models
  • Reference against proprietary databases
  • Corroboration with industry experts

REPORT WRITING

Qualitative

  • Market drivers
  • Market challenges
  • Market trends
  • Five forces analysis

Quantitative

  • Market size and forecast
  • Market segmentation
  • Geographical insights
  • Competitive landscape

Interested in this report?

Get your sample now to see our research methodology and insights!

Download Now

Frequently Asked Questions

Ai Model Optimization Tools market growth will increase by USD 1984.9 million during 2026-2030.

The Ai Model Optimization Tools market is expected to grow at a CAGR of 22.1% during 2026-2030.

Ai Model Optimization Tools market is segmented by Deployment (Cloud based, Hybrid, Edge) Application (Generative AI, Computer vision, NLP, Others) End-user (IT and telecom, Automotive, Healthcare, BFSI, Others)

Advanced Micro Devices Inc., Amazon.com Inc., Apple Inc., Arm Ltd., Baidu Inc., Blaize, Cadence Design Systems Inc., Google LLC, Hugging Face Inc., IBM Corp., Intel Corp., Latent AI Inc., Meta Platforms Inc., Microsoft Corp., NVIDIA Corp., Oracle Corp., Qualcomm Inc., Red Hat Inc., SAP SE, Synopsys Inc. are a few of the key vendors in the Ai Model Optimization Tools market.

North America will register the highest growth rate of 40.6% among the other regions. Therefore, the Ai Model Optimization Tools market in North America is expected to garner significant business opportunities for the vendors during the forecast period.

US, Canada, Mexico, Germany, UK, France, Italy, Spain, The Netherlands, China, Japan, India, South Korea, Australia, Indonesia, Saudi Arabia, UAE, Israel, South Africa, Egypt, Brazil, Argentina, Chile

  • Proliferation of edge computing and internet of things hardware is the driving factor this market.

The Ai Model Optimization Tools market vendors should focus on grabbing business opportunities from the Deployment segment as it accounted for the largest market share in the base year.
RIA - Research AI Assistant
Ask RIA