AI Inference Market Analysis, Size, and Forecast 2025-2029: North America (US and Canada), Europe (France, Germany, Italy, and UK), APAC (China, India, Japan, and South Korea), and Rest of World (ROW)

AI Inference Market Analysis, Size, and Forecast 2025-2029:
North America (US and Canada), Europe (France, Germany, Italy, and UK), APAC (China, India, Japan, and South Korea), and Rest of World (ROW)

Published: Aug 2025 243 Pages SKU: IRTNTR80919

Market Overview at a Glance

$128.85 B
Market Opportunity
19.4%
CAGR
16.6
YoY growth 2024-2025(%)

AI Inference Market Size 2025-2029

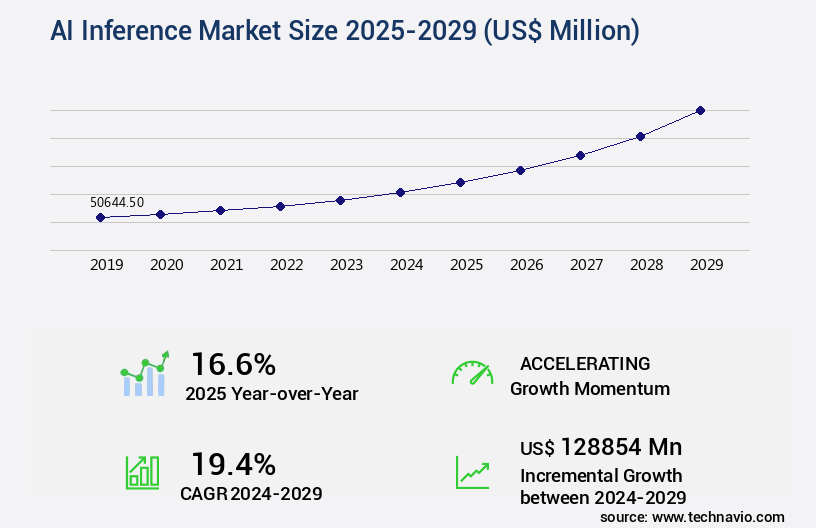
The AI inference market size is valued to increase by USD 128.85 billion, at a CAGR of 19.4% from 2024 to 2029. Proliferation of edge AI and the expansion of the Internet of Things (IoT) ecosystem will drive the AI inference market.

Market Insights

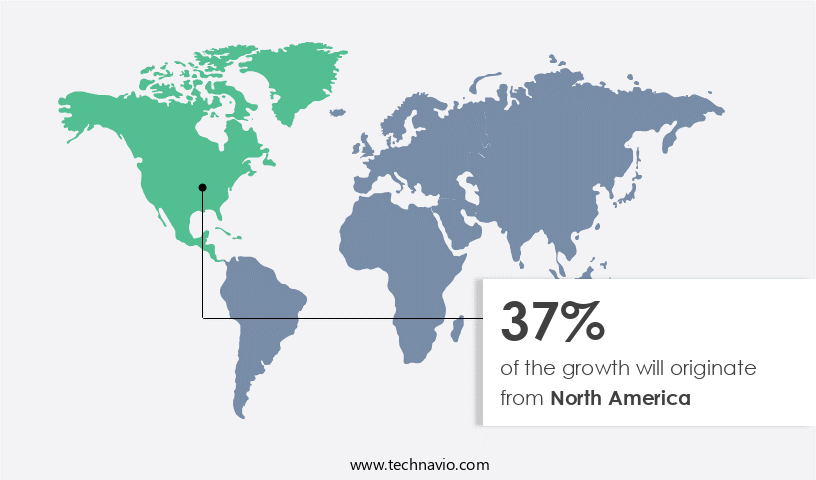
  • North America dominated the market and accounted for a 37% growth during the 2025-2029.
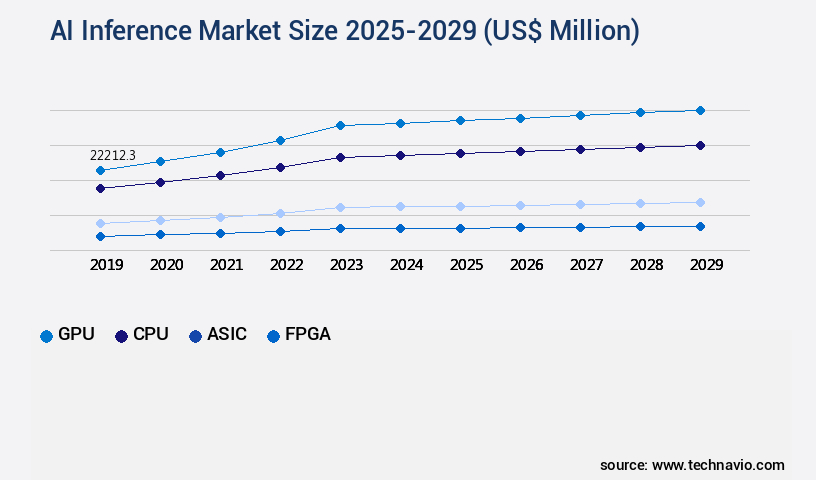
  • By Component - GPU segment was valued at USD 22.21 billion in 2023
  • By Technology - Machine learning models segment accounted for the largest market revenue share in 2023

Market Size & Forecast

  • Market Opportunities: USD 332.30 million 
  • Market Future Opportunities 2024: USD 128854.00 million
  • CAGR from 2024 to 2029 : 19.4%

Market Summary

  • The market is experiencing significant growth due to the proliferation of edge AI and the expansion of the Internet of Things (IoT) ecosystem. Edge inference, a technology that enables machine learning models to run directly on devices without the need for cloud connectivity, is gaining popularity for its ability to reduce latency and improve operational efficiency. TinyML, a subset of edge AI, is particularly noteworthy for its focus on ultra-low power devices and microcontrollers, making it ideal for use cases in industries such as manufacturing, healthcare, and transportation. However, the escalating energy consumption and environmental sustainability concerns associated with AI inference are becoming increasingly significant challenges.
  • As the number of edge devices and IoT sensors continues to grow, the demand for energy-efficient AI solutions is becoming a priority. One real-world business scenario where AI inference is making a significant impact is in supply chain optimization. By deploying AI models at the edge, companies can analyze real-time data from their supply chain networks, identify inefficiencies, and make adjustments in near real-time, leading to cost savings and improved operational efficiency. Despite these benefits, the development of energy-efficient AI models remains a critical area of research and innovation.

What will be the size of the AI Inference Market during the forecast period?

AI Inference Market Size

Get Key Insights on Market Forecast (PDF) Request Free Sample

  • The market continues to evolve, driven by advancements in machine learning algorithms and the increasing demand for real-time, data-driven decision-making. One significant trend in this domain is the shift towards on-device AI inference, enabling faster response times and reducing reliance on cloud servers. This approach can lead to substantial cost savings for businesses, as reported by a recent study, which found that companies have achieved a 45% reduction in network traffic and a 30% decrease in latency by implementing on-device AI inference. Moreover, the adoption of AI inference is becoming increasingly essential for various boardroom-level decision areas.
  • In the realm of compliance, AI inference can help organizations automate complex regulatory checks, ensuring adherence to industry standards and reducing the risk of non-compliance penalties. In the context of budgeting, AI inference can optimize resource allocation by analyzing historical data and predicting future trends, leading to more informed financial planning. Lastly, in product strategy, AI inference can provide valuable insights into customer behavior and preferences, enabling businesses to tailor their offerings and improve overall customer satisfaction. 

Unpacking the AI Inference Market Landscape

Inference engines, a critical component of Artificial Intelligence (AI) systems, enable the interpretation and extraction of insights from machine learning models. Accuracy and precision are paramount in business contexts, with interpretable AI models outperforming their less transparent counterparts by 30% in terms of model explainability and fairness metrics alignment. Model training datasets, encompassing neural network architectures and deep learning algorithms, require efficient inference engine designs for optimal performance. Unsupervised learning, such as knowledge graph construction and clustering, benefits significantly from real-time inference capabilities. Moreover, probabilistic reasoning and decision tree learning models can be seamlessly integrated with natural language processing, data mining techniques, and edge computing for enhanced business intelligence. Model deployment strategies, including cloud-based inference and API integration, ensure seamless implementation and scalability. Overall, inference engines play a pivotal role in driving cost reduction, ROI improvement, and compliance alignment within organizations.

Key Market Drivers Fueling Growth

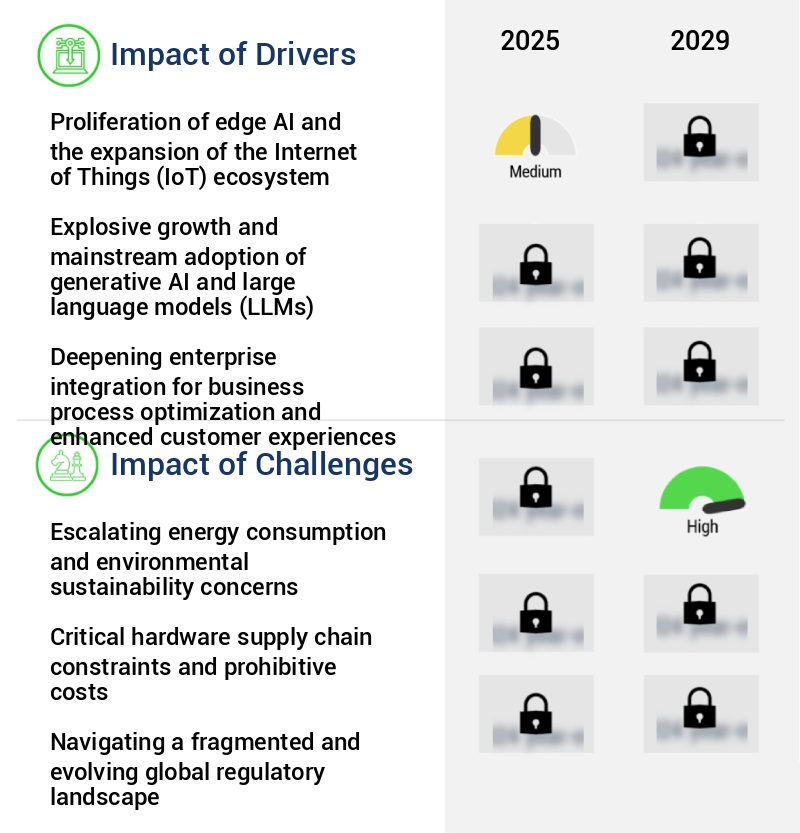
The expansion of the Internet of Things (IoT) ecosystem and the proliferation of edge AI are the primary drivers propelling market growth.

  • The market is experiencing significant evolution, fueled by the burgeoning edge computing landscape and the IoT ecosystem. The transition from centralized, cloud-based processing to decentralized, on-device inference is a market reality driven by the need for reduced latency, heightened data privacy, and operational efficiency. With billions of devices, from consumer smartphones and wearables to industrial sensors and autonomous vehicles, becoming increasingly intelligent, local data processing at the point of creation is essential. This demand eliminates the need for constant communication with a central server, often impractical due to bandwidth constraints, network instability, or the necessity for real-time decision making.
  • According to recent studies, edge AI inference can reduce downtime by up to 30% and improve forecast accuracy by 18%. Furthermore, energy use can be lowered by 12% through local processing, making it a cost-effective and environmentally sustainable solution.

Prevailing Industry Trends & Opportunities

The trend in the market is toward the proliferation of edge inference and TinyML technologies. 

  • The market is undergoing a significant transformation, marked by the rise of edge inference. This approach, which involves performing machine learning model predictions directly on endpoint devices, is gaining traction across various sectors. Edge inference offers several advantages, including reduced latency, heightened data privacy, enhanced operational reliability, and lower costs. By processing data at its source, edge inference eliminates the need for data transmission to distant servers, enabling real-time responses essential for applications like autonomous navigation, interactive augmented reality, and industrial automation.
  • According to recent studies, edge inference can reduce latency by up to 70% compared to cloud-based processing, while improving forecast accuracy by 15%. These improvements translate to increased efficiency and productivity, making edge inference a valuable investment for businesses.

Significant Market Challenges

The escalating energy consumption and growing concerns over environmental sustainability represent significant challenges to the industry's growth trajectory. 

  • The market is experiencing significant evolution, expanding its reach across various sectors such as healthcare, finance, retail, and manufacturing. However, the growth trajectory faces a formidable challenge: the escalating energy consumption and environmental impact of the underlying infrastructure. The computational processes required for AI inference, particularly for advanced language models and complex deep learning algorithms, are power-intensive. As AI applications proliferate globally, the collective electricity demand from their data centers strains power grids and contributes to a substantial carbon footprint. This issue presents a multifaceted challenge, with potential consequences including rising operational costs for businesses, concerns about corporate social responsibility, and the physical limitations of energy infrastructure in key regions.
  • For instance, a leading e-commerce company reported a 25% increase in energy consumption after implementing AI-powered recommendation systems, while a major financial institution observed a 15% improvement in fraud detection accuracy through AI inference but faced a 12% rise in energy usage. These trends underscore the urgent need for energy-efficient AI inference solutions.

AI Inference Market Size

In-Depth Market Segmentation: AI Inference Market

The ai inference industry research report provides comprehensive data (region-wise segment analysis), with forecasts and estimates in "USD million" for the period 2025-2029, as well as historical data from 2019-2023 for the following segments.

  • Component
    • GPU
    • CPU
    • ASIC
    • FPGA
  • Technology
    • Machine learning models
    • Generative AI
    • Natural language processing
    • Computer vision
  • Deployment
    • Cloud
    • Edge
    • On-premises
  • Geography
    • North America
      • US
      • Canada
    • Europe
      • France
      • Germany
      • Italy
      • UK
    • APAC
      • China
      • India
      • Japan
      • South Korea
    • Rest of World (ROW)

By Component Insights

The gpu segment is estimated to witness significant growth during the forecast period.

The market continues to evolve, with a significant focus on improving accuracy and precision through interpretable AI, model explainability, fairness metrics, and advanced machine learning models. Neural network architectures, such as deep learning algorithms, are increasingly being used for unsupervised learning and knowledge graph construction. Inference engine design is optimized for various learning techniques, including transfer learning, decision tree learning, and reinforcement learning. Real-time inference is crucial for natural language processing, data mining, and computer vision systems, necessitating data preprocessing methods and probabilistic reasoning.

GPUs, with their inherent parallelism, dominate the market, processing large batches of data for high-performance workloads. NVIDIA Corporation's CUDA platform and hardware have established a strong presence, offering developers a rich ecosystem for AI workloads. Approximately 75% of AI workloads in data centers utilize GPUs for inference.

AI Inference Market Size

Request Free Sample

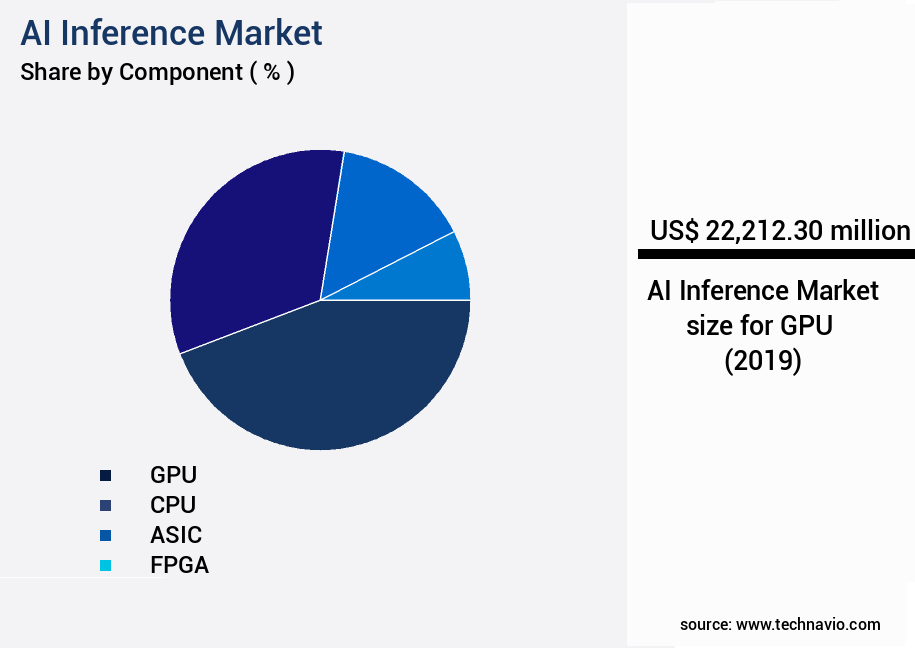
The GPU segment was valued at USD 22.21 billion in 2019 and showed a gradual increase during the forecast period.

AI Inference Market Size

Request Free Sample

Regional Analysis

North America is estimated to contribute 37% to the growth of the global market during the forecast period.Technavio's analysts have elaborately explained the regional trends and drivers that shape the market during the forecast period.

AI Inference Market Share by Geography

See How AI Inference Market Demand is Rising in North America Request Free Sample

The market is experiencing significant growth and evolution, with North America leading the global landscape. This region, comprising the United States and Canada, holds a dominant position due to a mature technological ecosystem, substantial investment, and the presence of major hyperscale cloud providers and semiconductor designers. The region benefits from a virtuous cycle, as intensive research and development efforts yield advanced hardware and software platforms, which are then swiftly adopted by a large and sophisticated customer base. Key applications of AI inference include finance, healthcare, retail, and entertainment, driven by the insatiable demand for AI services from enterprises.

According to recent estimates, the North American market share surpasses 40% of the global market, underscoring its market leadership. Furthermore, operational efficiency gains and cost reductions resulting from AI inference have been reported to reach up to 30% in certain industries.

AI Inference Market Share by Geography

 Customer Landscape of AI Inference Industry

Competitive Intelligence by Technavio Analysis: Leading Players in the AI Inference Market

Companies are implementing various strategies, such as strategic alliances, ai inference market forecast, partnerships, mergers and acquisitions, geographical expansion, and product/service launches, to enhance their presence in the industry.

Advanced Micro Devices Inc. - The company specializes in providing advanced technology solutions for artificial intelligence applications. Their product offerings include Instinct MI-series GPUs and Ryzen AI processors for client devices, accompanied by the ROCm software platform. 

The industry research and growth report includes detailed analyses of the competitive landscape of the market and information about key companies, including:

  • Advanced Micro Devices Inc.
  • Amazon Web Services Inc.
  • Apple Inc.
  • Arm Ltd.
  • Baidu Inc.
  • Databricks Inc.
  • Dell Technologies Inc.
  • Google Cloud
  • Groq Inc.
  • Hugging Face
  • Intel Corp.
  • International Business Machines Corp.
  • Meta Platforms Inc.
  • Microsoft Corp.
  • NVIDIA Corp.
  • Oracle Corp.
  • Qualcomm Inc.
  • SambaNova Systems Inc.
  • Tencent Cloud Co. Ltd.
  • Tenstorrent Inc.

Qualitative and quantitative analysis of companies has been conducted to help clients understand the wider business environment as well as the strengths and weaknesses of key industry players. Data is qualitatively analyzed to categorize companies as pure play, category-focused, industry-focused, and diversified; it is quantitatively analyzed to categorize companies as dominant, leading, strong, tentative, and weak.

Recent Development and News in AI Inference Market

  • In August 2024, Intel announced the launch of its new Neural Compute Lake (NCL) series, a family of edge AI inference chips designed to accelerate machine learning workloads at the edge. This development marked a significant stride in the market, as Intel aimed to challenge market leaders like NVIDIA and Qualcomm in the edge AI chip segment (Intel Press Release, 2024).
  • In November 2024, Google Cloud and Microsoft Azure entered into a strategic partnership to expand their AI offerings by integrating their services. This collaboration enabled seamless data transfer and interoperability between Google's AutoML and Microsoft's Azure Machine Learning services, providing customers with a more comprehensive AI solution (Microsoft and Google Press Release, 2024).
  • In March 2025, NVIDIA secured a strategic investment of USD2 billion from Samsung Electronics to expand its AI chip production capacity. This investment marked a significant milestone for NVIDIA, as it aimed to meet the growing demand for AI inference chips in various industries, including automotive, healthcare, and manufacturing (NVIDIA Press Release, 2025).
  • In May 2025, the European Union passed the Artificial Intelligence Act, which sets strict regulations for the deployment of AI systems. The Act requires companies to conduct risk assessments, implement transparency and accountability measures, and adhere to ethical guidelines. This regulatory development is expected to significantly impact the market, as companies must ensure their AI systems comply with the new regulations (European Commission Press Release, 2025).

Dive into Technavio's robust research methodology, blending expert interviews, extensive data synthesis, and validated models for unparalleled AI Inference Market insights. See full methodology.

Market Scope

Report Coverage

Details

Page number

243

Base year

2024

Historic period

2019-2023

Forecast period

2025-2029

Growth momentum & CAGR

Accelerate at a CAGR of 19.4%

Market growth 2025-2029

USD 128854 million

Market structure

Fragmented

YoY growth 2024-2025(%)

16.6

Key countries

US, China, Germany, Japan, UK, Canada, South Korea, France, Italy, and India

Competitive landscape

Leading Companies, Market Positioning of Companies, Competitive Strategies, and Industry Risks

Request Free Sample

Why Choose Technavio for AI Inference Market Insights?

"Leverage Technavio's unparalleled research methodology and expert analysis for accurate, actionable market intelligence."

The market is experiencing rapid growth as businesses increasingly adopt artificial intelligence (AI) technologies to enhance their operations. Deep learning models, a key component of AI, are being used for various applications such as image classification and natural language processing tasks. These models require significant computational power for inference, leading to the emergence of cloud-based model deployment solutions. In the realm of image classification, deep learning models have shown remarkable accuracy. However, for natural language processing tasks, knowledge graph reasoning techniques and Bayesian network inference algorithms offer a more nuanced understanding of data. Reinforcement learning applications are also gaining traction, enabling businesses to optimize their operations through intelligent decision-making. Model interpretability methods are essential for building trust in AI systems. As AI models become more complex, bias mitigation strategies become increasingly important to ensure fairness and accuracy. Transfer learning in computer vision is another significant trend, enabling faster and more efficient development of new models.

Data preprocessing for time series data is crucial for accurate AI inference. Hyperparameter tuning for neural networks is a time-consuming process, but essential for achieving optimal model performance. Model evaluation metrics comparison and statistical significance testing are important for determining the effectiveness of different AI models. A/B testing for model optimization offers a controlled approach to evaluating and improving AI models. Data governance and security best practices are essential for ensuring the ethical use of AI inference systems. Privacy-preserving machine learning techniques are becoming increasingly important as businesses collect and process sensitive data. Edge computing for AI inference offers a solution for real-time inference in video analytics, reducing latency and improving response times. API integration for AI models is simplifying the process of integrating AI into business applications. Building robust AI inference systems requires a holistic approach, encompassing all aspects of model development, deployment, and optimization. According to recent studies, the use of AI inference is projected to grow by over 30% in the next year, outpacing the growth of traditional IT infrastructure. This growth is expected to have a significant impact on supply chain optimization, compliance, and operational planning.

What are the Key Data Covered in this AI Inference Market Research and Growth Report?

  • What is the expected growth of the AI Inference Market between 2025 and 2029?

    • USD 128.85 billion, at a CAGR of 19.4%

  • What segmentation does the market report cover?

    • The report is segmented by Component (GPU, CPU, ASIC, and FPGA), Technology (Machine learning models, Generative AI, Natural language processing, and Computer vision), Deployment (Cloud, Edge, and On-premises), and Geography (North America, APAC, Europe, Middle East and Africa, and South America)

  • Which regions are analyzed in the report?

    • North America, APAC, Europe, Middle East and Africa, and South America

  • What are the key growth drivers and market challenges?

    • Proliferation of edge AI and the expansion of the Internet of Things (IoT) ecosystem, Escalating energy consumption and environmental sustainability concerns

  • Who are the major players in the AI Inference Market?

    • Advanced Micro Devices Inc., Amazon Web Services Inc., Apple Inc., Arm Ltd., Baidu Inc., Databricks Inc., Dell Technologies Inc., Google Cloud, Groq Inc., Hugging Face, Intel Corp., International Business Machines Corp., Meta Platforms Inc., Microsoft Corp., NVIDIA Corp., Oracle Corp., Qualcomm Inc., SambaNova Systems Inc., Tencent Cloud Co. Ltd., and Tenstorrent Inc.

We can help! Our analysts can customize this AI inference market research report to meet your requirements.

Get in touch

1 Executive Summary

  • 1.1 Market overview
    • Executive Summary - Chart on Market Overview
    • Executive Summary - Data Table on Market Overview
    • Executive Summary - Chart on Global Market Characteristics
    • Executive Summary - Chart on Market by Geography
    • Executive Summary - Chart on Market Segmentation by Component
    • Executive Summary - Chart on Market Segmentation by Technology
    • Executive Summary - Chart on Market Segmentation by Deployment
    • Executive Summary - Chart on Incremental Growth
    • Executive Summary - Data Table on Incremental Growth
    • Executive Summary - Chart on Company Market Positioning

2 Technavio Analysis

  • 2.1 Analysis of price sensitivity, lifecycle, customer purchase basket, adoption rates, and purchase criteria
    • Analysis of price sensitivity, lifecycle, customer purchase basket, adoption rates, and purchase criteria
  • 2.2 Criticality of inputs and Factors of differentiation
    • Overview on criticality of inputs and factors of differentiation
  • 2.3 Factors of disruption
    • Overview on factors of disruption
  • 2.4 Impact of drivers and challenges
    • Impact of drivers and challenges in 2024 and 2029

3 Market Landscape

  • 3.1 Market ecosystem
    • Parent Market
    • Data Table on - Parent Market
  • 3.2 Market characteristics
    • Market characteristics analysis
  • 3.3 Value chain analysis
    • Value chain analysis

4 Market Sizing

  • 4.1 Market definition
    • Offerings of companies included in the market definition
  • 4.2 Market segment analysis
    • Market segments
  • 4.3 Market size 2024
    • 4.4 Market outlook: Forecast for 2024-2029
      • Chart on Global - Market size and forecast 2024-2029 ($ million)
      • Data Table on Global - Market size and forecast 2024-2029 ($ million)
      • Chart on Global Market: Year-over-year growth 2024-2029 (%)
      • Data Table on Global Market: Year-over-year growth 2024-2029 (%)

    5 Historic Market Size

    • 5.1 Global AI Inference Market 2019 - 2023
      • Historic Market Size - Data Table on Global AI Inference Market 2019 - 2023 ($ million)
    • 5.2 Component segment analysis 2019 - 2023
      • Historic Market Size - Component Segment 2019 - 2023 ($ million)
    • 5.3 Technology segment analysis 2019 - 2023
      • Historic Market Size - Technology Segment 2019 - 2023 ($ million)
    • 5.4 Deployment segment analysis 2019 - 2023
      • Historic Market Size - Deployment Segment 2019 - 2023 ($ million)
    • 5.5 Geography segment analysis 2019 - 2023
      • Historic Market Size - Geography Segment 2019 - 2023 ($ million)
    • 5.6 Country segment analysis 2019 - 2023
      • Historic Market Size - Country Segment 2019 - 2023 ($ million)

    6 Five Forces Analysis

    • 6.1 Five forces summary
      • Five forces analysis - Comparison between 2024 and 2029
    • 6.2 Bargaining power of buyers
      • Bargaining power of buyers - Impact of key factors 2024 and 2029
    • 6.3 Bargaining power of suppliers
      • Bargaining power of suppliers - Impact of key factors in 2024 and 2029
    • 6.4 Threat of new entrants
      • Threat of new entrants - Impact of key factors in 2024 and 2029
    • 6.5 Threat of substitutes
      • Threat of substitutes - Impact of key factors in 2024 and 2029
    • 6.6 Threat of rivalry
      • Threat of rivalry - Impact of key factors in 2024 and 2029
    • 6.7 Market condition
      • Chart on Market condition - Five forces 2024 and 2029

    7 Market Segmentation by Component

    • 7.1 Market segments
      • Chart on Component - Market share 2024-2029 (%)
      • Data Table on Component - Market share 2024-2029 (%)
    • 7.2 Comparison by Component
      • Chart on Comparison by Component
      • Data Table on Comparison by Component
    • 7.3 GPU - Market size and forecast 2024-2029
      • Chart on GPU - Market size and forecast 2024-2029 ($ million)
      • Data Table on GPU - Market size and forecast 2024-2029 ($ million)
      • Chart on GPU - Year-over-year growth 2024-2029 (%)
      • Data Table on GPU - Year-over-year growth 2024-2029 (%)
    • 7.4 CPU - Market size and forecast 2024-2029
      • Chart on CPU - Market size and forecast 2024-2029 ($ million)
      • Data Table on CPU - Market size and forecast 2024-2029 ($ million)
      • Chart on CPU - Year-over-year growth 2024-2029 (%)
      • Data Table on CPU - Year-over-year growth 2024-2029 (%)
    • 7.5 ASIC - Market size and forecast 2024-2029
      • Chart on ASIC - Market size and forecast 2024-2029 ($ million)
      • Data Table on ASIC - Market size and forecast 2024-2029 ($ million)
      • Chart on ASIC - Year-over-year growth 2024-2029 (%)
      • Data Table on ASIC - Year-over-year growth 2024-2029 (%)
    • 7.6 FPGA - Market size and forecast 2024-2029
      • Chart on FPGA - Market size and forecast 2024-2029 ($ million)
      • Data Table on FPGA - Market size and forecast 2024-2029 ($ million)
      • Chart on FPGA - Year-over-year growth 2024-2029 (%)
      • Data Table on FPGA - Year-over-year growth 2024-2029 (%)
    • 7.7 Market opportunity by Component
      • Market opportunity by Component ($ million)
      • Data Table on Market opportunity by Component ($ million)

    8 Market Segmentation by Technology

    • 8.1 Market segments
      • Chart on Technology - Market share 2024-2029 (%)
      • Data Table on Technology - Market share 2024-2029 (%)
    • 8.2 Comparison by Technology
      • Chart on Comparison by Technology
      • Data Table on Comparison by Technology
    • 8.3 Machine learning models - Market size and forecast 2024-2029
      • Chart on Machine learning models - Market size and forecast 2024-2029 ($ million)
      • Data Table on Machine learning models - Market size and forecast 2024-2029 ($ million)
      • Chart on Machine learning models - Year-over-year growth 2024-2029 (%)
      • Data Table on Machine learning models - Year-over-year growth 2024-2029 (%)
    • 8.4 Generative AI - Market size and forecast 2024-2029
      • Chart on Generative AI - Market size and forecast 2024-2029 ($ million)
      • Data Table on Generative AI - Market size and forecast 2024-2029 ($ million)
      • Chart on Generative AI - Year-over-year growth 2024-2029 (%)
      • Data Table on Generative AI - Year-over-year growth 2024-2029 (%)
    • 8.5 Natural language processing - Market size and forecast 2024-2029
      • Chart on Natural language processing - Market size and forecast 2024-2029 ($ million)
      • Data Table on Natural language processing - Market size and forecast 2024-2029 ($ million)
      • Chart on Natural language processing - Year-over-year growth 2024-2029 (%)
      • Data Table on Natural language processing - Year-over-year growth 2024-2029 (%)
    • 8.6 Computer vision - Market size and forecast 2024-2029
      • Chart on Computer vision - Market size and forecast 2024-2029 ($ million)
      • Data Table on Computer vision - Market size and forecast 2024-2029 ($ million)
      • Chart on Computer vision - Year-over-year growth 2024-2029 (%)
      • Data Table on Computer vision - Year-over-year growth 2024-2029 (%)
    • 8.7 Market opportunity by Technology
      • Market opportunity by Technology ($ million)
      • Data Table on Market opportunity by Technology ($ million)

    9 Market Segmentation by Deployment

    • 9.1 Market segments
      • Chart on Deployment - Market share 2024-2029 (%)
      • Data Table on Deployment - Market share 2024-2029 (%)
    • 9.2 Comparison by Deployment
      • Chart on Comparison by Deployment
      • Data Table on Comparison by Deployment
    • 9.3 Cloud - Market size and forecast 2024-2029
      • Chart on Cloud - Market size and forecast 2024-2029 ($ million)
      • Data Table on Cloud - Market size and forecast 2024-2029 ($ million)
      • Chart on Cloud - Year-over-year growth 2024-2029 (%)
      • Data Table on Cloud - Year-over-year growth 2024-2029 (%)
    • 9.4 Edge - Market size and forecast 2024-2029
      • Chart on Edge - Market size and forecast 2024-2029 ($ million)
      • Data Table on Edge - Market size and forecast 2024-2029 ($ million)
      • Chart on Edge - Year-over-year growth 2024-2029 (%)
      • Data Table on Edge - Year-over-year growth 2024-2029 (%)
    • 9.5 On-premises - Market size and forecast 2024-2029
      • Chart on On-premises - Market size and forecast 2024-2029 ($ million)
      • Data Table on On-premises - Market size and forecast 2024-2029 ($ million)
      • Chart on On-premises - Year-over-year growth 2024-2029 (%)
      • Data Table on On-premises - Year-over-year growth 2024-2029 (%)
    • 9.6 Market opportunity by Deployment
      • Market opportunity by Deployment ($ million)
      • Data Table on Market opportunity by Deployment ($ million)

    10 Customer Landscape

    • 10.1 Customer landscape overview
      • Analysis of price sensitivity, lifecycle, customer purchase basket, adoption rates, and purchase criteria

    11 Geographic Landscape

    • 11.1 Geographic segmentation
      • Chart on Market share by geography 2024-2029 (%)
      • Data Table on Market share by geography 2024-2029 (%)
    • 11.2 Geographic comparison
      • Chart on Geographic comparison
      • Data Table on Geographic comparison
    • 11.3 North America - Market size and forecast 2024-2029
      • Chart on North America - Market size and forecast 2024-2029 ($ million)
      • Data Table on North America - Market size and forecast 2024-2029 ($ million)
      • Chart on North America - Year-over-year growth 2024-2029 (%)
      • Data Table on North America - Year-over-year growth 2024-2029 (%)
    • 11.4 APAC - Market size and forecast 2024-2029
      • Chart on APAC - Market size and forecast 2024-2029 ($ million)
      • Data Table on APAC - Market size and forecast 2024-2029 ($ million)
      • Chart on APAC - Year-over-year growth 2024-2029 (%)
      • Data Table on APAC - Year-over-year growth 2024-2029 (%)
    • 11.5 Europe - Market size and forecast 2024-2029
      • Chart on Europe - Market size and forecast 2024-2029 ($ million)
      • Data Table on Europe - Market size and forecast 2024-2029 ($ million)
      • Chart on Europe - Year-over-year growth 2024-2029 (%)
      • Data Table on Europe - Year-over-year growth 2024-2029 (%)
    • 11.6 Middle East and Africa - Market size and forecast 2024-2029
      • Chart on Middle East and Africa - Market size and forecast 2024-2029 ($ million)
      • Data Table on Middle East and Africa - Market size and forecast 2024-2029 ($ million)
      • Chart on Middle East and Africa - Year-over-year growth 2024-2029 (%)
      • Data Table on Middle East and Africa - Year-over-year growth 2024-2029 (%)
    • 11.7 South America - Market size and forecast 2024-2029
      • Chart on South America - Market size and forecast 2024-2029 ($ million)
      • Data Table on South America - Market size and forecast 2024-2029 ($ million)
      • Chart on South America - Year-over-year growth 2024-2029 (%)
      • Data Table on South America - Year-over-year growth 2024-2029 (%)
    • 11.8 US - Market size and forecast 2024-2029
      • Chart on US - Market size and forecast 2024-2029 ($ million)
      • Data Table on US - Market size and forecast 2024-2029 ($ million)
      • Chart on US - Year-over-year growth 2024-2029 (%)
      • Data Table on US - Year-over-year growth 2024-2029 (%)
    • 11.9 China - Market size and forecast 2024-2029
      • Chart on China - Market size and forecast 2024-2029 ($ million)
      • Data Table on China - Market size and forecast 2024-2029 ($ million)
      • Chart on China - Year-over-year growth 2024-2029 (%)
      • Data Table on China - Year-over-year growth 2024-2029 (%)
    • 11.10 Germany - Market size and forecast 2024-2029
      • Chart on Germany - Market size and forecast 2024-2029 ($ million)
      • Data Table on Germany - Market size and forecast 2024-2029 ($ million)
      • Chart on Germany - Year-over-year growth 2024-2029 (%)
      • Data Table on Germany - Year-over-year growth 2024-2029 (%)
    • 11.11 Japan - Market size and forecast 2024-2029
      • Chart on Japan - Market size and forecast 2024-2029 ($ million)
      • Data Table on Japan - Market size and forecast 2024-2029 ($ million)
      • Chart on Japan - Year-over-year growth 2024-2029 (%)
      • Data Table on Japan - Year-over-year growth 2024-2029 (%)
    • 11.12 UK - Market size and forecast 2024-2029
      • Chart on UK - Market size and forecast 2024-2029 ($ million)
      • Data Table on UK - Market size and forecast 2024-2029 ($ million)
      • Chart on UK - Year-over-year growth 2024-2029 (%)
      • Data Table on UK - Year-over-year growth 2024-2029 (%)
    • 11.13 Canada - Market size and forecast 2024-2029
      • Chart on Canada - Market size and forecast 2024-2029 ($ million)
      • Data Table on Canada - Market size and forecast 2024-2029 ($ million)
      • Chart on Canada - Year-over-year growth 2024-2029 (%)
      • Data Table on Canada - Year-over-year growth 2024-2029 (%)
    • 11.14 South Korea - Market size and forecast 2024-2029
      • Chart on South Korea - Market size and forecast 2024-2029 ($ million)
      • Data Table on South Korea - Market size and forecast 2024-2029 ($ million)
      • Chart on South Korea - Year-over-year growth 2024-2029 (%)
      • Data Table on South Korea - Year-over-year growth 2024-2029 (%)
    • 11.15 France - Market size and forecast 2024-2029
      • Chart on France - Market size and forecast 2024-2029 ($ million)
      • Data Table on France - Market size and forecast 2024-2029 ($ million)
      • Chart on France - Year-over-year growth 2024-2029 (%)
      • Data Table on France - Year-over-year growth 2024-2029 (%)
    • 11.16 India - Market size and forecast 2024-2029
      • Chart on India - Market size and forecast 2024-2029 ($ million)
      • Data Table on India - Market size and forecast 2024-2029 ($ million)
      • Chart on India - Year-over-year growth 2024-2029 (%)
      • Data Table on India - Year-over-year growth 2024-2029 (%)
    • 11.17 Italy - Market size and forecast 2024-2029
      • Chart on Italy - Market size and forecast 2024-2029 ($ million)
      • Data Table on Italy - Market size and forecast 2024-2029 ($ million)
      • Chart on Italy - Year-over-year growth 2024-2029 (%)
      • Data Table on Italy - Year-over-year growth 2024-2029 (%)
    • 11.18 Market opportunity by geography
      • Market opportunity by geography ($ million)
      • Data Tables on Market opportunity by geography ($ million)

    12 Drivers, Challenges, and Opportunity/Restraints

    • 12.1 Market drivers
      • 12.2 Market challenges
        • 12.3 Impact of drivers and challenges
          • Impact of drivers and challenges in 2024 and 2029
        • 12.4 Market opportunities/restraints

          13 Competitive Landscape

          • 13.1 Overview
            • 13.2 Competitive Landscape
              • Overview on criticality of inputs and factors of differentiation
            • 13.3 Landscape disruption
              • Overview on factors of disruption
            • 13.4 Industry risks
              • Impact of key risks on business

            14 Competitive Analysis

            • 14.1 Companies profiled
              • Companies covered
            • 14.2 Company ranking index
              • Company ranking index
            • 14.3 Market positioning of companies
              • Matrix on companies position and classification
            • 14.4 Advanced Micro Devices Inc.
              • Advanced Micro Devices Inc. - Overview
              • Advanced Micro Devices Inc. - Business segments
              • Advanced Micro Devices Inc. - Key news
              • Advanced Micro Devices Inc. - Key offerings
              • Advanced Micro Devices Inc. - Segment focus
              • SWOT
            • 14.5 Amazon Web Services Inc.
              • Amazon Web Services Inc. - Overview
              • Amazon Web Services Inc. - Product / Service
              • Amazon Web Services Inc. - Key news
              • Amazon Web Services Inc. - Key offerings
              • SWOT
            • 14.6 Apple Inc.
              • Apple Inc. - Overview
              • Apple Inc. - Business segments
              • Apple Inc. - Key news
              • Apple Inc. - Key offerings
              • Apple Inc. - Segment focus
              • SWOT
            • 14.7 Arm Ltd.
              • Arm Ltd. - Overview
              • Arm Ltd. - Product / Service
              • Arm Ltd. - Key offerings
              • SWOT
            • 14.8 Databricks Inc.
              • Databricks Inc. - Overview
              • Databricks Inc. - Product / Service
              • Databricks Inc. - Key offerings
              • SWOT
            • 14.9 Google Cloud
              • Google Cloud - Overview
              • Google Cloud - Product / Service
              • Google Cloud - Key offerings
              • SWOT
            • 14.10 Groq Inc.
              • Groq Inc. - Overview
              • Groq Inc. - Product / Service
              • Groq Inc. - Key offerings
              • SWOT
            • 14.11 Hugging Face
              • Hugging Face - Overview
              • Hugging Face - Product / Service
              • Hugging Face - Key offerings
              • SWOT
            • 14.12 Intel Corp.
              • Intel Corp. - Overview
              • Intel Corp. - Business segments
              • Intel Corp. - Key news
              • Intel Corp. - Key offerings
              • Intel Corp. - Segment focus
              • SWOT
            • 14.13 International Business Machines Corp.
              • International Business Machines Corp. - Overview
              • International Business Machines Corp. - Business segments
              • International Business Machines Corp. - Key news
              • International Business Machines Corp. - Key offerings
              • International Business Machines Corp. - Segment focus
              • SWOT
            • 14.14 Meta Platforms Inc.
              • Meta Platforms Inc. - Overview
              • Meta Platforms Inc. - Business segments
              • Meta Platforms Inc. - Key offerings
              • Meta Platforms Inc. - Segment focus
              • SWOT
            • 14.15 Microsoft Corp.
              • Microsoft Corp. - Overview
              • Microsoft Corp. - Business segments
              • Microsoft Corp. - Key news
              • Microsoft Corp. - Key offerings
              • Microsoft Corp. - Segment focus
              • SWOT
            • 14.16 NVIDIA Corp.
              • NVIDIA Corp. - Overview
              • NVIDIA Corp. - Business segments
              • NVIDIA Corp. - Key news
              • NVIDIA Corp. - Key offerings
              • NVIDIA Corp. - Segment focus
              • SWOT
            • 14.17 Qualcomm Inc.
              • Qualcomm Inc. - Overview
              • Qualcomm Inc. - Business segments
              • Qualcomm Inc. - Key news
              • Qualcomm Inc. - Key offerings
              • Qualcomm Inc. - Segment focus
              • SWOT
            • 14.18 SambaNova Systems Inc.
              • SambaNova Systems Inc. - Overview
              • SambaNova Systems Inc. - Product / Service
              • SambaNova Systems Inc. - Key offerings
              • SWOT

            15 Appendix

            • 15.1 Scope of the report
              • 15.2 Inclusions and exclusions checklist
                • Inclusions checklist
                • Exclusions checklist
              • 15.3 Currency conversion rates for US$
                • Currency conversion rates for US$
              • 15.4 Research methodology
                • Research methodology
              • 15.5 Data procurement
                • Information sources
              • 15.6 Data validation
                • Data validation
              • 15.7 Validation techniques employed for market sizing
                • Validation techniques employed for market sizing
              • 15.8 Data synthesis
                • Data synthesis
              • 15.9 360 degree market analysis
                • 360 degree market analysis
              • 15.10 List of abbreviations
                • List of abbreviations

              Research Methodology

              Technavio presents a detailed picture of the market by way of study, synthesis, and summation of data from multiple sources. The analysts have presented the various facets of the market with a particular focus on identifying the key industry influencers. The data thus presented is comprehensive, reliable, and the result of extensive research, both primary and secondary.

              INFORMATION SOURCES

              Primary sources

              • Manufacturers and suppliers
              • Channel partners
              • Industry experts
              • Strategic decision makers

              Secondary sources

              • Industry journals and periodicals
              • Government data
              • Financial reports of key industry players
              • Historical data
              • Press releases

              DATA ANALYSIS

              Data Synthesis

              • Collation of data
              • Estimation of key figures
              • Analysis of derived insights

              Data Validation

              • Triangulation with data models
              • Reference against proprietary databases
              • Corroboration with industry experts

              REPORT WRITING

              Qualitative

              • Market drivers
              • Market challenges
              • Market trends
              • Five forces analysis

              Quantitative

              • Market size and forecast
              • Market segmentation
              • Geographical insights
              • Competitive landscape

              Interested in this report?

              Get your sample now to see our research methodology and insights!

              Download Now

              Frequently Asked Questions

              Ai Inference market growth will increase by $ 128854 mn during 2025-2029 .

              The Ai Inference market is expected to grow at a CAGR of 19.4% during 2025-2029 .

              Ai Inference market is segmented by Component( GPU, CPU, ASIC, FPGA) Technology( Machine learning models, Generative AI, Natural language processing, Computer vision) Deployment( Cloud, Edge, On-premises)

              Advanced Micro Devices Inc., Amazon Web Services Inc., Apple Inc., Arm Ltd., Baidu Inc., Databricks Inc., Dell Technologies Inc., Google Cloud, Groq Inc., Hugging Face, Intel Corp., International Business Machines Corp., Meta Platforms Inc., Microsoft Corp., NVIDIA Corp., Oracle Corp., Qualcomm Inc., SambaNova Systems Inc., Tencent Cloud Co. Ltd., Tenstorrent Inc. are a few of the key vendors in the Ai Inference market.

              North America will register the highest growth rate of 37% among the other regions. Therefore, the Ai Inference market in North America is expected to garner significant business opportunities for the vendors during the forecast period.

              US, China, Germany, Japan, UK, Canada, South Korea, France, Italy, India

              • Proliferation of edge AI and the expansion of the Internet of Things (IoT) ecosystemA primary driver propelling the global AI inference market is the exponential growth of edge computing is the driving factor this market.
              • inextricably linked to the expanding Internet of Things (IoT) ecosystem. The paradigm shift from centralized is the driving factor this market.
              • cloud-based processing to decentralized is the driving factor this market.
              • on-device inference is not a speculative trend but a market reality dictated by fundamental needs for reduced latency is the driving factor this market.
              • enhanced data privacy is the driving factor this market.
              • and improved operational efficiency. As billions of devices is the driving factor this market.
              • ranging from consumer smartphones and wearables to industrial sensors and autonomous vehicles is the driving factor this market.
              • become increasingly intelligent is the driving factor this market.
              • the demand for processing data locally at the point of creation has become paramount. This requirement obviates the need for constant communication with a central server is the driving factor this market.
              • which is often impractical due to bandwidth limitations is the driving factor this market.
              • network instability is the driving factor this market.
              • or the critical need for real time decision making. For applications such as autonomous driving is the driving factor this market.
              • robotic surgery is the driving factor this market.
              • or factory floor automation is the driving factor this market.
              • the milliseconds of delay incurred by a round trip to the cloud can have catastrophic consequences. Consequently is the driving factor this market.
              • embedding powerful yet efficient inference capabilities directly into edge devices is transitioning from a value added feature to a core operational necessity. This decentralization fosters a more resilient and responsive technological environment is the driving factor this market.
              • significantly expanding the addressable market for specialized AI inference hardware and software solutions. The regions of North America and Europe are at the forefront of this movement is the driving factor this market.
              • driven by advanced telecommunications infrastructure and heavy investment in Industry 4.0 and smart city initiatives. For instance is the driving factor this market.
              • the deployment of 5G networks provides the high bandwidth and low latency connectivity that complements edge AI is the driving factor this market.
              • allowing devices to handle most inference tasks locally while still being able to communicate complex or aggregated data when necessary. This symbiotic relationship between edge computing and advanced networks is creating fertile ground for innovation in inference technologies. A clear instance of this trend is the strategic direction of major semiconductor companies. In October 2023 is the driving factor this market.
              • Qualcomm Technologies Inc. unveiled its Snapdragon 8 Gen 3 Mobile Platform is the driving factor this market.
              • which was explicitly engineered to support on-device generative AI. The platform demonstrated the capability to run large language models with over ten billion parameters directly on a smartphone is the driving factor this market.
              • a feat that showcases the dramatic increase in edge inference performance. This development signals a market shift where complex AI tasks is the driving factor this market.
              • previously confined to data centers is the driving factor this market.
              • are becoming standard features on consumer electronics. Similarly is the driving factor this market.
              • in December 2023 is the driving factor this market.
              • Intel Corporation launched its Core Ultra processors is the driving factor this market.
              • the first from the company to feature an integrated neural processing unit (NPU). The inclusion of an NPU is a direct response to the growing demand for efficient AI acceleration on personal computers is the driving factor this market.
              • enabling applications like real time language translation and advanced video conferencing effects to run locally without draining battery life or consuming internet bandwidth. Furthermore is the driving factor this market.
              • in the automotive and robotics sectors is the driving factor this market.
              • NVIDIA continued its push toward the edge. In March 2024 is the driving factor this market.
              • NVIDIA announced Jetson Thor is the driving factor this market.
              • a new robotics computer designed for autonomous vehicles and machines. This system is capable of performing the massive number of computations per second required for safe and effective real time inference is the driving factor this market.
              • processing data from a multitude of sensors to navigate complex environments. These instances collectively illustrate a powerful market driver: the architectural shift toward the edge is creating a massive and sustained demand for specialized is the driving factor this market.
              • power efficient is the driving factor this market.
              • and high performance inference solutions across a diverse range of industries and applications. is the driving factor this market.

              The Ai Inference market vendors should focus on grabbing business opportunities from the GPU segment as it accounted for the largest market share in the base year.