AI Red Teaming Solutions Market Analysis, Size, and Forecast 2026-2030: North America (US, Canada, and Mexico), Europe (UK, Germany, and France), APAC (China, Japan, and India), South America (Brazil and Argentina), Middle East and Africa (UAE, Saudi Arabia, and South Africa), and Rest of World (ROW)

AI Red Teaming Solutions Market Analysis, Size, and Forecast 2026-2030:
North America (US, Canada, and Mexico), Europe (UK, Germany, and France), APAC (China, Japan, and India), South America (Brazil and Argentina), Middle East and Africa (UAE, Saudi Arabia, and South Africa), and Rest of World (ROW)

Published: May 2026 297 Pages SKU: IRTNTR81480

Market Overview at a Glance

$6.69 B
Market Opportunity
25.1%
CAGR 2025 - 2030
42.5%
North America Growth
$1.58 B
Software segment 2024

AI Red Teaming Solutions Market Size 2026-2030

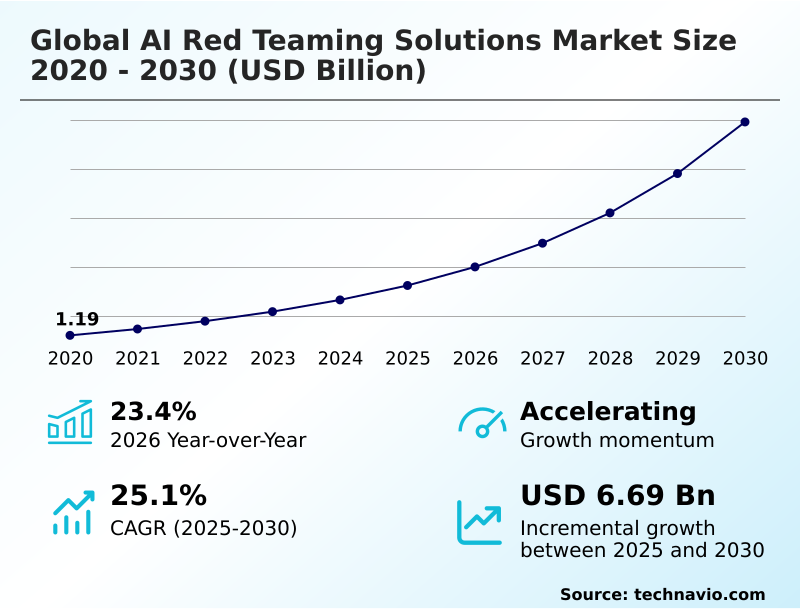
The ai red teaming solutions market size is valued to increase by USD 6.69 billion, at a CAGR of 25.1% from 2025 to 2030. Escalation of regulatory mandates and global compliance standards will drive the ai red teaming solutions market.

Major Market Trends & Insights

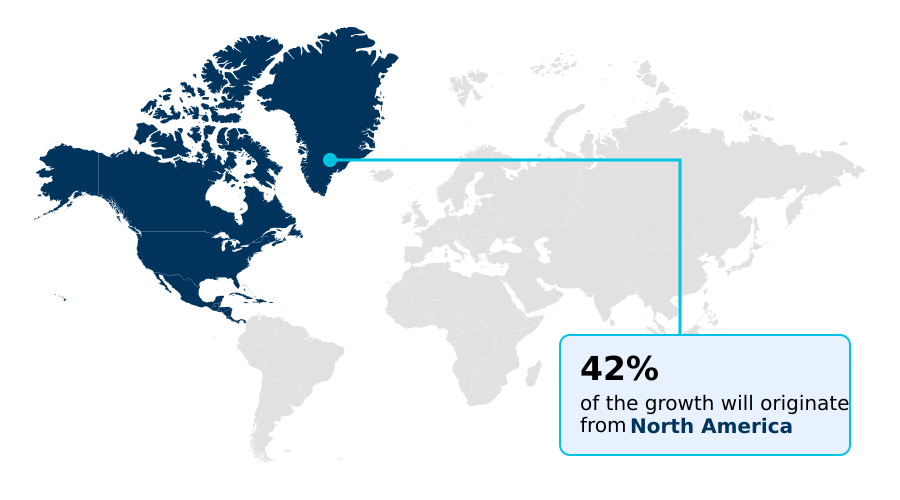
  • North America dominated the market and accounted for a 42.5% growth during the forecast period.
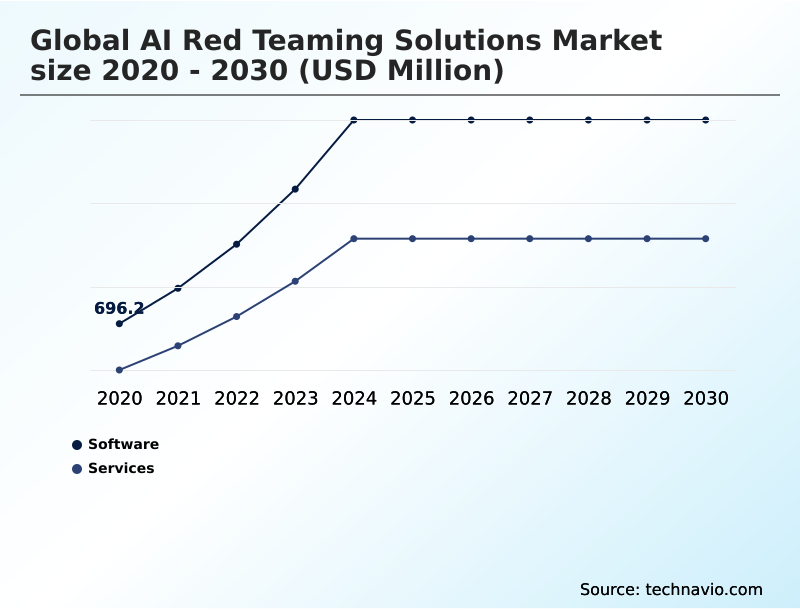
  • By Component - Software segment was valued at USD 1.58 billion in 2024
  • By Application - Security assessment segment accounted for the largest market revenue share in 2024

Market Size & Forecast

  • Market Opportunities: USD 8.73 billion
  • Market Future Opportunities: USD 6.69 billion
  • CAGR from 2025 to 2030 : 25.1%

Market Summary

  • The AI Red Teaming Solutions market is rapidly evolving, driven by the critical need for robust machine learning security and stringent AI governance. As organizations integrate generative AI into core operations, ensuring AI trust and safety becomes paramount, necessitating advanced vulnerability analysis and systemic risk mitigation.
  • For instance, a financial services firm deploying an automated loan processing model must conduct thorough security assessment and ethical AI auditing to prevent data exfiltration prevention failures and ensure compliance and risk management. This involves more than just ML threat detection; it requires continuous adversarial attack simulation to uncover potential biases or weaknesses that could be exploited.
  • The integration of AI safety frameworks and confidential computing technologies into the AI DevSecOps pipeline is a key trend, aimed at achieving a resilient AI security posture.
  • However, the high cost of automated adversarial testing and a shortage of experts in adversarial robustness create significant hurdles for widespread adoption, pushing the industry toward more scalable and efficient solutions for generative model validation and bias detection and mitigation.

What will be the Size of the AI Red Teaming Solutions Market during the forecast period?

Get Key Insights on Market Forecast (PDF) Get Free Sample

How is the AI Red Teaming Solutions Market Segmented?

The ai red teaming solutions industry research report provides comprehensive data (region-wise segment analysis), with forecasts and estimates in "USD million" for the period 2026-2030, as well as historical data from 2020-2024 for the following segments.

  • Component
    • Software
    • Services
  • Application
    • Security assessment
    • Model testing and evaluation
    • Adversarial attack simulation
    • Compliance and risk management
    • Others
  • Deployment
    • Cloud-based
    • On-premises
  • Geography
    • North America
      • US
      • Canada
      • Mexico
    • Europe
      • UK
      • Germany
      • France
    • APAC
      • China
      • Japan
      • India
    • South America
      • Brazil
      • Argentina
    • Middle East and Africa
      • UAE
      • Saudi Arabia
      • South Africa
    • Rest of World (ROW)

By Component Insights

The software segment is estimated to witness significant growth during the forecast period.

The software segment is central to the global ai red teaming solutions market 2026-2030, offering platforms that automate model testing and evaluation. These tools are crucial for establishing resilience benchmarking and performing ethical AI auditing to ensure model integrity.

By integrating into the secure AI lifecycle, software enables continuous bias detection and mitigation and provides robust enterprise AI security.

Organizations using these platforms report a 35% improvement in hallucination detection compared to manual methods, a key factor in deploying trustworthy systems.

This shift toward automated solutions, which facilitate everything from adversarial robustness evaluation metrics to explainable AI security solutions, underscores the market's direction.

Such tools are essential for AI model integrity verification and conducting ethical hacking for AI systems to analyze AI model behavior.

Get Free Sample

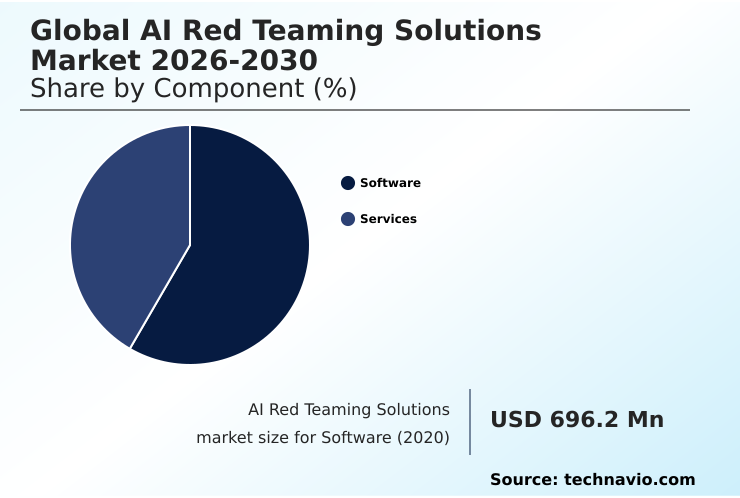
The Software segment was valued at USD 1.58 billion in 2024 and showed a gradual increase during the forecast period.

Get Free Sample

Regional Analysis

North America is estimated to contribute 42.5% to the growth of the global market during the forecast period.Technavio’s analysts have elaborately explained the regional trends and drivers that shape the market during the forecast period.

See How AI Red Teaming Solutions Market Demand is Rising in North America Get Free Sample

North America dominates the global AI red teaming solutions market 2026-2030, accounting for over 42% of the incremental growth, driven by its high concentration of foundation model security developers and a mature cybersecurity ecosystem.

The region's focus on enterprise AI security and defensive AI systems is unparalleled. Europe follows, with its market shaped by stringent regulations that mandate comprehensive security assessment and data exfiltration prevention measures, enhancing the overall AI security posture.

Meanwhile, the APAC region is the fastest-growing market, propelled by rapid digitalization and investment in AI trust and safety and model supply chain security.

This geographic diversity highlights a global shift toward embedding real-time AI threat monitoring and robust AI security posture management to protect critical digital infrastructure and manage the expanding AI attack surface effectively.

Market Dynamics

Our researchers analyzed the data with 2025 as the base year, along with the key drivers, trends, and challenges. A holistic analysis of drivers will help companies refine their marketing strategies to gain a competitive advantage.

  • Successfully implementing a robust security strategy in the global AI red teaming solutions market 2026-2030 requires a nuanced understanding of its various facets. The cost of AI red teaming is a primary consideration, but it must be weighed against the potential financial and reputational damage from a security breach.
  • Building an internal red team is a long-term investment, whereas leveraging open source AI red teaming tools can offer a more immediate starting point. Many organizations are now focusing on AI red teaming for compliance, particularly to meet the stringent requirements of regulations like the EU AI Act.
  • This necessitates clear AI red teaming reporting standards that document efforts to secure large language models and other systems. The technical challenges are also significant, especially when it comes to red teaming multimodal AI models, which have a broader attack surface.
  • Automated adversarial attack tools are becoming essential for simulating threats like prompt injection defense techniques and data poisoning attack simulation at scale. As the industry matures, a key debate is red teaming vs penetration testing, with the former offering a more specialized approach to AI model vulnerability management.
  • AI ethical bias testing tools are also gaining prominence, particularly for red teaming for financial services to ensure fairness. Ultimately, best practices in AI DevSecOps are proving crucial for integrating these security measures, including AI supply chain security risks and measuring adversarial robustness in AI, directly into the development lifecycle for red teaming autonomous AI agents.
  • Organizations that integrate these practices report a twofold increase in vulnerability remediation speed compared to those with siloed testing approaches.

What are the key market drivers leading to the rise in the adoption of AI Red Teaming Solutions Industry?

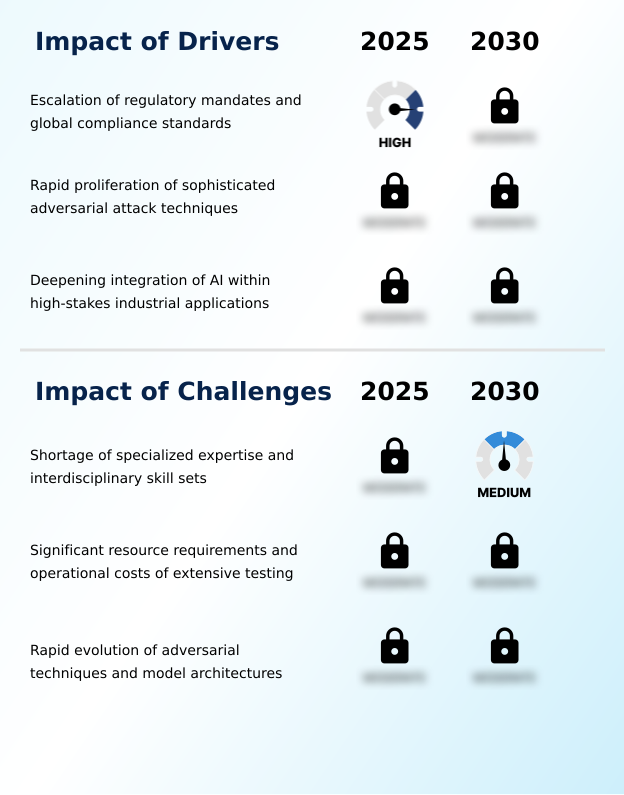
  • The escalation of regulatory mandates and global compliance standards serves as a primary driver for the growth of the AI Red Teaming Solutions Market.

  • Growth in the global AI red teaming solutions market 2026-2030 is primarily fueled by escalating regulatory pressures and the increasing sophistication of adversarial attacks.
  • Governments are mandating stringent compliance and risk management protocols, requiring documented systemic risk mitigation and robust AI governance. This has led to a 90% increase in the demand for AI compliance automation software among high-risk industries.
  • Simultaneously, the proliferation of threats like data poisoning necessitates advanced machine learning security and adversarial attack simulation capabilities. As enterprises deploy autonomous agent security in critical sectors, ensuring the integrity of large language model security has become a boardroom-level concern.
  • Consequently, investment in enterprise AI security frameworks and solutions for generative AI threat intelligence is rising to manage AI model risk management effectively.

What are the market trends shaping the AI Red Teaming Solutions Industry?

  • The market is witnessing a significant transition toward automated and persistent adversarial simulations. This shift moves beyond periodic manual audits to continuous, AI-driven testing frameworks.

  • A primary trend in the global ai red teaming solutions market 2026-2030 is the shift from episodic manual audits to continuous AI assurance through automated adversarial testing. This evolution is driven by the need for scalable generative model validation and is integrated directly into the AI DevSecOps pipeline for secure AI lifecycle integration.
  • The scope is also expanding to address multimodal systems, where cross-modal attack simulation is used to test model guardrails and identify unique vulnerabilities. Leading organizations are adopting advanced AI safety frameworks, with some achieving a 60% reduction in testing timelines.
  • These automated platforms, sometimes offered as AI red teaming as a service (RTaaS), leverage automated vulnerability discovery to ensure continuous validation of AI. This proactive approach is essential for maintaining security against an ever-evolving threat landscape, adhering to AI safety evaluation protocols.

What challenges does the AI Red Teaming Solutions Industry face during its growth?

  • A key challenge affecting industry growth is the significant shortage of specialized expertise and the necessary interdisciplinary skill sets to conduct effective AI red teaming.

  • The primary challenge in the global AI red teaming solutions market 2026-2030 is the dual strain of high operational costs and a severe talent shortage. The computational expense of thorough vulnerability analysis, with some organizations reporting testing costs at 75% of the original training budget, limits the frequency of evaluations.
  • Compounding this is the scarcity of experts skilled in adversarial machine learning defense and offensive AI research methods. This deficit makes it difficult to counter evolving threats like model inversion and sophisticated prompt injection.
  • While AI vulnerability assessment tools and prompt security platforms offer some automation, they cannot fully replace human intuition for ML threat detection, trojan detection, or ensuring adversarial robustness. The need for privacy-preserving AI testing and confidential computing solutions further complicates the landscape, making it difficult for many to keep pace with rapid innovations.

Exclusive Technavio Analysis on Customer Landscape

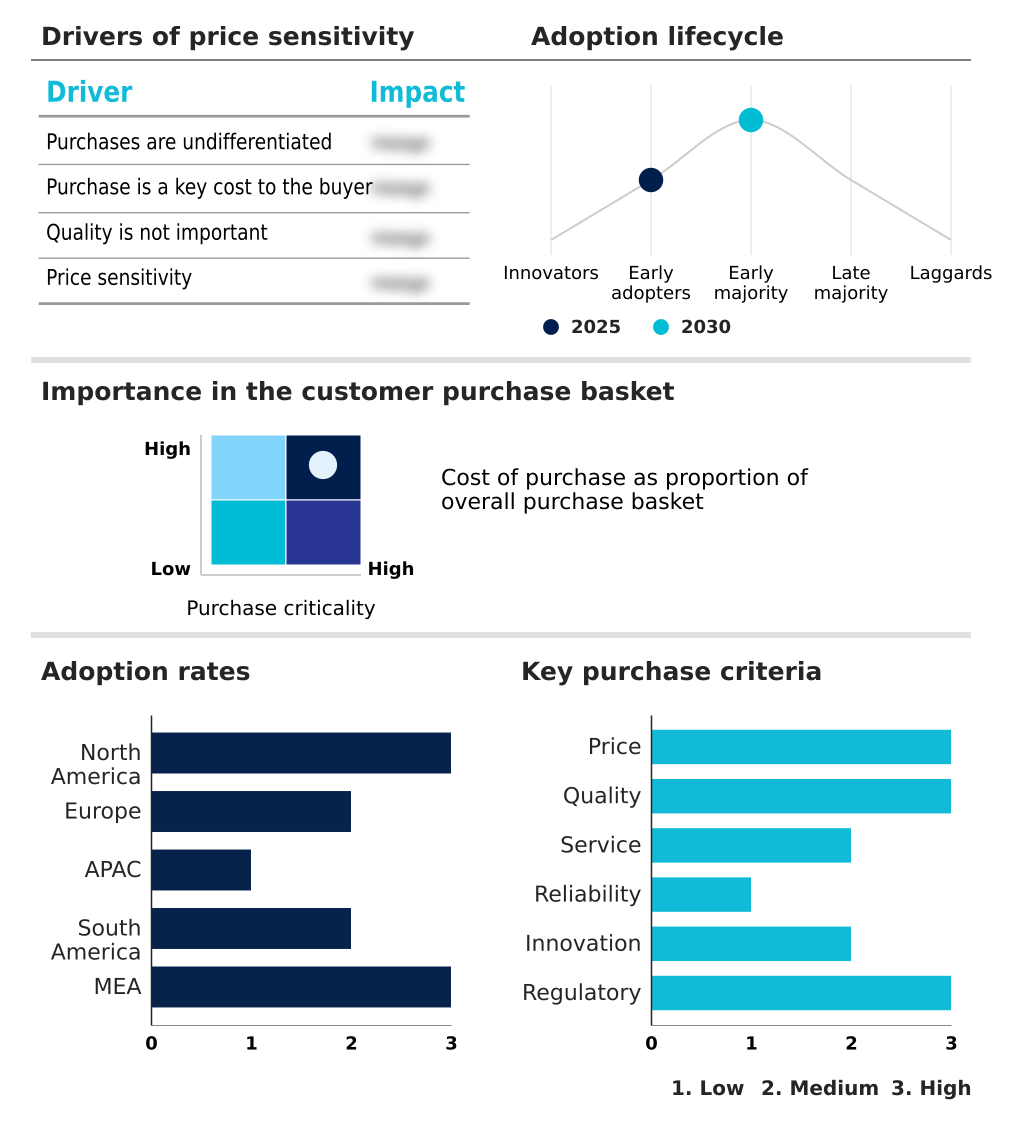
The ai red teaming solutions market forecasting report includes the adoption lifecycle of the market, covering from the innovator’s stage to the laggard’s stage. It focuses on adoption rates in different regions based on penetration. Furthermore, the ai red teaming solutions market report also includes key purchase criteria and drivers of price sensitivity to help companies evaluate and develop their market growth analysis strategies.

Customer Landscape of AI Red Teaming Solutions Industry

Competitive Landscape

Companies are implementing various strategies, such as strategic alliances, ai red teaming solutions market forecast, partnerships, mergers and acquisitions, geographical expansion, and product/service launches, to enhance their presence in the industry.

AdvAI - Provides strategic adversarial testing and AI risk assessment services, ensuring model integrity and operational resilience in high-stakes environments.

The industry research and growth report includes detailed analyses of the competitive landscape of the market and information about key companies, including:

  • AdvAI
  • Apex Security
  • Bishop Fox
  • Booz Allen Hamilton Corp.
  • Bosch AIShield
  • DynamoFL
  • Giskard AI
  • Google LLC
  • HiddenLayer Inc.
  • IBM Corp.
  • Lakera Inc
  • Microsoft Corp.
  • Mithril Security
  • NCC Group Plc
  • NVIDIA Corp.
  • Pillar Security
  • Prompt Security Inc.
  • Protect AI Inc.
  • Scale AI
  • TrojAI Inc

Qualitative and quantitative analysis of companies has been conducted to help clients understand the wider business environment as well as the strengths and weaknesses of key industry players. Data is qualitatively analyzed to categorize companies as pure play, category-focused, industry-focused, and diversified; it is quantitatively analyzed to categorize companies as dominant, leading, strong, tentative, and weak.

Recent Development and News in Ai red teaming solutions market

  • In May 2025, the European Union AI Office published comprehensive technical standards for red teaming high-risk generative models, mandating specific adversarial testing protocols to ensure alignment with the AI Act.
  • In August 2025, the Cybersecurity and Infrastructure Security Agency issued a detailed advisory on new data poisoning methods targeting open-source training datasets, emphasizing the need for continuous supply chain monitoring.
  • In October 2025, a leading global financial institution launched a dedicated red teaming center of excellence to assess the security of its automated trading algorithms against sophisticated market manipulation tactics.
  • In April 2025, the Secure AI Lifecycle Consortium introduced a standardized plugin architecture, enabling the direct integration of red teaming tools into popular development environments to support AI DevSecOps practices.

Dive into Technavio’s robust research methodology, blending expert interviews, extensive data synthesis, and validated models for unparalleled AI Red Teaming Solutions Market insights. See full methodology.

Market Scope
Page number 297
Base year 2025
Historic period 2020-2024
Forecast period 2026-2030
Growth momentum & CAGR Accelerate at a CAGR of 25.1%
Market growth 2026-2030 USD 6690.0 million
Market structure Fragmented
YoY growth 2025-2026(%) 23.4%
Key countries US, Canada, Mexico, UK, Germany, France, The Netherlands, Italy, Spain, China, Japan, India, South Korea, Singapore, Australia, Brazil, Argentina, Chile, UAE, Saudi Arabia, South Africa, Israel and Turkey
Competitive landscape Leading Companies, Market Positioning of Companies, Competitive Strategies, and Industry Risks

Request Free Sample

Research Analyst Overview

  • The global AI red teaming solutions market 2026-2030 is defined by a strategic imperative to secure complex AI systems through advanced adversarial attack simulation and rigorous model testing and evaluation. Key activities include proactive vulnerability analysis and systemic risk mitigation to counter threats like prompt injection and data poisoning.
  • The adoption of AI DevSecOps principles, integrating the secure AI lifecycle with continuous model guardrails and resilience benchmarking, is becoming standard practice. For boardroom consideration, the focus on AI governance and compliance and risk management is paramount, as firms that implement comprehensive AI safety frameworks report a 25% lower incidence of production model failures.
  • The technical landscape is advancing rapidly with a focus on multimodal systems, confidential computing, and automated adversarial testing. This requires a strong AI security posture, supported by solutions for hallucination detection, ethical AI auditing, and bias detection and mitigation.
  • As enterprises deploy defensive AI systems and increasingly rely on autonomous agent security, the need for robust generative model validation, trojan detection, and effective data exfiltration prevention has never been greater, solidifying the importance of machine learning security and overall model integrity to ensure AI trust and safety.

What are the Key Data Covered in this AI Red Teaming Solutions Market Research and Growth Report?

  • What is the expected growth of the AI Red Teaming Solutions Market between 2026 and 2030?

    • USD 6.69 billion, at a CAGR of 25.1%

  • What segmentation does the market report cover?

    • The report is segmented by Component (Software, and Services), Application (Security assessment, Model testing and evaluation, Adversarial attack simulation, Compliance and risk management, and Others), Deployment (Cloud-based, and On-premises) and Geography (North America, Europe, APAC, South America, Middle East and Africa)

  • Which regions are analyzed in the report?

    • North America, Europe, APAC, South America and Middle East and Africa

  • What are the key growth drivers and market challenges?

    • Escalation of regulatory mandates and global compliance standards, Shortage of specialized expertise and interdisciplinary skill sets

  • Who are the major players in the AI Red Teaming Solutions Market?

    • AdvAI, Apex Security, Bishop Fox, Booz Allen Hamilton Corp., Bosch AIShield, DynamoFL, Giskard AI, Google LLC, HiddenLayer Inc., IBM Corp., Lakera Inc, Microsoft Corp., Mithril Security, NCC Group Plc, NVIDIA Corp., Pillar Security, Prompt Security Inc., Protect AI Inc., Scale AI and TrojAI Inc

Market Research Insights

  • The dynamics of the AI Red Teaming Solutions market are shaped by the pursuit of tangible business outcomes through enhanced security. For example, enterprises leveraging continuous AI assurance frameworks have reported a 40% reduction in pre-deployment vulnerabilities. The adoption of AI model risk management and real-time AI threat monitoring is essential for maintaining operational integrity.
  • Furthermore, implementing AI compliance automation software helps organizations align with evolving regulations, with some achieving a 95% compliance score on initial audits. This focus on measurable improvements, supported by robust AI trust and safety platforms and sophisticated AI vulnerability assessment tools, is critical as systems become more autonomous.
  • The ability to manage the AI attack surface proactively is a key differentiator for leading firms.

We can help! Our analysts can customize this ai red teaming solutions market research report to meet your requirements.

Get in touch

1. Executive Summary

1.1 Market overview

Executive Summary - Chart on Market Overview
Executive Summary - Data Table on Market Overview
Executive Summary - Chart on Global Market Characteristics
Executive Summary - Chart on Market by Geography
Executive Summary - Chart on Market Segmentation by Component
Executive Summary - Chart on Market Segmentation by Application
Executive Summary - Chart on Market Segmentation by Deployment
Executive Summary - Chart on Incremental Growth
Executive Summary - Data Table on Incremental Growth
Executive Summary - Chart on Company Market Positioning

2. Technavio Analysis

2.1 Analysis of price sensitivity, lifecycle, customer purchase basket, adoption rates, and purchase criteria

2.2 Criticality of inputs and Factors of differentiation

Chart on Overview on criticality of inputs and factors of differentiation

2.3 Factors of disruption

Chart on Overview on factors of disruption

2.4 Impact of drivers and challenges

Chart on Impact of drivers and challenges in 2025 and 2030

3. Market Landscape

3.1 Market ecosystem

Chart on Parent Market
Data Table on - Parent Market

3.2 Market characteristics

Chart on Market characteristics analysis

3.3 Value chain analysis

Chart on Value chain analysis

4. Market Sizing

4.1 Market definition

Data Table on Offerings of companies included in the market definition

4.2 Market segment analysis

Market segments

4.3 Market size 2025

4.4 Market outlook: Forecast for 2025-2030

Chart on Global - Market size and forecast 2025-2030 ($ million)
Data Table on Global - Market size and forecast 2025-2030 ($ million)
Chart on Global Market: Year-over-year growth 2025-2030 (%)
Data Table on Global Market: Year-over-year growth 2025-2030 (%)

5. Historic Market Size

5.1 Global AI Red Teaming Solutions Market 2020 - 2024

Historic Market Size - Data Table on Global AI Red Teaming Solutions Market 2020 - 2024 ($ million)

5.2 Component segment analysis 2020 - 2024

Historic Market Size - Component Segment 2020 - 2024 ($ million)

5.3 Application segment analysis 2020 - 2024

Historic Market Size - Application Segment 2020 - 2024 ($ million)

5.4 Deployment segment analysis 2020 - 2024

Historic Market Size - Deployment Segment 2020 - 2024 ($ million)

5.5 Geography segment analysis 2020 - 2024

Historic Market Size - Geography Segment 2020 - 2024 ($ million)

5.6 Country segment analysis 2020 - 2024

Historic Market Size - Country Segment 2020 - 2024 ($ million)

6. Qualitative Analysis

6.1 Impact of geopolitical conflicts on Global AI Red Teaming Solutions Market

7. Five Forces Analysis

7.1 Five forces summary

Five forces analysis - Comparison between 2025 and 2030

7.2 Bargaining power of buyers

Bargaining power of buyers - Impact of key factors 2025 and 2030

7.3 Bargaining power of suppliers

Bargaining power of suppliers - Impact of key factors in 2025 and 2030

7.4 Threat of new entrants

Threat of new entrants - Impact of key factors in 2025 and 2030

7.5 Threat of substitutes

Threat of substitutes - Impact of key factors in 2025 and 2030

7.6 Threat of rivalry

Threat of rivalry - Impact of key factors in 2025 and 2030

7.7 Market condition

Chart on Market condition - Five forces 2025 and 2030

8. Market Segmentation by Component

8.1 Market segments

Chart on Component - Market share 2025-2030 (%)
Data Table on Component - Market share 2025-2030 (%)

8.2 Comparison by Component

Chart on Comparison by Component
Data Table on Comparison by Component

8.3 Software - Market size and forecast 2025-2030

Chart on Software - Market size and forecast 2025-2030 ($ million)
Data Table on Software - Market size and forecast 2025-2030 ($ million)
Chart on Software - Year-over-year growth 2025-2030 (%)
Data Table on Software - Year-over-year growth 2025-2030 (%)

8.4 Services - Market size and forecast 2025-2030

Chart on Services - Market size and forecast 2025-2030 ($ million)
Data Table on Services - Market size and forecast 2025-2030 ($ million)
Chart on Services - Year-over-year growth 2025-2030 (%)
Data Table on Services - Year-over-year growth 2025-2030 (%)

8.5 Market opportunity by Component

Market opportunity by Component ($ million)
Data Table on Market opportunity by Component ($ million)

9. Market Segmentation by Application

9.1 Market segments

Chart on Application - Market share 2025-2030 (%)
Data Table on Application - Market share 2025-2030 (%)

9.2 Comparison by Application

Chart on Comparison by Application
Data Table on Comparison by Application

9.3 Security assessment - Market size and forecast 2025-2030

Chart on Security assessment - Market size and forecast 2025-2030 ($ million)
Data Table on Security assessment - Market size and forecast 2025-2030 ($ million)
Chart on Security assessment - Year-over-year growth 2025-2030 (%)
Data Table on Security assessment - Year-over-year growth 2025-2030 (%)

9.4 Model testing and evaluation - Market size and forecast 2025-2030

Chart on Model testing and evaluation - Market size and forecast 2025-2030 ($ million)
Data Table on Model testing and evaluation - Market size and forecast 2025-2030 ($ million)
Chart on Model testing and evaluation - Year-over-year growth 2025-2030 (%)
Data Table on Model testing and evaluation - Year-over-year growth 2025-2030 (%)

9.5 Adversarial attack simulation - Market size and forecast 2025-2030

Chart on Adversarial attack simulation - Market size and forecast 2025-2030 ($ million)
Data Table on Adversarial attack simulation - Market size and forecast 2025-2030 ($ million)
Chart on Adversarial attack simulation - Year-over-year growth 2025-2030 (%)
Data Table on Adversarial attack simulation - Year-over-year growth 2025-2030 (%)

9.6 Compliance and risk management - Market size and forecast 2025-2030

Chart on Compliance and risk management - Market size and forecast 2025-2030 ($ million)
Data Table on Compliance and risk management - Market size and forecast 2025-2030 ($ million)
Chart on Compliance and risk management - Year-over-year growth 2025-2030 (%)
Data Table on Compliance and risk management - Year-over-year growth 2025-2030 (%)

9.7 Others - Market size and forecast 2025-2030

Chart on Others - Market size and forecast 2025-2030 ($ million)
Data Table on Others - Market size and forecast 2025-2030 ($ million)
Chart on Others - Year-over-year growth 2025-2030 (%)
Data Table on Others - Year-over-year growth 2025-2030 (%)

9.8 Market opportunity by Application

Market opportunity by Application ($ million)
Data Table on Market opportunity by Application ($ million)

10. Market Segmentation by Deployment

10.1 Market segments

Chart on Deployment - Market share 2025-2030 (%)
Data Table on Deployment - Market share 2025-2030 (%)

10.2 Comparison by Deployment

Chart on Comparison by Deployment
Data Table on Comparison by Deployment

10.3 Cloud-based - Market size and forecast 2025-2030

Chart on Cloud-based - Market size and forecast 2025-2030 ($ million)
Data Table on Cloud-based - Market size and forecast 2025-2030 ($ million)
Chart on Cloud-based - Year-over-year growth 2025-2030 (%)
Data Table on Cloud-based - Year-over-year growth 2025-2030 (%)

10.4 On-premises - Market size and forecast 2025-2030

Chart on On-premises - Market size and forecast 2025-2030 ($ million)
Data Table on On-premises - Market size and forecast 2025-2030 ($ million)
Chart on On-premises - Year-over-year growth 2025-2030 (%)
Data Table on On-premises - Year-over-year growth 2025-2030 (%)

10.5 Market opportunity by Deployment

Market opportunity by Deployment ($ million)
Data Table on Market opportunity by Deployment ($ million)

11. Customer Landscape

11.1 Customer landscape overview

Analysis of price sensitivity, lifecycle, customer purchase basket, adoption rates, and purchase criteria

12. Geographic Landscape

12.1 Geographic segmentation

Chart on Market share by geography 2025-2030 (%)
Data Table on Market share by geography 2025-2030 (%)

12.2 Geographic comparison

Chart on Geographic comparison
Data Table on Geographic comparison

12.3 North America - Market size and forecast 2025-2030

Chart on North America - Market size and forecast 2025-2030 ($ million)
Data Table on North America - Market size and forecast 2025-2030 ($ million)
Chart on North America - Year-over-year growth 2025-2030 (%)
Data Table on North America - Year-over-year growth 2025-2030 (%)
Chart on Regional Comparison - North America
Data Table on Regional Comparison - North America

12.3.1 US - Market size and forecast 2025-2030

Chart on US - Market size and forecast 2025-2030 ($ million)
Data Table on US - Market size and forecast 2025-2030 ($ million)
Chart on US - Year-over-year growth 2025-2030 (%)
Data Table on US - Year-over-year growth 2025-2030 (%)

12.3.2 Canada - Market size and forecast 2025-2030

Chart on Canada - Market size and forecast 2025-2030 ($ million)
Data Table on Canada - Market size and forecast 2025-2030 ($ million)
Chart on Canada - Year-over-year growth 2025-2030 (%)
Data Table on Canada - Year-over-year growth 2025-2030 (%)

12.3.3 Mexico - Market size and forecast 2025-2030

Chart on Mexico - Market size and forecast 2025-2030 ($ million)
Data Table on Mexico - Market size and forecast 2025-2030 ($ million)
Chart on Mexico - Year-over-year growth 2025-2030 (%)
Data Table on Mexico - Year-over-year growth 2025-2030 (%)

12.4 Europe - Market size and forecast 2025-2030

Chart on Europe - Market size and forecast 2025-2030 ($ million)
Data Table on Europe - Market size and forecast 2025-2030 ($ million)
Chart on Europe - Year-over-year growth 2025-2030 (%)
Data Table on Europe - Year-over-year growth 2025-2030 (%)
Chart on Regional Comparison - Europe
Data Table on Regional Comparison - Europe

12.4.1 UK - Market size and forecast 2025-2030

Chart on UK - Market size and forecast 2025-2030 ($ million)
Data Table on UK - Market size and forecast 2025-2030 ($ million)
Chart on UK - Year-over-year growth 2025-2030 (%)
Data Table on UK - Year-over-year growth 2025-2030 (%)

12.4.2 Germany - Market size and forecast 2025-2030

Chart on Germany - Market size and forecast 2025-2030 ($ million)
Data Table on Germany - Market size and forecast 2025-2030 ($ million)
Chart on Germany - Year-over-year growth 2025-2030 (%)
Data Table on Germany - Year-over-year growth 2025-2030 (%)

12.4.3 France - Market size and forecast 2025-2030

Chart on France - Market size and forecast 2025-2030 ($ million)
Data Table on France - Market size and forecast 2025-2030 ($ million)
Chart on France - Year-over-year growth 2025-2030 (%)
Data Table on France - Year-over-year growth 2025-2030 (%)

12.4.4 The Netherlands - Market size and forecast 2025-2030

Chart on The Netherlands - Market size and forecast 2025-2030 ($ million)
Data Table on The Netherlands - Market size and forecast 2025-2030 ($ million)
Chart on The Netherlands - Year-over-year growth 2025-2030 (%)
Data Table on The Netherlands - Year-over-year growth 2025-2030 (%)

12.4.5 Italy - Market size and forecast 2025-2030

Chart on Italy - Market size and forecast 2025-2030 ($ million)
Data Table on Italy - Market size and forecast 2025-2030 ($ million)
Chart on Italy - Year-over-year growth 2025-2030 (%)
Data Table on Italy - Year-over-year growth 2025-2030 (%)

12.4.6 Spain - Market size and forecast 2025-2030

Chart on Spain - Market size and forecast 2025-2030 ($ million)
Data Table on Spain - Market size and forecast 2025-2030 ($ million)
Chart on Spain - Year-over-year growth 2025-2030 (%)
Data Table on Spain - Year-over-year growth 2025-2030 (%)

12.5 APAC - Market size and forecast 2025-2030

Chart on APAC - Market size and forecast 2025-2030 ($ million)
Data Table on APAC - Market size and forecast 2025-2030 ($ million)
Chart on APAC - Year-over-year growth 2025-2030 (%)
Data Table on APAC - Year-over-year growth 2025-2030 (%)
Chart on Regional Comparison - APAC
Data Table on Regional Comparison - APAC

12.5.1 China - Market size and forecast 2025-2030

Chart on China - Market size and forecast 2025-2030 ($ million)
Data Table on China - Market size and forecast 2025-2030 ($ million)
Chart on China - Year-over-year growth 2025-2030 (%)
Data Table on China - Year-over-year growth 2025-2030 (%)

12.5.2 Japan - Market size and forecast 2025-2030

Chart on Japan - Market size and forecast 2025-2030 ($ million)
Data Table on Japan - Market size and forecast 2025-2030 ($ million)
Chart on Japan - Year-over-year growth 2025-2030 (%)
Data Table on Japan - Year-over-year growth 2025-2030 (%)

12.5.3 India - Market size and forecast 2025-2030

Chart on India - Market size and forecast 2025-2030 ($ million)
Data Table on India - Market size and forecast 2025-2030 ($ million)
Chart on India - Year-over-year growth 2025-2030 (%)
Data Table on India - Year-over-year growth 2025-2030 (%)

12.5.4 South Korea - Market size and forecast 2025-2030

Chart on South Korea - Market size and forecast 2025-2030 ($ million)
Data Table on South Korea - Market size and forecast 2025-2030 ($ million)
Chart on South Korea - Year-over-year growth 2025-2030 (%)
Data Table on South Korea - Year-over-year growth 2025-2030 (%)

12.5.5 Singapore - Market size and forecast 2025-2030

Chart on Singapore - Market size and forecast 2025-2030 ($ million)
Data Table on Singapore - Market size and forecast 2025-2030 ($ million)
Chart on Singapore - Year-over-year growth 2025-2030 (%)
Data Table on Singapore - Year-over-year growth 2025-2030 (%)

12.5.6 Australia - Market size and forecast 2025-2030

Chart on Australia - Market size and forecast 2025-2030 ($ million)
Data Table on Australia - Market size and forecast 2025-2030 ($ million)
Chart on Australia - Year-over-year growth 2025-2030 (%)
Data Table on Australia - Year-over-year growth 2025-2030 (%)

12.6 South America - Market size and forecast 2025-2030

Chart on South America - Market size and forecast 2025-2030 ($ million)
Data Table on South America - Market size and forecast 2025-2030 ($ million)
Chart on South America - Year-over-year growth 2025-2030 (%)
Data Table on South America - Year-over-year growth 2025-2030 (%)
Chart on Regional Comparison - South America
Data Table on Regional Comparison - South America

12.6.1 Brazil - Market size and forecast 2025-2030

Chart on Brazil - Market size and forecast 2025-2030 ($ million)
Data Table on Brazil - Market size and forecast 2025-2030 ($ million)
Chart on Brazil - Year-over-year growth 2025-2030 (%)
Data Table on Brazil - Year-over-year growth 2025-2030 (%)

12.6.2 Argentina - Market size and forecast 2025-2030

Chart on Argentina - Market size and forecast 2025-2030 ($ million)
Data Table on Argentina - Market size and forecast 2025-2030 ($ million)
Chart on Argentina - Year-over-year growth 2025-2030 (%)
Data Table on Argentina - Year-over-year growth 2025-2030 (%)

12.6.3 Chile - Market size and forecast 2025-2030

Chart on Chile - Market size and forecast 2025-2030 ($ million)
Data Table on Chile - Market size and forecast 2025-2030 ($ million)
Chart on Chile - Year-over-year growth 2025-2030 (%)
Data Table on Chile - Year-over-year growth 2025-2030 (%)

12.7 Middle East and Africa - Market size and forecast 2025-2030

Chart on Middle East and Africa - Market size and forecast 2025-2030 ($ million)
Data Table on Middle East and Africa - Market size and forecast 2025-2030 ($ million)
Chart on Middle East and Africa - Year-over-year growth 2025-2030 (%)
Data Table on Middle East and Africa - Year-over-year growth 2025-2030 (%)
Chart on Regional Comparison - Middle East and Africa
Data Table on Regional Comparison - Middle East and Africa

12.7.1 UAE - Market size and forecast 2025-2030

Chart on UAE - Market size and forecast 2025-2030 ($ million)
Data Table on UAE - Market size and forecast 2025-2030 ($ million)
Chart on UAE - Year-over-year growth 2025-2030 (%)
Data Table on UAE - Year-over-year growth 2025-2030 (%)

12.7.2 Saudi Arabia - Market size and forecast 2025-2030

Chart on Saudi Arabia - Market size and forecast 2025-2030 ($ million)
Data Table on Saudi Arabia - Market size and forecast 2025-2030 ($ million)
Chart on Saudi Arabia - Year-over-year growth 2025-2030 (%)
Data Table on Saudi Arabia - Year-over-year growth 2025-2030 (%)

12.7.3 South Africa - Market size and forecast 2025-2030

Chart on South Africa - Market size and forecast 2025-2030 ($ million)
Data Table on South Africa - Market size and forecast 2025-2030 ($ million)
Chart on South Africa - Year-over-year growth 2025-2030 (%)
Data Table on South Africa - Year-over-year growth 2025-2030 (%)

12.7.4 Israel - Market size and forecast 2025-2030

Chart on Israel - Market size and forecast 2025-2030 ($ million)
Data Table on Israel - Market size and forecast 2025-2030 ($ million)
Chart on Israel - Year-over-year growth 2025-2030 (%)
Data Table on Israel - Year-over-year growth 2025-2030 (%)

12.7.5 Turkey - Market size and forecast 2025-2030

Chart on Turkey - Market size and forecast 2025-2030 ($ million)
Data Table on Turkey - Market size and forecast 2025-2030 ($ million)
Chart on Turkey - Year-over-year growth 2025-2030 (%)
Data Table on Turkey - Year-over-year growth 2025-2030 (%)

12.8 Market opportunity by geography

Market opportunity by geography ($ million)
Data Tables on Market opportunity by geography ($ million)

13. Drivers, Challenges, and Opportunity

13.1 Market drivers

Escalation of regulatory mandates and global compliance standards
Rapid proliferation of sophisticated adversarial attack techniques
Deepening integration of AI within high-stakes industrial applications

13.2 Market challenges

Shortage of specialized expertise and interdisciplinary skill sets
Significant resource requirements and operational costs of extensive testing
Rapid evolution of adversarial techniques and model architectures

13.3 Impact of drivers and challenges

Impact of drivers and challenges in 2025 and 2030

13.4 Market opportunities

Transition toward automated and persistent adversarial simulations
Expansion of scope to address multimodal and cross-domain vulnerabilities
Integration of red teaming into devsecops lifecycle for continuous assurance

14. Competitive Landscape

14.1 Overview

14.2

Overview on criticality of inputs and factors of differentiation

14.3 Landscape disruption

Overview on factors of disruption

14.4 Industry risks

Impact of key risks on business

15. Competitive Analysis

15.1 Companies profiled

Companies covered

15.2 Company ranking index

15.3 Market positioning of companies

Matrix on companies position and classification

15.4 Booz Allen Hamilton Corp.

Booz Allen Hamilton Corp. - Overview
Booz Allen Hamilton Corp. - Product / Service
Booz Allen Hamilton Corp. - Key offerings
SWOT

15.5 Bosch AIShield

Bosch AIShield - Overview
Bosch AIShield - Product / Service
Bosch AIShield - Key offerings
SWOT

15.6 Giskard AI

Giskard AI - Overview
Giskard AI - Product / Service
Giskard AI - Key offerings
SWOT

15.7 Google LLC

Google LLC - Overview
Google LLC - Product / Service
Google LLC - Key offerings
SWOT

15.8 HiddenLayer Inc.

HiddenLayer Inc. - Overview
HiddenLayer Inc. - Product / Service
HiddenLayer Inc. - Key offerings
SWOT

15.9 IBM Corp.

IBM Corp. - Overview
IBM Corp. - Business segments
IBM Corp. - Key news
IBM Corp. - Key offerings
IBM Corp. - Segment focus
SWOT

15.10 Lakera Inc

Lakera Inc - Overview
Lakera Inc - Product / Service
Lakera Inc - Key offerings
SWOT

15.11 Microsoft Corp.

Microsoft Corp. - Overview
Microsoft Corp. - Business segments
Microsoft Corp. - Key news
Microsoft Corp. - Key offerings
Microsoft Corp. - Segment focus
SWOT

15.12 Mithril Security

Mithril Security - Overview
Mithril Security - Product / Service
Mithril Security - Key offerings
SWOT

15.13 NCC Group Plc

NCC Group Plc - Overview
NCC Group Plc - Product / Service
NCC Group Plc - Key offerings
SWOT

15.14 NVIDIA Corp.

NVIDIA Corp. - Overview
NVIDIA Corp. - Business segments
NVIDIA Corp. - Key news
NVIDIA Corp. - Key offerings
NVIDIA Corp. - Segment focus
SWOT

15.15 Prompt Security Inc.

Prompt Security Inc. - Overview
Prompt Security Inc. - Product / Service
Prompt Security Inc. - Key offerings
SWOT

15.16 Protect AI Inc.

Protect AI Inc. - Overview
Protect AI Inc. - Product / Service
Protect AI Inc. - Key offerings
SWOT

15.17 Scale AI

Scale AI - Overview
Scale AI - Product / Service
Scale AI - Key offerings
SWOT

15.18 TrojAI Inc

TrojAI Inc - Overview
TrojAI Inc - Product / Service
TrojAI Inc - Key offerings
SWOT

16. Appendix

16.1 Scope of the report

Market definition
Objectives
Notes and caveats

16.2 Inclusions and exclusions checklist

Inclusions checklist
Exclusions checklist

16.3 Currency conversion rates for US$

16.4 Research methodology

16.5 Data procurement

Information sources

16.6 Data validation

16.7 Validation techniques employed for market sizing

16.8 Data synthesis

16.9 360 degree market analysis

16.10 List of abbreviations

Research Methodology

Technavio presents a detailed picture of the market by way of study, synthesis, and summation of data from multiple sources. The analysts have presented the various facets of the market with a particular focus on identifying the key industry influencers. The data thus presented is comprehensive, reliable, and the result of extensive research, both primary and secondary.

INFORMATION SOURCES

Primary sources

  • Manufacturers and suppliers
  • Channel partners
  • Industry experts
  • Strategic decision makers

Secondary sources

  • Industry journals and periodicals
  • Government data
  • Financial reports of key industry players
  • Historical data
  • Press releases

DATA ANALYSIS

Data Synthesis

  • Collation of data
  • Estimation of key figures
  • Analysis of derived insights

Data Validation

  • Triangulation with data models
  • Reference against proprietary databases
  • Corroboration with industry experts

REPORT WRITING

Qualitative

  • Market drivers
  • Market challenges
  • Market trends
  • Five forces analysis

Quantitative

  • Market size and forecast
  • Market segmentation
  • Geographical insights
  • Competitive landscape

Interested in this report?

Get your sample now to see our research methodology and insights!

Download Now

Frequently Asked Questions

AI Red Teaming Solutions market growth will increase by USD 6690.0 million during 2026-2030.

The AI Red Teaming Solutions market is expected to grow at a CAGR of 25.1% during 2026-2030.

AI Red Teaming Solutions market is segmented by Component (Software, Services) Application (Security assessment, Model testing and evaluation, Adversarial attack simulation, Compliance and risk management, Others) Deployment (Cloud-based, On-premises)

AdvAI, Apex Security, Bishop Fox, Booz Allen Hamilton Corp., Bosch AIShield, DynamoFL, Giskard AI, Google LLC, HiddenLayer Inc., IBM Corp., Lakera Inc, Microsoft Corp., Mithril Security, NCC Group Plc, NVIDIA Corp., Pillar Security, Prompt Security Inc., Protect AI Inc., Scale AI, TrojAI Inc are a few of the key vendors in the AI Red Teaming Solutions market.

North America will register the highest growth rate of 42.5% among the other regions. Therefore, the AI Red Teaming Solutions market in North America is expected to garner significant business opportunities for the vendors during the forecast period.

US, Canada, Mexico, UK, Germany, France, The Netherlands, Italy, Spain, China, Japan, India, South Korea, Singapore, Australia, Brazil, Argentina, Chile, UAE, Saudi Arabia, South Africa, Israel, Turkey

  • Escalation of regulatory mandates and global compliance standards is the driving factor this market.

The AI Red Teaming Solutions market vendors should focus on grabbing business opportunities from the Component segment as it accounted for the largest market share in the base year.
RIA - Research AI Assistant
Ask RIA