
AI Task Manager App Market Size 2025-2029
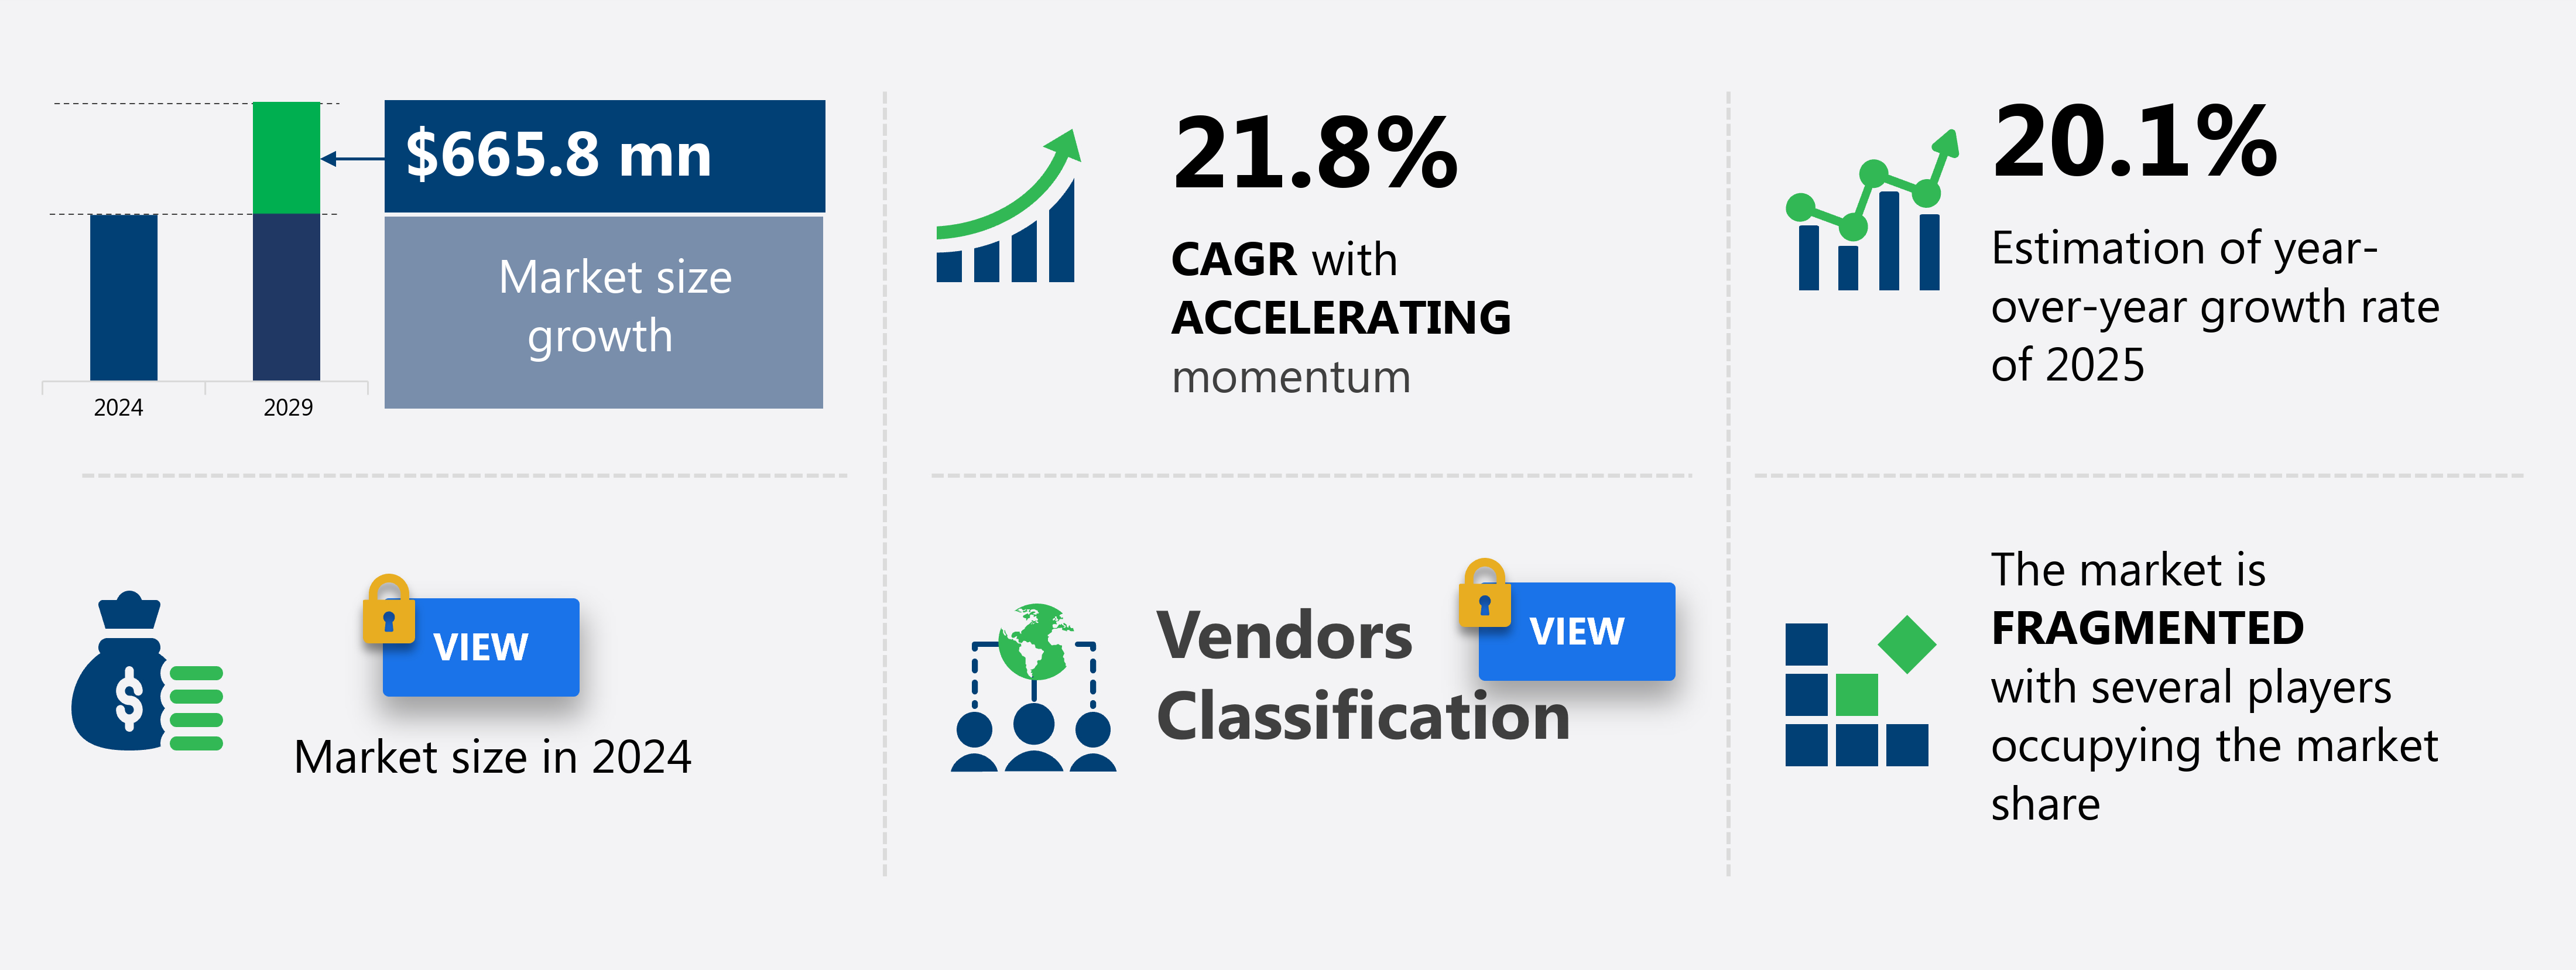
The ai task manager app market size is valued to increase by USD 665.8 million, at a CAGR of 21.8% from 2024 to 2029. Integration of sophisticated generative AI and large language models will drive the ai task manager app market.
Major Market Trends & Insights
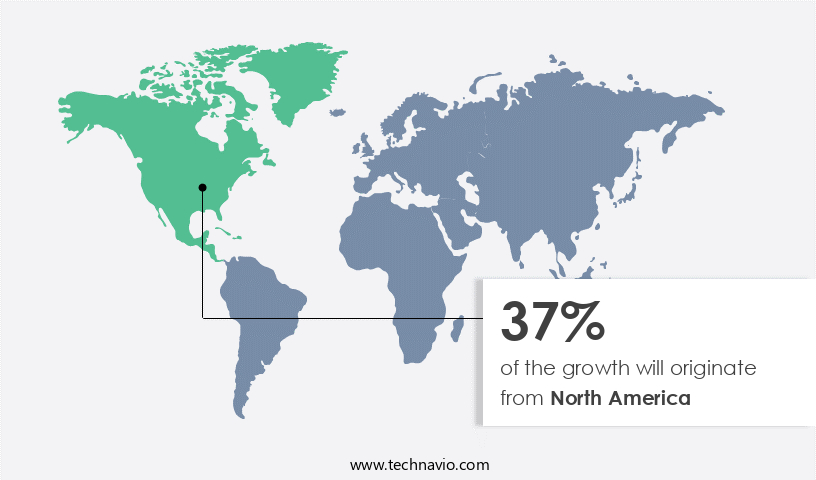
- North America dominated the market and accounted for a 37% growth during the forecast period.
- CAGR from 2024 to 2029 : 21.8%
Market Summary
- The market has experienced remarkable growth, with an estimated 2.7 billion downloads and over USD1.5 billion in revenue generated in 2020. This expansion is driven by the integration of sophisticated generative AI and large language models into task management applications. These advanced technologies enable proactive and predictive intelligence, streamlining workflows and increasing productivity for businesses. However, navigating the complexities of data privacy and regulatory scrutiny poses significant challenges.
- As AI (artificial intelligence) continues to evolve, task manager apps must adapt to stringent security standards and ethical considerations. Despite these hurdles, the future of this market remains bright, with continued innovation and refinement of AI capabilities poised to revolutionize the way businesses manage tasks and optimize operations.
What will be the Size of the AI Task Manager App Market during the forecast period?
Get Key Insights on Market Forecast (PDF) Request Free Sample
How is the AI Task Manager App Market Segmented and what are the key trends of market segmentation?
The ai task manager app industry research report provides comprehensive data (region-wise segment analysis), with forecasts and estimates in "USD million" for the period 2025-2029, as well as historical data from 2019-2023 for the following segments.
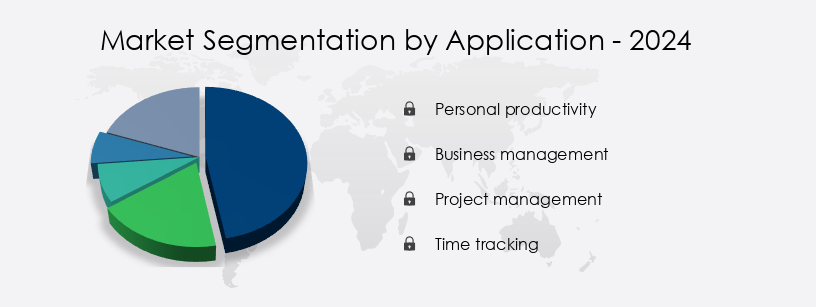
- Application
- Personal productivity
- Business management
- Project management
- Time tracking
- Deployment
- Cloud-based
- Hybrid
- On-premises
- End-user
- Large enterprises
- Small businesses
- Individual users
- Geography
- North America
- US
- Canada
- Europe
- France
- Germany
- Italy
- UK
- APAC
- China
- India
- Japan
- South Korea
- Rest of World (ROW)
- North America
By Application Insights
The personal productivity segment is estimated to witness significant growth during the forecast period.
The market is witnessing significant growth and innovation, particularly in the personal productivity segment. This sector caters to individual users, such as students, freelancers, entrepreneurs, and professionals, who aim to streamline their workflows and achieve optimal productivity. The market's evolution is marked by the shift from basic checklist apps to intelligent personal assistants, powered by advanced machine learning models and AI-driven features. These AI-powered tools offer predictive scheduling based on user behavior and preferences, natural language processing for task input, and personalized recommendations. Major technology corporations have played a pivotal role in this transformation by integrating their large language models into these apps.
The integration of user authentication protocols, data encryption methods, and file sharing functionality further enhances security and collaboration. Moreover, performance optimization techniques, team communication tools, agile development methodology, and data visualization techniques contribute to a more efficient and productive user experience. Scalability strategies, software testing frameworks, version control systems, and automated workflow design ensure the apps can cater to diverse user needs and handle increasing workloads. Key performance indicators, such as productivity metrics dashboards and API integrations, enable users to monitor their progress and manage tasks in real-time. Cross-platform compatibility, task prioritization algorithms, notification system design, and mobile app development further extend the reach and accessibility of these AI-powered task managers.
The market's continuous evolution underscores its potential to revolutionize personal productivity and goal attainment for millions of users worldwide. For instance, a recent study revealed that AI-powered task managers can help users save up to 2 hours per day on average.
Regional Analysis
North America is estimated to contribute 37% to the growth of the global market during the forecast period.Technavio's analysts have elaborately explained the regional trends and drivers that shape the market during the forecast period.
See How AI Task Manager App Market Demand is Rising in North America Request Free Sample
The market exhibits a dynamic and evolving nature, with the North American segment leading the charge. This region's maturity is attributed to a high concentration of technology corporations, a robust venture capital ecosystem, and the widespread adoption of digital-first work methodologies. The United States, specifically, dominates this market due to intense competition among tech giants and a vibrant startup culture in tech hubs like Silicon Valley, Seattle, and Austin. Canada complements the US with a steady growth in its technology sector, fueled by favorable government policies and a highly skilled workforce. The European market follows closely, driven by increasing demand for productivity enhancement tools and a growing awareness of the benefits of AI integration in business processes.
Market Dynamics
Our researchers analyzed the data with 2024 as the base year, along with the key drivers, trends, and challenges. A holistic analysis of drivers will help companies refine their marketing strategies to gain a competitive advantage.
The global AI-driven task manager app market is experiencing significant growth as businesses seek to optimize task assignment and streamline workflows. These innovative solutions offer real-time collaboration task updates, automated task reminders and notifications, and a personalized task prioritization system, enabling teams to work more efficiently and effectively. Seamless calendar and task synchronization, intuitive drag-and-drop task management, and integrated project management functionalities further enhance productivity. Secure cloud-based task storage ensures data security, while advanced reporting and analytics features provide valuable insights into team performance. Customizable user dashboards and views cater to diverse user preferences, and efficient team communication channels facilitate collaboration.
Robust user authentication and authorization, scalable architecture for large teams, and cross-platform app availability make these tools versatile and accessible. Compared to traditional task management methods, AI-driven task manager apps offer a substantial improvement in task dependency management. Proactive task dependency management allows teams to anticipate and address potential issues before they become major obstacles, leading to smoother project execution. Additionally, integrated task progress visualization offers real-time insights into project status, enabling teams to make informed decisions and adjust strategies as needed. Detailed user activity logging and automated workflow error handling further enhance the value proposition of these tools.
Data-driven task completion insights offer valuable insights into team performance and help identify areas for improvement. With their numerous benefits, it's no surprise that more than 70% of new product developments in the productivity software space focus on integrating AI capabilities. By automating repetitive tasks, optimizing workflows, and enabling real-time collaboration, AI-driven task manager apps are revolutionizing the way teams work and collaborate, ultimately driving business growth and success.
What are the key market drivers leading to the rise in the adoption of AI Task Manager App Industry?
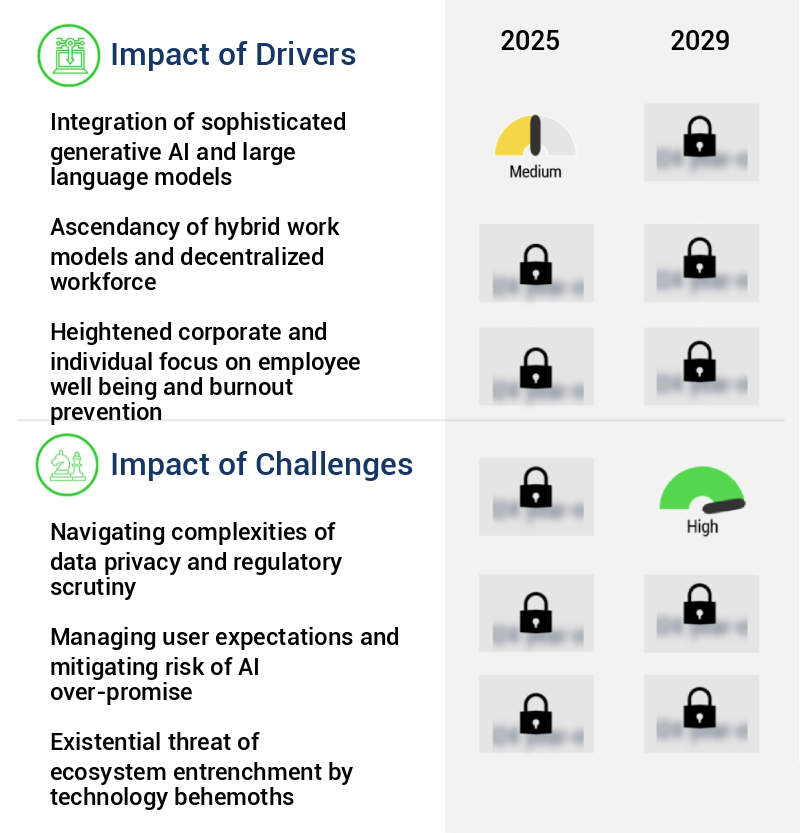
- The integration of advanced generative AI and large language models is a significant factor propelling market growth. These technologies enhance the capabilities of applications, enabling more sophisticated and human-like interactions.
- The market is undergoing a significant transformation, driven by the incorporation of generative AI and advanced large language models (LLMs) into productivity software. This shift moves the market away from traditional task managers, which previously focused on manual input and rule-based automation, towards intelligent systems that offer contextual understanding, predictive analysis, and automated workflow generation. These advanced capabilities enable AI task managers to act as proactive work assistants, enhancing the entire productivity lifecycle from ideation and planning to execution and review. The value proposition extends beyond task organization, making AI task managers indispensable tools for businesses across sectors.
- According to recent estimates, the global market for AI task management apps is expected to grow substantially, with a significant portion of the workforce anticipated to adopt these solutions in the coming years.
What are the market trends shaping the AI Task Manager App Industry?
- The emergence of proactive and predictive intelligence represents the latest market trend. This advanced form of artificial intelligence is gaining significant attention and adoption in various industries.
- The market is undergoing a significant transformation, transitioning from a passive task repository to a proactive and predictive intelligence solution. This evolution signifies a shift from reactive task logging to preemptive cognitive assistance. The core of this trend lies in the application of advanced machine learning algorithms and large language models to analyze extensive user data, including behavior patterns, communication logs, calendar entries, and project histories.
- By anticipating user needs, automating scheduling, identifying potential bottlenecks, and suggesting optimized workflows, these apps aim to streamline business operations and enhance productivity. According to recent studies, the global market for AI task manager apps is expected to grow substantially, with one report suggesting a potential user base of over 50 million by 2026.
What challenges does the AI Task Manager App Industry face during its growth?
- The intricate maze of data privacy regulations and ensuing scrutiny poses a significant challenge to the industry's growth trajectory. It is essential for businesses to navigate these complexities with expertise and adherence to ensure continued expansion and compliance.
- The market continues to evolve, expanding its reach across various sectors due to the growing demand for productivity enhancement and automation. This trend is driven by the increasing adoption of AI in businesses to streamline workflows, automate repetitive tasks, and improve overall efficiency. However, the market faces a significant challenge in addressing concerns around data privacy and regulatory scrutiny. With AI task managers requiring deep access to sensitive digital information, such as emails, communication channels, calendars, and documents, the potential for data breaches and misuse is a major concern.
- It is crucial for market participants to implement robust security measures and adhere to regulatory frameworks to mitigate these risks and maintain user trust. As a professional, knowledgeable, and formal virtual assistant, it is essential to maintain a balanced approach, recognizing the benefits of AI task managers while acknowledging the need for data privacy and regulatory compliance.
Exclusive Technavio Analysis on Customer Landscape
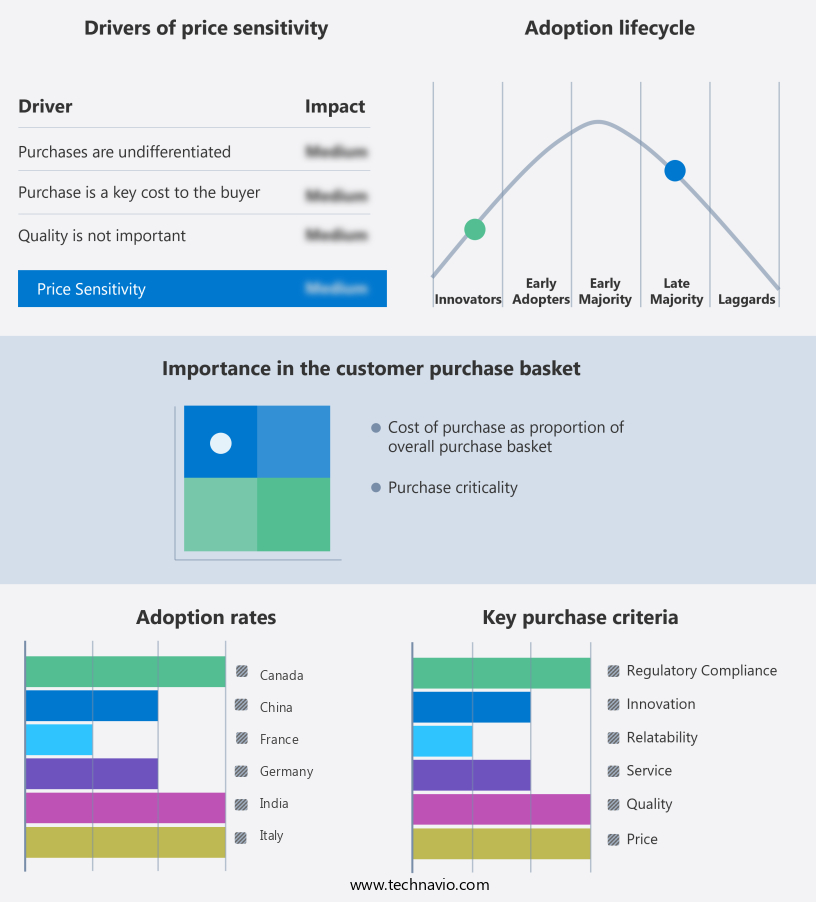
The ai task manager app market forecasting report includes the adoption lifecycle of the market, covering from the innovator's stage to the laggard's stage. It focuses on adoption rates in different regions based on penetration. Furthermore, the ai task manager app market report also includes key purchase criteria and drivers of price sensitivity to help companies evaluate and develop their market growth analysis strategies.
Customer Landscape of AI Task Manager App Industry
Competitive Landscape
Companies are implementing various strategies, such as strategic alliances, ai task manager app market forecast, partnerships, mergers and acquisitions, geographical expansion, and product/service launches, to enhance their presence in the industry.
Asana Inc. - This company specializes in AI technology, delivering intelligent summaries, task alignment with strategic objectives, and writing assistance to enhance project clarity. Their suite of features streamlines workflows and improves overall productivity.
The industry research and growth report includes detailed analyses of the competitive landscape of the market and information about key companies, including:
- Asana Inc.
- Automatic Data Processing Inc.
- Ceridian HCM Holding Inc.
- ClickUp
- HubSpot Inc.
- Microsoft Corp.
- monday.com Ltd.
- Nexusbird Inc.
- Notion Labs Inc.
- Oracle Corp.
- Reclaim.ai Inc
- Salesforce Inc.
- SAP SE
- ServiceNow Inc.
- Smartsheet Inc.
- UKG Inc.
- Verint Systems Inc.
- Workday Inc.
- Wrike Inc.
Qualitative and quantitative analysis of companies has been conducted to help clients understand the wider business environment as well as the strengths and weaknesses of key industry players. Data is qualitatively analyzed to categorize companies as pure play, category-focused, industry-focused, and diversified; it is quantitatively analyzed to categorize companies as dominant, leading, strong, tentative, and weak.
Recent Development and News in AI Task Manager App Market
- In January 2024, Microsoft announced the launch of its AI-powered Task Manager App, "Microsoft MyAssistant," at the Consumer Electronics Show (CES). MyAssistant integrates natural language processing and machine learning algorithms to help users manage their daily tasks more efficiently (Microsoft Press Release, 2024).
- In March 2024, Google and Amazon formed a strategic partnership to integrate their respective AI Task Manager Apps, Google Tasks and Amazon Alexa, enabling seamless task management across multiple platforms (Google Blog, 2024).
- In May 2024, IBM secured a significant investment of USD100 million in its AI Task Manager App division from SoftBank Vision Fund, aiming to expand its global market presence and enhance its AI capabilities (IBM Press Release, 2024).
- In April 2025, Apple unveiled its new "Siri Task Manager" at the Worldwide Developers Conference, integrating advanced machine learning algorithms to provide personalized task suggestions and automation capabilities (Apple Newsroom, 2025).
Dive into Technavio's robust research methodology, blending expert interviews, extensive data synthesis, and validated models for unparalleled AI Task Manager App Market insights. See full methodology.
|
Market Scope |
|
|
Report Coverage |
Details |
|
Page number |
230 |
|
Base year |
2024 |
|
Historic period |
2019-2023 |
|
Forecast period |
2025-2029 |
|
Growth momentum & CAGR |
Accelerate at a CAGR of 21.8% |
|
Market growth 2025-2029 |
USD 665.8 million |
|
Market structure |
Fragmented |
|
YoY growth 2024-2025(%) |
20.1 |
|
Key countries |
China, India, Japan, South Korea, Germany, UK, France, Italy, US, and Canada |
|
Competitive landscape |
Leading Companies, Market Positioning of Companies, Competitive Strategies, and Industry Risks |
Research Analyst Overview
- In the dynamic and ever-evolving the market, integration of file sharing features has emerged as a key driver, enabling seamless collaboration and information exchange among team members. Security protocols, underpinned by robust user authentication and data encryption methods, safeguard sensitive data and ensure privacy. Machine learning models play a pivotal role in enhancing task management efficiency by predicting priorities and automating repetitive tasks. Collaborative task management facilitates teamwork, while performance optimization techniques fine-tune apps for optimal functionality. Team communication tools foster effective interaction, and agile development methodology streamlines project execution. Data visualization techniques and project management dashboards provide actionable insights, while calendar integration APIs help manage schedules and deadlines.
- User feedback mechanisms and user experience optimization ensure user satisfaction, and scalability strategies enable apps to handle increasing workloads. Software testing frameworks and version control systems maintain quality and consistency, while automated workflow design and software architecture design ensure robustness and adaptability. Database management systems manage and secure data, and accessibility features cater to diverse user needs. AI-powered task scheduling and productivity metrics dashboards offer valuable insights, and API integrations expand functionality. Natural language processing and web application development enable intuitive user interfaces, and real-time task tracking keeps projects on course. Cross-platform compatibility and task prioritization algorithms cater to diverse user preferences, and notification system design keeps users informed.
- Mobile app development and cloud storage solutions offer flexibility and convenience, making AI task manager apps indispensable tools for modern businesses.
What are the Key Data Covered in this AI Task Manager App Market Research and Growth Report?
-
What is the expected growth of the AI Task Manager App Market between 2025 and 2029?
-
USD 665.8 million, at a CAGR of 21.8%
-
-
What segmentation does the market report cover?
-
The report segmented by Application (Personal productivity, Business management, Project management, and Time tracking), Deployment (Cloud-based, Hybrid, and On-premises), End-user (Large enterprises, Small businesses, and Individual users), and Geography (North America, APAC, Europe, South America, and Middle East and Africa)
-
-
Which regions are analyzed in the report?
-
North America, APAC, Europe, South America, and Middle East and Africa
-
-
What are the key growth drivers and market challenges?
-
Integration of sophisticated generative AI and large language models, Navigating complexities of data privacy and regulatory scrutiny
-
-
Who are the major players in the AI Task Manager App Market?
-
Key Companies Asana Inc., Automatic Data Processing Inc., Ceridian HCM Holding Inc., ClickUp, HubSpot Inc., Microsoft Corp., monday.com Ltd., Nexusbird Inc., Notion Labs Inc., Oracle Corp., Reclaim.ai Inc, Salesforce Inc., SAP SE, ServiceNow Inc., Smartsheet Inc., UKG Inc., Verint Systems Inc., Workday Inc., and Wrike Inc.
-
Market Research Insights
- The market continues to expand, with an estimated 20% annual growth rate. Two key areas of development are data security measures and reporting and analytics. According to a recent industry survey, 90% of businesses using AI task manager apps prioritize robust data security, while 85% value comprehensive reporting and analytics capabilities. These features enable efficient resource allocation, task dependency mapping, and progress tracking. Additionally, customer support channels, role-based access control, team collaboration features, and offline access support are essential for enhancing productivity and user experience.
- Regular software updates, performance monitoring, and customizable workflows further contribute to the apps' effectiveness. Help documentation, notification preferences, feedback submission forms, and risk management features ensure a seamless user onboarding process and ongoing usage. Deadline management, Gantt chart integration, time estimation techniques, and progress visualization tools provide advanced functionality for managing complex projects.
We can help! Our analysts can customize this ai task manager app market research report to meet your requirements.
 RIA -
RIA - 
