Air Cargo Market Analysis, Size, and Forecast 2026-2030: APAC (China, Japan, and India), North America (US, Canada, and Mexico), Europe (Germany, UK, and France), Middle East and Africa (UAE, Saudi Arabia, and Turkey), South America (Brazil and Colombia), and Rest of World (ROW)

Air Cargo Market Analysis, Size, and Forecast 2026-2030:
APAC (China, Japan, and India), North America (US, Canada, and Mexico), Europe (Germany, UK, and France), Middle East and Africa (UAE, Saudi Arabia, and Turkey), South America (Brazil and Colombia), and Rest of World (ROW)

Published: Apr 2026 301 Pages SKU: IRTNTR41281

Market Overview at a Glance

$21.33 B
Market Opportunity
5.1%
CAGR 2025 - 2030
32.4%
APAC Growth
$28.90 B
Manufacturing segment 2024

Air Cargo Market Size 2026-2030

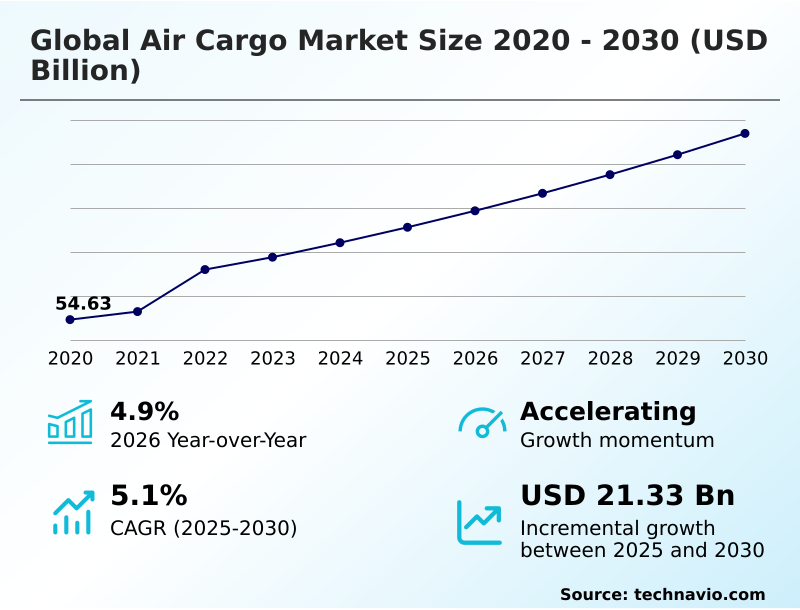
The air cargo market size is valued to increase by USD 21.33 billion, at a CAGR of 5.1% from 2025 to 2030. Exponential expansion of cross-border e-commerce demand will drive the air cargo market.

Major Market Trends & Insights

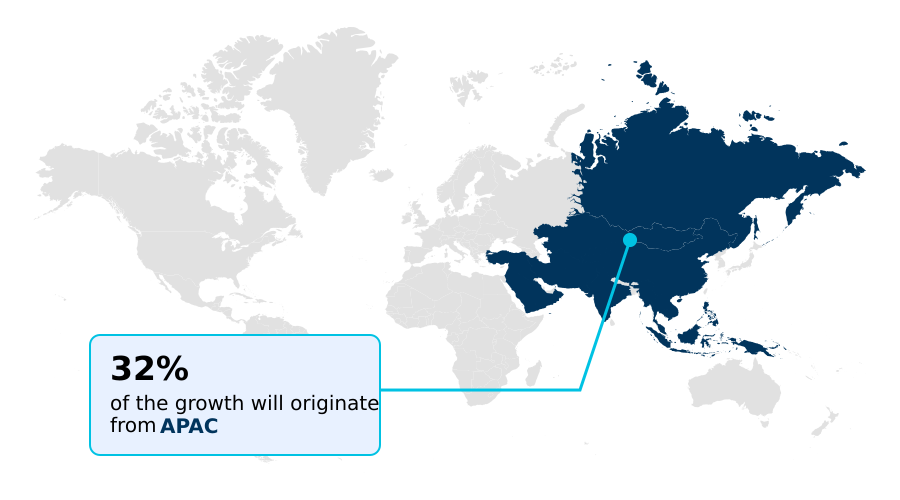
  • APAC dominated the market and accounted for a 32.4% growth during the forecast period.
  • By End-user - Manufacturing segment was valued at USD 28.90 billion in 2024
  • By Type - Belly cargo segment accounted for the largest market revenue share in 2024

Market Size & Forecast

  • Market Opportunities: USD 42.32 billion
  • Market Future Opportunities: USD 21.33 billion
  • CAGR from 2025 to 2030 : 5.1%

Market Summary

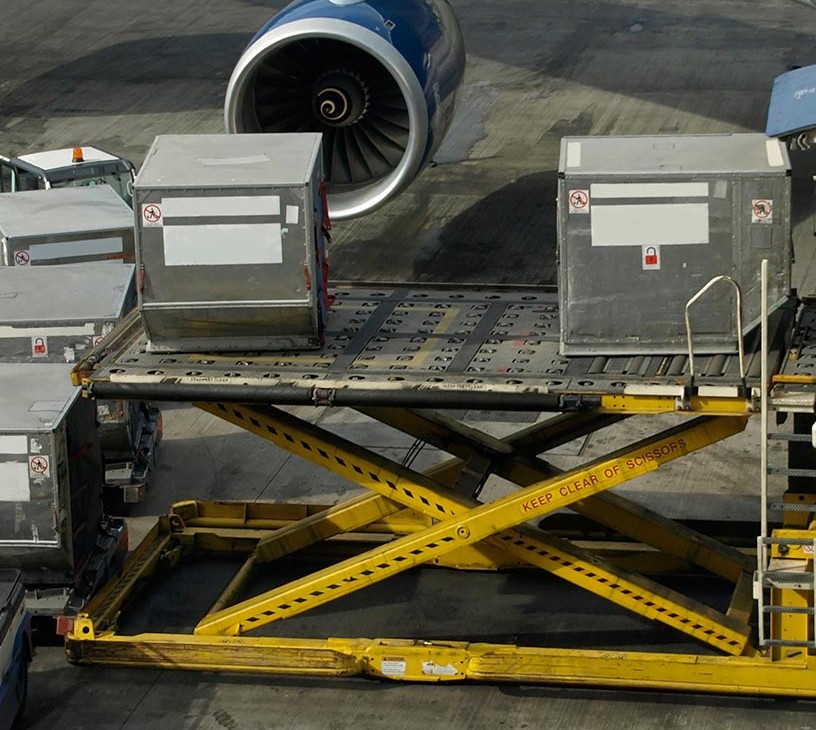
  • The Air Cargo Market is characterized by its dynamic adaptation to global commerce, facilitating the rapid transit of high-value and time-sensitive goods. The industry's operational framework relies on a sophisticated integration of dedicated freighter services and belly-hold capacity, supported by advanced logistics platforms.
  • A primary driver is the growth of cross-border e-commerce, which necessitates greater speed and transparency within the supply chain. Consequently, there is a significant trend towards digitalization, with the adoption of digital freight marketplaces and predictive analytics for capacity planning.
  • For instance, a global electronics firm can leverage real-time visibility to manage a global product launch, ensuring simultaneous inventory availability across continents while minimizing warehousing costs. However, the sector faces challenges from stringent environmental regulations, pushing for investments in sustainable aviation fuel and fleet modernization.
  • The ongoing shift toward specialized cargo segments, particularly in life sciences and pharmaceuticals, underscores the need for precise temperature-controlled containers and a secure chain of custody, defining a high-value niche for specialized operators.

What will be the Size of the Air Cargo Market during the forecast period?

Get Key Insights on Market Forecast (PDF) Request Free Sample

How is the Air Cargo Market Segmented?

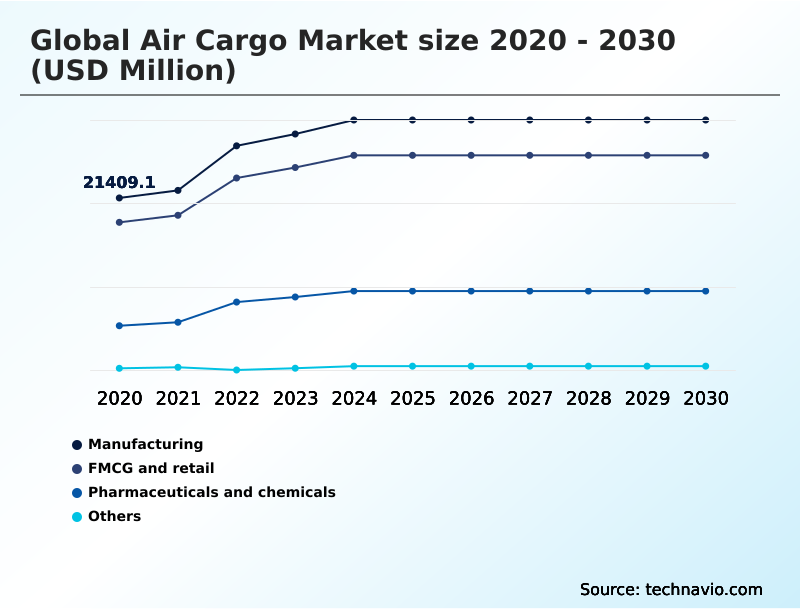
The air cargo industry research report provides comprehensive data (region-wise segment analysis), with forecasts and estimates in "USD million" for the period 2026-2030, as well as historical data from 2020-2024 for the following segments.

  • End-user
    • Manufacturing
    • FMCG and retail
    • Pharmaceuticals and chemicals
    • Others
  • Type
    • Belly cargo
    • Freighter
  • Service type
    • Express cargo
    • General cargo
    • Special cargo
  • Geography
    • APAC
      • China
      • Japan
      • India
    • North America
      • US
      • Canada
      • Mexico
    • Europe
      • Germany
      • UK
      • France
    • Middle East and Africa
      • UAE
      • Saudi Arabia
      • Turkey
    • South America
      • Brazil
      • Colombia
    • Rest of World (ROW)

By End-user Insights

The manufacturing segment is estimated to witness significant growth during the forecast period.

The manufacturing segment underpins air cargo demand through its requirement for high-velocity transit of industrial components. This reliance supports just-in-time production schedules that are highly sensitive to disruption.

Supply chain diversification and the near-shoring impact drive demand for intermodal connectivity and efficient ground handling efficiency to manage complex international logistics.

To maintain lean inventories, manufacturers prioritize air freight for critical parts, utilizing widebody freighter capacity for heavy and oversized consignments. The adoption of smart airport infrastructure enables better cargo build-up optimization and reduces aircraft turnaround time.

As operations become more globally interconnected, carriers that offer specialized special cargo handling and can meet rigorous standards, such as the ICAO 2027 CO2 emissions benchmark, are gaining a competitive advantage.

Request Free Sample

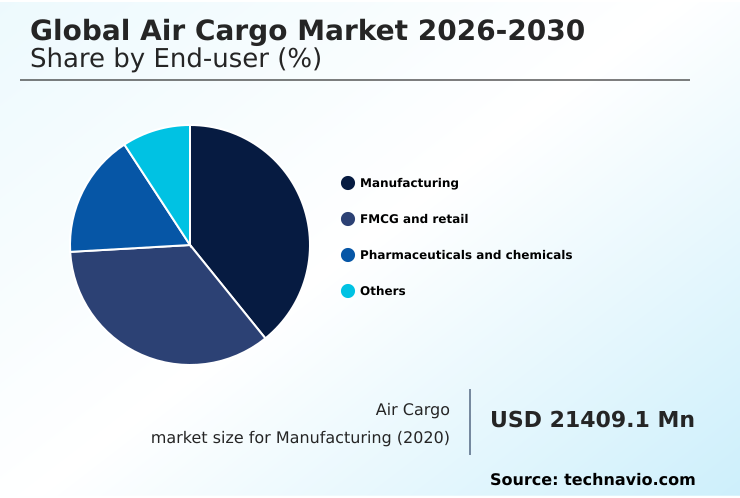
The Manufacturing segment was valued at USD 28.90 billion in 2024 and showed a gradual increase during the forecast period.

Request Free Sample

Regional Analysis

APAC is estimated to contribute 32.4% to the growth of the global market during the forecast period.Technavio’s analysts have elaborately explained the regional trends and drivers that shape the market during the forecast period.

See How Air Cargo Market Demand is Rising in APAC Request Free Sample

The geographic landscape of the market is led by the APAC region, which is expanding at a rate approximately 15% faster than Europe, driven by massive manufacturing output and e-commerce activity.

The US market remains the largest single country by value, with a market size more than double that of China, reflecting its mature integrated express networks.

In this competitive environment, the use of specialized freighter aircraft for pharmaceutical transport and perishable goods handling is critical.

Key trade corridors rely on advanced cold chain logistics, utilizing temperature-controlled containers to move goods from production hubs in South America and APAC to consumer markets in North America and Europe.

Effective air cargo security screening and the ability to manage high-value electronics transport are essential for maintaining dominance at major transit hubs.

Market Dynamics

Our researchers analyzed the data with 2025 as the base year, along with the key drivers, trends, and challenges. A holistic analysis of drivers will help companies refine their marketing strategies to gain a competitive advantage.

  • The global air cargo market 2026-2030 is rapidly evolving, driven by the need to balance efficiency, security, and sustainability. A core focus is optimizing cargo build up with AI, which allows handlers to maximize space and reduce loading times. This pairs with efforts in improving aircraft turnaround time efficiency, a critical metric for profitability at congested hubs.
  • For shippers, real time visibility in air freight has become a standard expectation, particularly for high-value shipments. However, significant hurdles remain, especially the challenges in pharmaceutical air transport, where maintaining the integrity of biologics through advanced cold chain logistics for biologics is non-negotiable.
  • The impact of e commerce on belly cargo is reshaping network strategies, forcing carriers to re-evaluate capacity on passenger routes. This is compounded by the need for regulatory compliance for special cargo, including the transport of high value electronics and adhering to strict guidelines for hazardous materials.
  • Financially, all operators are focused on managing fuel price volatility costs, with some exploring sustainable aviation fuel in logistics to meet both environmental and economic goals. Digital freight marketplaces for SMEs are democratizing access to capacity, while automation is key for integrating last mile delivery services and automating customs clearance for express cargo.
  • The benefits of passenger to freighter conversions are being weighed against new-builds, as security screening technology advancements and predictive maintenance for freighter fleets become standard. Finally, mitigating geopolitical risks in shipping requires network agility, where the choice between ACMI leasing vs owning freighters and leveraging dynamic pricing in freight plays a crucial role.

What are the key market drivers leading to the rise in the adoption of Air Cargo Industry?

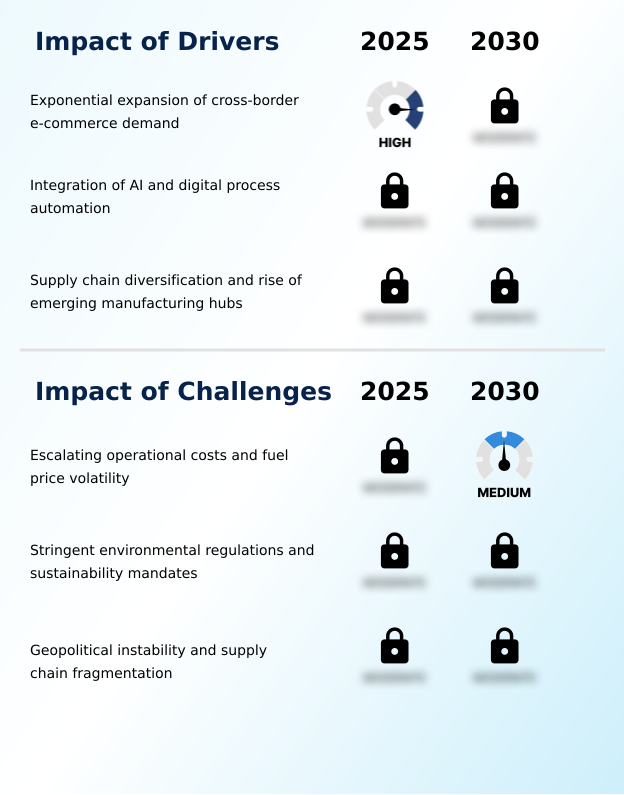
  • The exponential expansion of cross-border e-commerce demand serves as a key driver for the market's growth.

  • The market's primary growth engine is the relentless expansion of cross-border e-commerce fulfillment, which has structurally shifted demand towards faster, more reliable express cargo services.
  • This has fueled the growth of multi-nodal supply chains, where automated sorting systems at key hubs can accelerate parcel processing by over 30%.
  • Freight forwarding platforms are becoming essential for managing the complexity of these networks, which increasingly require seamless last-mile delivery integration. To meet the surge in volume, operators are expanding capacity through strategic ACMI leasing and investments in new aircraft.
  • The boom in APAC, where demand recently surged by 13.6% in a single period, underscores this trend.
  • Advanced demand forecasting models and customs clearance automation are critical for handling the millions of individual shipments that now define a significant portion of total cargo tonne-kilometers.

What are the market trends shaping the Air Cargo Industry?

  • The accelerated proliferation of digital freight marketplaces and real-time visibility solutions is a key upcoming trend. This shift is reshaping how capacity is booked and tracked across the industry.

  • Key trends are reshaping the market, pushing it towards greater efficiency and sustainability. The widespread adoption of digital freight marketplaces provides shippers with unprecedented real-time visibility, allowing for dynamic pricing models that optimize spend. This digital shift, where some carriers now process over 90% of bookings online, is supported by air waybill automation, drastically reducing administrative overhead.
  • Concurrently, a strategic pivot toward sustainability is driving significant fleet modernization. Carriers are investing in next-generation aircraft and exploring passenger-to-freighter conversions to improve fuel efficiency.
  • The push for carbon offsetting schemes is accelerating the uptake of sustainable aviation fuel, with new aircraft models offering up to a 25% reduction in CO2 emissions per ton-kilometer, aligning with stricter global environmental standards and enhancing capacity management systems.

What challenges does the Air Cargo Industry face during its growth?

  • Escalating operational costs, alongside significant fuel price volatility, present a key challenge affecting the industry's growth trajectory.

  • The market faces significant financial and regulatory pressures that challenge profitability and operational fluidity. Escalating operational costs, with fuel surcharges constituting over 30% of expenses for some carriers, require disciplined fuel surcharge management. This is compounded by the need for geopolitical risk mitigation as trade-lane disruptions can force costly rerouting.
  • Furthermore, adhering to stringent dangerous goods regulations and implementing advanced cargo screening technology add layers of complexity and expense. Maintaining a secure chain of custody and ensuring precise unit load device tracking are non-negotiable but require continuous investment. While belly cargo capacity offers a cost-effective option, its availability is tied to passenger-route volatility.
  • Navigating these challenges while managing reverse logistics operations and the transport of hazardous materials remains a primary focus for all stakeholders.

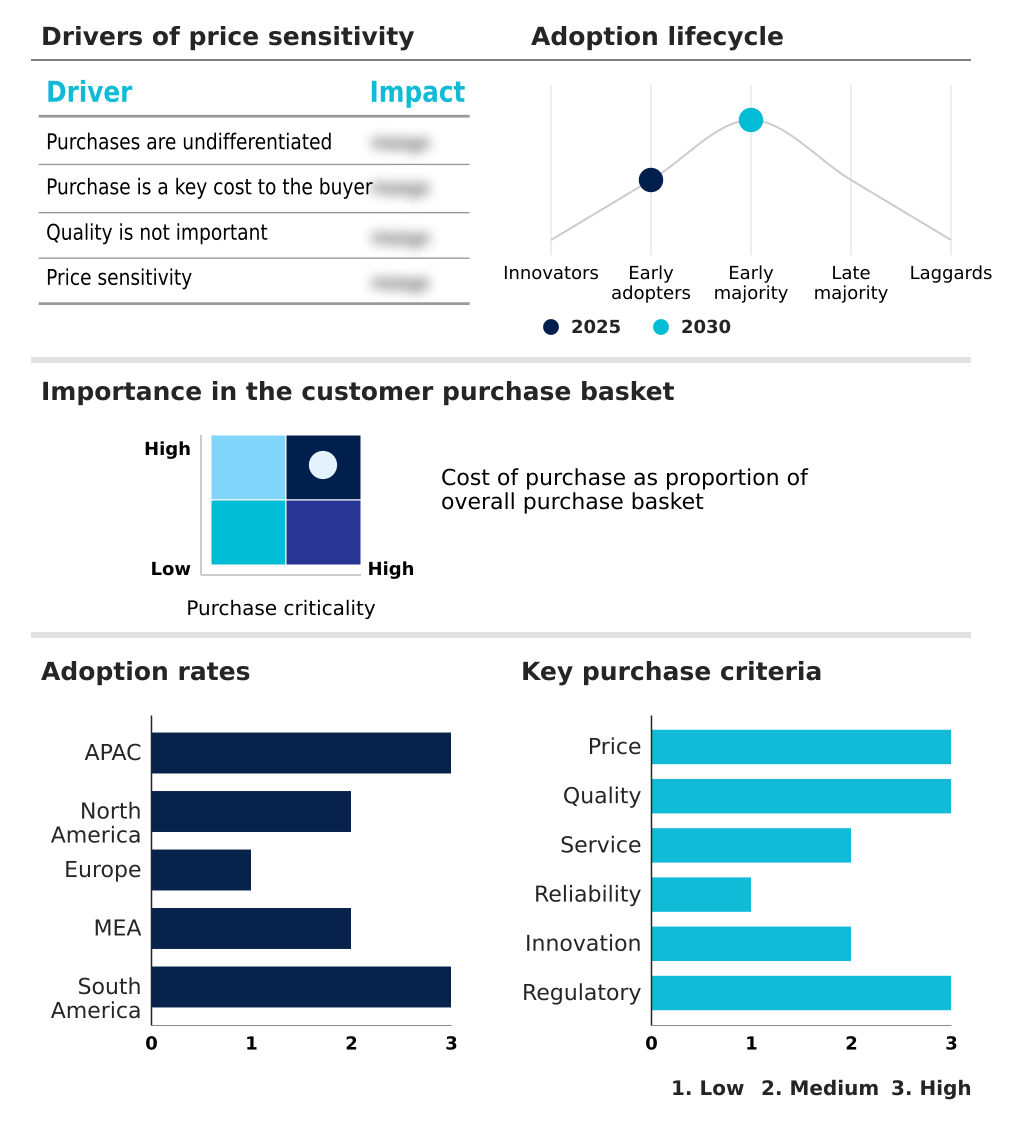
Exclusive Technavio Analysis on Customer Landscape

The air cargo market forecasting report includes the adoption lifecycle of the market, covering from the innovator’s stage to the laggard’s stage. It focuses on adoption rates in different regions based on penetration. Furthermore, the air cargo market report also includes key purchase criteria and drivers of price sensitivity to help companies evaluate and develop their market growth analysis strategies.

Customer Landscape of Air Cargo Industry

Competitive Landscape

Companies are implementing various strategies, such as strategic alliances, air cargo market forecast, partnerships, mergers and acquisitions, geographical expansion, and product/service launches, to enhance their presence in the industry.

Air France KLM Martinair Cargo - Digital booking platforms and specialized cargo services are enhancing flexibility, streamlining air freight procurement for evolving global trade dynamics.

The industry research and growth report includes detailed analyses of the competitive landscape of the market and information about key companies, including:

  • Air France KLM Martinair Cargo
  • AirBridgeCargo Airlines
  • Ana Holdings Inc.
  • Atlas Air Worldwide Holdings
  • Cargolux Airlines International
  • Cathay Pacific Airways Ltd.
  • China Airlines Ltd.
  • DHL International GmbH
  • Etihad Cargo
  • EVA Airways Corporation
  • FedEx Corp.
  • Japan Airlines Co. Ltd.
  • Korean Air Lines Co. Ltd.
  • Lufthansa Cargo AG
  • Qatar Airways Cargo
  • Silk Way West Airlines
  • Singapore Airlines Ltd.
  • The Emirates Group
  • United Parcel Service Inc.
  • Western Global Airlines LLC

Qualitative and quantitative analysis of companies has been conducted to help clients understand the wider business environment as well as the strengths and weaknesses of key industry players. Data is qualitatively analyzed to categorize companies as pure play, category-focused, industry-focused, and diversified; it is quantitatively analyzed to categorize companies as dominant, leading, strong, tentative, and weak.

Recent Development and News in Air cargo market

  • In April 2025, Japan Airlines Co. Ltd. and Cargolux Airlines International began a strategic partnership on cargo routes connecting Narita with Luxembourg and Chicago to enhance connectivity between Asia, Europe, and North America.
  • In March 2025, DHL International GmbH expanded its dedicated air freight capacity between Asia and Europe with new weekly Boeing 777F rotations to address surging demand on strategic trade lanes.
  • In February 2025, Air France KLM Martinair Cargo launched a new dedicated freighter service to Seoul Incheon to strengthen its presence in the North Asian market and capitalize on its digital booking platform's success.
  • In November 2024, Atlas Air Worldwide Holdings placed a firm order for 20 Airbus A350F freighters to modernize its fleet and enhance fuel efficiency, meeting upcoming ICAO CO2 emission standards.

Dive into Technavio’s robust research methodology, blending expert interviews, extensive data synthesis, and validated models for unparalleled Air Cargo Market insights. See full methodology.

Market Scope
Page number 301
Base year 2025
Historic period 2020-2024
Forecast period 2026-2030
Growth momentum & CAGR Accelerate at a CAGR of 5.1%
Market growth 2026-2030 USD 21328.8 million
Market structure Fragmented
YoY growth 2025-2026(%) 4.9%
Key countries China, Japan, India, South Korea, Singapore, Australia, US, Canada, Mexico, Germany, UK, France, The Netherlands, Belgium, Italy, UAE, Saudi Arabia, Qatar, Turkey, South Africa, Brazil, Chile and Colombia
Competitive landscape Leading Companies, Market Positioning of Companies, Competitive Strategies, and Industry Risks

Request Free Sample

Research Analyst Overview

  • The Air Cargo Market is navigating a period of profound structural change, where digital transformation and specialization are paramount for competitive positioning. Boardroom decisions are increasingly focused on balancing fleet modernization with stringent environmental mandates.
  • A core element of this evolution is the widespread adoption of digital freight marketplaces and freight forwarding platforms, which streamline operations by automating the air waybill and customs clearance processes. Technology for cargo build-up optimization and predictive maintenance algorithms are delivering tangible efficiency gains, with some automated sorting systems reducing cargo processing times by over 30%.
  • The industry's pivot toward high-value segments is evident in the expansion of specialized services for pharmaceutical transport and perishable goods handling, which demand sophisticated cold chain logistics, including certified temperature-controlled containers and a secure chain of custody.
  • Simultaneously, the rise of e-commerce logistics continues to drive demand for express cargo services, measured in cargo tonne-kilometers, and necessitates resilient unit load device tracking.
  • This dynamic environment requires adherence to complex dangerous goods regulations and the strategic use of dynamic pricing models to manage volatile operational costs, ensuring that carriers offering special cargo handling and superior aircraft turnaround time maintain a market advantage.

What are the Key Data Covered in this Air Cargo Market Research and Growth Report?

  • What is the expected growth of the Air Cargo Market between 2026 and 2030?

    • USD 21.33 billion, at a CAGR of 5.1%

  • What segmentation does the market report cover?

    • The report is segmented by End-user (Manufacturing, FMCG and retail, Pharmaceuticals and chemicals, and Others), Type (Belly cargo, and Freighter), Service Type (Express cargo, General cargo, and Special cargo) and Geography (APAC, North America, Europe, Middle East and Africa, South America)

  • Which regions are analyzed in the report?

    • APAC, North America, Europe, Middle East and Africa and South America

  • What are the key growth drivers and market challenges?

    • Exponential expansion of cross-border e-commerce demand, Escalating operational costs and fuel price volatility

  • Who are the major players in the Air Cargo Market?

    • Air France KLM Martinair Cargo, AirBridgeCargo Airlines, Ana Holdings Inc., Atlas Air Worldwide Holdings, Cargolux Airlines International, Cathay Pacific Airways Ltd., China Airlines Ltd., DHL International GmbH, Etihad Cargo, EVA Airways Corporation, FedEx Corp., Japan Airlines Co. Ltd., Korean Air Lines Co. Ltd., Lufthansa Cargo AG, Qatar Airways Cargo, Silk Way West Airlines, Singapore Airlines Ltd., The Emirates Group, United Parcel Service Inc. and Western Global Airlines LLC

Market Research Insights

  • The market is undergoing a significant operational transformation, driven by technological integration and shifting trade dynamics. Digitalization is paramount, with some carriers achieving over 90% of bookings through online portals, which drastically reduces administrative overhead. This shift allows for enhanced capacity management systems and route network optimization, improving load factors by up to 15%.
  • The strategic move towards supply chain diversification has increased the complexity of multi-nodal supply chains, compelling operators to adopt more flexible solutions like ACMI leasing and on-demand cargo charter services. Furthermore, advanced demand forecasting models are being deployed to mitigate the financial impact of fuel surcharge management and navigate geopolitical risk mitigation strategies effectively.
  • This data-centric approach ensures carriers can maintain resilience while adapting to evolving global trade patterns.

We can help! Our analysts can customize this air cargo market research report to meet your requirements.

Get in touch

1. Executive Summary

1.1 Market overview

Executive Summary - Chart on Market Overview
Executive Summary - Data Table on Market Overview
Executive Summary - Chart on Global Market Characteristics
Executive Summary - Chart on Market by Geography
Executive Summary - Chart on Market Segmentation by End-user
Executive Summary - Chart on Market Segmentation by Type
Executive Summary - Chart on Market Segmentation by Service Type
Executive Summary - Chart on Incremental Growth
Executive Summary - Data Table on Incremental Growth
Executive Summary - Chart on Company Market Positioning

2. Technavio Analysis

2.1 Analysis of price sensitivity, lifecycle, customer purchase basket, adoption rates, and purchase criteria

2.2 Criticality of inputs and Factors of differentiation

Chart on Overview on criticality of inputs and factors of differentiation

2.3 Factors of disruption

Chart on Overview on factors of disruption

2.4 Impact of drivers and challenges

Chart on Impact of drivers and challenges in 2025 and 2030

3. Market Landscape

3.1 Market ecosystem

Chart on Parent Market
Data Table on - Parent Market

3.2 Market characteristics

Chart on Market characteristics analysis

3.3 Value chain analysis

Chart on Value chain analysis

4. Market Sizing

4.1 Market definition

Data Table on Offerings of companies included in the market definition

4.2 Market segment analysis

Market segments

4.3 Market size 2025

4.4 Market outlook: Forecast for 2025-2030

Chart on Global - Market size and forecast 2025-2030 ($ million)
Data Table on Global - Market size and forecast 2025-2030 ($ million)
Chart on Global Market: Year-over-year growth 2025-2030 (%)
Data Table on Global Market: Year-over-year growth 2025-2030 (%)

5. Historic Market Size

5.1 Global Air Cargo Market 2020 - 2024

Historic Market Size - Data Table on Global Air Cargo Market 2020 - 2024 ($ million)

5.2 End-user segment analysis 2020 - 2024

Historic Market Size - End-user Segment 2020 - 2024 ($ million)

5.3 Type segment analysis 2020 - 2024

Historic Market Size - Type Segment 2020 - 2024 ($ million)

5.4 Service Type segment analysis 2020 - 2024

Historic Market Size - Service Type Segment 2020 - 2024 ($ million)

5.5 Geography segment analysis 2020 - 2024

Historic Market Size - Geography Segment 2020 - 2024 ($ million)

5.6 Country segment analysis 2020 - 2024

Historic Market Size - Country Segment 2020 - 2024 ($ million)

6. Qualitative Analysis

6.1 Impact of AI on global air cargo market

6.2 Impact of geopolitical conflict on global air cargo market

7. Five Forces Analysis

7.1 Five forces summary

Five forces analysis - Comparison between 2025 and 2030

7.2 Bargaining power of buyers

Bargaining power of buyers - Impact of key factors 2025 and 2030

7.3 Bargaining power of suppliers

Bargaining power of suppliers - Impact of key factors in 2025 and 2030

7.4 Threat of new entrants

Threat of new entrants - Impact of key factors in 2025 and 2030

7.5 Threat of substitutes

Threat of substitutes - Impact of key factors in 2025 and 2030

7.6 Threat of rivalry

Threat of rivalry - Impact of key factors in 2025 and 2030

7.7 Market condition

Chart on Market condition - Five forces 2025 and 2030

8. Market Segmentation by End-user

8.1 Market segments

Chart on End-user - Market share 2025-2030 (%)
Data Table on End-user - Market share 2025-2030 (%)

8.2 Comparison by End-user

Chart on Comparison by End-user
Data Table on Comparison by End-user

8.3 Manufacturing - Market size and forecast 2025-2030

Chart on Manufacturing - Market size and forecast 2025-2030 ($ million)
Data Table on Manufacturing - Market size and forecast 2025-2030 ($ million)
Chart on Manufacturing - Year-over-year growth 2025-2030 (%)
Data Table on Manufacturing - Year-over-year growth 2025-2030 (%)

8.4 FMCG and retail - Market size and forecast 2025-2030

Chart on FMCG and retail - Market size and forecast 2025-2030 ($ million)
Data Table on FMCG and retail - Market size and forecast 2025-2030 ($ million)
Chart on FMCG and retail - Year-over-year growth 2025-2030 (%)
Data Table on FMCG and retail - Year-over-year growth 2025-2030 (%)

8.5 Pharmaceuticals and chemicals - Market size and forecast 2025-2030

Chart on Pharmaceuticals and chemicals - Market size and forecast 2025-2030 ($ million)
Data Table on Pharmaceuticals and chemicals - Market size and forecast 2025-2030 ($ million)
Chart on Pharmaceuticals and chemicals - Year-over-year growth 2025-2030 (%)
Data Table on Pharmaceuticals and chemicals - Year-over-year growth 2025-2030 (%)

8.6 Others - Market size and forecast 2025-2030

Chart on Others - Market size and forecast 2025-2030 ($ million)
Data Table on Others - Market size and forecast 2025-2030 ($ million)
Chart on Others - Year-over-year growth 2025-2030 (%)
Data Table on Others - Year-over-year growth 2025-2030 (%)

8.7 Market opportunity by End-user

Market opportunity by End-user ($ million)
Data Table on Market opportunity by End-user ($ million)

9. Market Segmentation by Type

9.1 Market segments

Chart on Type - Market share 2025-2030 (%)
Data Table on Type - Market share 2025-2030 (%)

9.2 Comparison by Type

Chart on Comparison by Type
Data Table on Comparison by Type

9.3 Belly cargo - Market size and forecast 2025-2030

Chart on Belly cargo - Market size and forecast 2025-2030 ($ million)
Data Table on Belly cargo - Market size and forecast 2025-2030 ($ million)
Chart on Belly cargo - Year-over-year growth 2025-2030 (%)
Data Table on Belly cargo - Year-over-year growth 2025-2030 (%)

9.4 Freighter - Market size and forecast 2025-2030

Chart on Freighter - Market size and forecast 2025-2030 ($ million)
Data Table on Freighter - Market size and forecast 2025-2030 ($ million)
Chart on Freighter - Year-over-year growth 2025-2030 (%)
Data Table on Freighter - Year-over-year growth 2025-2030 (%)

9.5 Market opportunity by Type

Market opportunity by Type ($ million)
Data Table on Market opportunity by Type ($ million)

10. Market Segmentation by Service Type

10.1 Market segments

Chart on Service Type - Market share 2025-2030 (%)
Data Table on Service Type - Market share 2025-2030 (%)

10.2 Comparison by Service Type

Chart on Comparison by Service Type
Data Table on Comparison by Service Type

10.3 Express cargo - Market size and forecast 2025-2030

Chart on Express cargo - Market size and forecast 2025-2030 ($ million)
Data Table on Express cargo - Market size and forecast 2025-2030 ($ million)
Chart on Express cargo - Year-over-year growth 2025-2030 (%)
Data Table on Express cargo - Year-over-year growth 2025-2030 (%)

10.4 General cargo - Market size and forecast 2025-2030

Chart on General cargo - Market size and forecast 2025-2030 ($ million)
Data Table on General cargo - Market size and forecast 2025-2030 ($ million)
Chart on General cargo - Year-over-year growth 2025-2030 (%)
Data Table on General cargo - Year-over-year growth 2025-2030 (%)

10.5 Special cargo - Market size and forecast 2025-2030

Chart on Special cargo - Market size and forecast 2025-2030 ($ million)
Data Table on Special cargo - Market size and forecast 2025-2030 ($ million)
Chart on Special cargo - Year-over-year growth 2025-2030 (%)
Data Table on Special cargo - Year-over-year growth 2025-2030 (%)

10.6 Market opportunity by Service Type

Market opportunity by Service Type ($ million)
Data Table on Market opportunity by Service Type ($ million)

11. Customer Landscape

11.1 Customer landscape overview

Analysis of price sensitivity, lifecycle, customer purchase basket, adoption rates, and purchase criteria

12. Geographic Landscape

12.1 Geographic segmentation

Chart on Market share by geography 2025-2030 (%)
Data Table on Market share by geography 2025-2030 (%)

12.2 Geographic comparison

Chart on Geographic comparison
Data Table on Geographic comparison

12.3 APAC - Market size and forecast 2025-2030

Chart on APAC - Market size and forecast 2025-2030 ($ million)
Data Table on APAC - Market size and forecast 2025-2030 ($ million)
Chart on APAC - Year-over-year growth 2025-2030 (%)
Data Table on APAC - Year-over-year growth 2025-2030 (%)
Chart on Regional Comparison - APAC
Data Table on Regional Comparison - APAC

12.3.1 China - Market size and forecast 2025-2030

Chart on China - Market size and forecast 2025-2030 ($ million)
Data Table on China - Market size and forecast 2025-2030 ($ million)
Chart on China - Year-over-year growth 2025-2030 (%)
Data Table on China - Year-over-year growth 2025-2030 (%)

12.3.2 Japan - Market size and forecast 2025-2030

Chart on Japan - Market size and forecast 2025-2030 ($ million)
Data Table on Japan - Market size and forecast 2025-2030 ($ million)
Chart on Japan - Year-over-year growth 2025-2030 (%)
Data Table on Japan - Year-over-year growth 2025-2030 (%)

12.3.3 India - Market size and forecast 2025-2030

Chart on India - Market size and forecast 2025-2030 ($ million)
Data Table on India - Market size and forecast 2025-2030 ($ million)
Chart on India - Year-over-year growth 2025-2030 (%)
Data Table on India - Year-over-year growth 2025-2030 (%)

12.3.4 South Korea - Market size and forecast 2025-2030

Chart on South Korea - Market size and forecast 2025-2030 ($ million)
Data Table on South Korea - Market size and forecast 2025-2030 ($ million)
Chart on South Korea - Year-over-year growth 2025-2030 (%)
Data Table on South Korea - Year-over-year growth 2025-2030 (%)

12.3.5 Singapore - Market size and forecast 2025-2030

Chart on Singapore - Market size and forecast 2025-2030 ($ million)
Data Table on Singapore - Market size and forecast 2025-2030 ($ million)
Chart on Singapore - Year-over-year growth 2025-2030 (%)
Data Table on Singapore - Year-over-year growth 2025-2030 (%)

12.3.6 Australia - Market size and forecast 2025-2030

Chart on Australia - Market size and forecast 2025-2030 ($ million)
Data Table on Australia - Market size and forecast 2025-2030 ($ million)
Chart on Australia - Year-over-year growth 2025-2030 (%)
Data Table on Australia - Year-over-year growth 2025-2030 (%)

12.4 North America - Market size and forecast 2025-2030

Chart on North America - Market size and forecast 2025-2030 ($ million)
Data Table on North America - Market size and forecast 2025-2030 ($ million)
Chart on North America - Year-over-year growth 2025-2030 (%)
Data Table on North America - Year-over-year growth 2025-2030 (%)
Chart on Regional Comparison - North America
Data Table on Regional Comparison - North America

12.4.1 US - Market size and forecast 2025-2030

Chart on US - Market size and forecast 2025-2030 ($ million)
Data Table on US - Market size and forecast 2025-2030 ($ million)
Chart on US - Year-over-year growth 2025-2030 (%)
Data Table on US - Year-over-year growth 2025-2030 (%)

12.4.2 Canada - Market size and forecast 2025-2030

Chart on Canada - Market size and forecast 2025-2030 ($ million)
Data Table on Canada - Market size and forecast 2025-2030 ($ million)
Chart on Canada - Year-over-year growth 2025-2030 (%)
Data Table on Canada - Year-over-year growth 2025-2030 (%)

12.4.3 Mexico - Market size and forecast 2025-2030

Chart on Mexico - Market size and forecast 2025-2030 ($ million)
Data Table on Mexico - Market size and forecast 2025-2030 ($ million)
Chart on Mexico - Year-over-year growth 2025-2030 (%)
Data Table on Mexico - Year-over-year growth 2025-2030 (%)

12.5 Europe - Market size and forecast 2025-2030

Chart on Europe - Market size and forecast 2025-2030 ($ million)
Data Table on Europe - Market size and forecast 2025-2030 ($ million)
Chart on Europe - Year-over-year growth 2025-2030 (%)
Data Table on Europe - Year-over-year growth 2025-2030 (%)
Chart on Regional Comparison - Europe
Data Table on Regional Comparison - Europe

12.5.1 Germany - Market size and forecast 2025-2030

Chart on Germany - Market size and forecast 2025-2030 ($ million)
Data Table on Germany - Market size and forecast 2025-2030 ($ million)
Chart on Germany - Year-over-year growth 2025-2030 (%)
Data Table on Germany - Year-over-year growth 2025-2030 (%)

12.5.2 UK - Market size and forecast 2025-2030

Chart on UK - Market size and forecast 2025-2030 ($ million)
Data Table on UK - Market size and forecast 2025-2030 ($ million)
Chart on UK - Year-over-year growth 2025-2030 (%)
Data Table on UK - Year-over-year growth 2025-2030 (%)

12.5.3 France - Market size and forecast 2025-2030

Chart on France - Market size and forecast 2025-2030 ($ million)
Data Table on France - Market size and forecast 2025-2030 ($ million)
Chart on France - Year-over-year growth 2025-2030 (%)
Data Table on France - Year-over-year growth 2025-2030 (%)

12.5.4 The Netherlands - Market size and forecast 2025-2030

Chart on The Netherlands - Market size and forecast 2025-2030 ($ million)
Data Table on The Netherlands - Market size and forecast 2025-2030 ($ million)
Chart on The Netherlands - Year-over-year growth 2025-2030 (%)
Data Table on The Netherlands - Year-over-year growth 2025-2030 (%)

12.5.5 Belgium - Market size and forecast 2025-2030

Chart on Belgium - Market size and forecast 2025-2030 ($ million)
Data Table on Belgium - Market size and forecast 2025-2030 ($ million)
Chart on Belgium - Year-over-year growth 2025-2030 (%)
Data Table on Belgium - Year-over-year growth 2025-2030 (%)

12.5.6 Italy - Market size and forecast 2025-2030

Chart on Italy - Market size and forecast 2025-2030 ($ million)
Data Table on Italy - Market size and forecast 2025-2030 ($ million)
Chart on Italy - Year-over-year growth 2025-2030 (%)
Data Table on Italy - Year-over-year growth 2025-2030 (%)

12.6 Middle East and Africa - Market size and forecast 2025-2030

Chart on Middle East and Africa - Market size and forecast 2025-2030 ($ million)
Data Table on Middle East and Africa - Market size and forecast 2025-2030 ($ million)
Chart on Middle East and Africa - Year-over-year growth 2025-2030 (%)
Data Table on Middle East and Africa - Year-over-year growth 2025-2030 (%)
Chart on Regional Comparison - Middle East and Africa
Data Table on Regional Comparison - Middle East and Africa

12.6.1 UAE - Market size and forecast 2025-2030

Chart on UAE - Market size and forecast 2025-2030 ($ million)
Data Table on UAE - Market size and forecast 2025-2030 ($ million)
Chart on UAE - Year-over-year growth 2025-2030 (%)
Data Table on UAE - Year-over-year growth 2025-2030 (%)

12.6.2 Saudi Arabia - Market size and forecast 2025-2030

Chart on Saudi Arabia - Market size and forecast 2025-2030 ($ million)
Data Table on Saudi Arabia - Market size and forecast 2025-2030 ($ million)
Chart on Saudi Arabia - Year-over-year growth 2025-2030 (%)
Data Table on Saudi Arabia - Year-over-year growth 2025-2030 (%)

12.6.3 Qatar - Market size and forecast 2025-2030

Chart on Qatar - Market size and forecast 2025-2030 ($ million)
Data Table on Qatar - Market size and forecast 2025-2030 ($ million)
Chart on Qatar - Year-over-year growth 2025-2030 (%)
Data Table on Qatar - Year-over-year growth 2025-2030 (%)

12.6.4 Turkey - Market size and forecast 2025-2030

Chart on Turkey - Market size and forecast 2025-2030 ($ million)
Data Table on Turkey - Market size and forecast 2025-2030 ($ million)
Chart on Turkey - Year-over-year growth 2025-2030 (%)
Data Table on Turkey - Year-over-year growth 2025-2030 (%)

12.6.5 South Africa - Market size and forecast 2025-2030

Chart on South Africa - Market size and forecast 2025-2030 ($ million)
Data Table on South Africa - Market size and forecast 2025-2030 ($ million)
Chart on South Africa - Year-over-year growth 2025-2030 (%)
Data Table on South Africa - Year-over-year growth 2025-2030 (%)

12.7 South America - Market size and forecast 2025-2030

Chart on South America - Market size and forecast 2025-2030 ($ million)
Data Table on South America - Market size and forecast 2025-2030 ($ million)
Chart on South America - Year-over-year growth 2025-2030 (%)
Data Table on South America - Year-over-year growth 2025-2030 (%)
Chart on Regional Comparison - South America
Data Table on Regional Comparison - South America

12.7.1 Brazil - Market size and forecast 2025-2030

Chart on Brazil - Market size and forecast 2025-2030 ($ million)
Data Table on Brazil - Market size and forecast 2025-2030 ($ million)
Chart on Brazil - Year-over-year growth 2025-2030 (%)
Data Table on Brazil - Year-over-year growth 2025-2030 (%)

12.7.2 Chile - Market size and forecast 2025-2030

Chart on Chile - Market size and forecast 2025-2030 ($ million)
Data Table on Chile - Market size and forecast 2025-2030 ($ million)
Chart on Chile - Year-over-year growth 2025-2030 (%)
Data Table on Chile - Year-over-year growth 2025-2030 (%)

12.7.3 Colombia - Market size and forecast 2025-2030

Chart on Colombia - Market size and forecast 2025-2030 ($ million)
Data Table on Colombia - Market size and forecast 2025-2030 ($ million)
Chart on Colombia - Year-over-year growth 2025-2030 (%)
Data Table on Colombia - Year-over-year growth 2025-2030 (%)

12.8 Market opportunity by geography

Market opportunity by geography ($ million)
Data Tables on Market opportunity by geography ($ million)

13. Drivers, Challenges, and Opportunity

13.1 Market drivers

Exponential expansion of cross-border e-commerce demand
Integration of AI and digital process automation
Supply chain diversification and rise of emerging manufacturing hubs

13.2 Market challenges

Escalating operational costs and fuel price volatility
Stringent environmental regulations and sustainability mandates
Geopolitical instability and supply chain fragmentation

13.3 Impact of drivers and challenges

Impact of drivers and challenges in 2025 and 2030

13.4 Market opportunities

Accelerated proliferation of digital freight marketplaces and real-time visibility
Expansion of specialized cold chain infrastructure for life sciences
Strategic pivot toward fleet modernization and sustainable aviation fuel

14. Competitive Landscape

14.1 Overview

14.2

Overview on criticality of inputs and factors of differentiation

14.3 Landscape disruption

Overview on factors of disruption

14.4 Industry risks

Impact of key risks on business

15. Competitive Analysis

15.1 Companies profiled

Companies covered

15.2 Company ranking index

15.3 Market positioning of companies

Matrix on companies position and classification

15.4 Air France KLM Martinair Cargo

Air France KLM Martinair Cargo - Overview
Air France KLM Martinair Cargo - Product / Service
Air France KLM Martinair Cargo - Key offerings
SWOT

15.5 AirBridgeCargo Airlines

AirBridgeCargo Airlines - Overview
AirBridgeCargo Airlines - Product / Service
AirBridgeCargo Airlines - Key offerings
SWOT

15.6 Ana Holdings Inc.

Ana Holdings Inc. - Overview
Ana Holdings Inc. - Business segments
Ana Holdings Inc. - Key offerings
Ana Holdings Inc. - Segment focus
SWOT

15.7 Atlas Air Worldwide Holdings

Atlas Air Worldwide Holdings - Overview
Atlas Air Worldwide Holdings - Product / Service
Atlas Air Worldwide Holdings - Key offerings
SWOT

15.8 Cathay Pacific Airways Ltd.

Cathay Pacific Airways Ltd. - Overview
Cathay Pacific Airways Ltd. - Business segments
Cathay Pacific Airways Ltd. - Key offerings
Cathay Pacific Airways Ltd. - Segment focus
SWOT

15.9 China Airlines Ltd.

China Airlines Ltd. - Overview
China Airlines Ltd. - Business segments
China Airlines Ltd. - Key offerings
China Airlines Ltd. - Segment focus
SWOT

15.10 DHL International GmbH

DHL International GmbH - Overview
DHL International GmbH - Business segments
DHL International GmbH - Key news
DHL International GmbH - Key offerings
DHL International GmbH - Segment focus
SWOT

15.11 EVA Airways Corporation

EVA Airways Corporation - Overview
EVA Airways Corporation - Product / Service
EVA Airways Corporation - Key offerings
SWOT

15.12 FedEx Corp.

FedEx Corp. - Overview
FedEx Corp. - Business segments
FedEx Corp. - Key offerings
FedEx Corp. - Segment focus
SWOT

15.13 Japan Airlines Co. Ltd.

Japan Airlines Co. Ltd. - Overview
Japan Airlines Co. Ltd. - Product / Service
Japan Airlines Co. Ltd. - Key offerings
SWOT

15.14 Korean Air Lines Co. Ltd.

Korean Air Lines Co. Ltd. - Overview
Korean Air Lines Co. Ltd. - Business segments
Korean Air Lines Co. Ltd. - Key offerings
Korean Air Lines Co. Ltd. - Segment focus
SWOT

15.15 Lufthansa Cargo AG

Lufthansa Cargo AG - Overview
Lufthansa Cargo AG - Product / Service
Lufthansa Cargo AG - Key offerings
SWOT

15.16 Singapore Airlines Ltd.

Singapore Airlines Ltd. - Overview
Singapore Airlines Ltd. - Business segments
Singapore Airlines Ltd. - Key offerings
Singapore Airlines Ltd. - Segment focus
SWOT

15.17 The Emirates Group

The Emirates Group - Overview
The Emirates Group - Business segments
The Emirates Group - Key offerings
The Emirates Group - Segment focus
SWOT

15.18 United Parcel Service Inc.

United Parcel Service Inc. - Overview
United Parcel Service Inc. - Business segments
United Parcel Service Inc. - Key offerings
United Parcel Service Inc. - Segment focus
SWOT

16. Appendix

16.1 Scope of the report

Market definition
Objectives
Notes and caveats

16.2 Inclusions and exclusions checklist

Inclusions checklist
Exclusions checklist

16.3 Currency conversion rates for US$

16.4 Research methodology

16.5 Data procurement

Information sources

16.6 Data validation

16.7 Validation techniques employed for market sizing

16.8 Data synthesis

16.9 360 degree market analysis

16.10 List of abbreviations

Research Methodology

Technavio presents a detailed picture of the market by way of study, synthesis, and summation of data from multiple sources. The analysts have presented the various facets of the market with a particular focus on identifying the key industry influencers. The data thus presented is comprehensive, reliable, and the result of extensive research, both primary and secondary.

INFORMATION SOURCES

Primary sources

  • Manufacturers and suppliers
  • Channel partners
  • Industry experts
  • Strategic decision makers

Secondary sources

  • Industry journals and periodicals
  • Government data
  • Financial reports of key industry players
  • Historical data
  • Press releases

DATA ANALYSIS

Data Synthesis

  • Collation of data
  • Estimation of key figures
  • Analysis of derived insights

Data Validation

  • Triangulation with data models
  • Reference against proprietary databases
  • Corroboration with industry experts

REPORT WRITING

Qualitative

  • Market drivers
  • Market challenges
  • Market trends
  • Five forces analysis

Quantitative

  • Market size and forecast
  • Market segmentation
  • Geographical insights
  • Competitive landscape

Interested in this report?

Get your sample now to see our research methodology and insights!

Download Now

Frequently Asked Questions

Air Cargo market growth will increase by USD 21328.8 million during 2026-2030.

The Air Cargo market is expected to grow at a CAGR of 5.1% during 2026-2030.

Air Cargo market is segmented by End-user (Manufacturing, FMCG and retail, Pharmaceuticals and chemicals, Others) Type (Belly cargo, Freighter) Service type (Express cargo, General cargo, Special cargo)

Air France KLM Martinair Cargo, AirBridgeCargo Airlines, Ana Holdings Inc., Atlas Air Worldwide Holdings, Cargolux Airlines International, Cathay Pacific Airways Ltd., China Airlines Ltd., DHL International GmbH, Etihad Cargo, EVA Airways Corporation, FedEx Corp., Japan Airlines Co. Ltd., Korean Air Lines Co. Ltd., Lufthansa Cargo AG, Qatar Airways Cargo, Silk Way West Airlines, Singapore Airlines Ltd., The Emirates Group, United Parcel Service Inc., Western Global Airlines LLC are a few of the key vendors in the Air Cargo market.

APAC will register the highest growth rate of 32.4% among the other regions. Therefore, the Air Cargo market in APAC is expected to garner significant business opportunities for the vendors during the forecast period.

China, Japan, India, South Korea, Singapore, Australia, US, Canada, Mexico, Germany, UK, France, The Netherlands, Belgium, Italy, UAE, Saudi Arabia, Qatar, Turkey, South Africa, Brazil, Chile, Colombia

  • Exponential expansion of cross-border e-commerce demand is the driving factor this market.

The Air Cargo market vendors should focus on grabbing business opportunities from the End-user segment as it accounted for the largest market share in the base year.
RIA - Research AI Assistant
Ask RIA