Air Freight Market Analysis, Size, and Forecast 2026-2030: APAC (China, Japan, and India), North America (US, Canada, and Mexico), Europe (Germany, UK, and Spain), Middle East and Africa (UAE, Saudi Arabia, and Turkey), South America (Brazil and Argentina), and Rest of World (ROW)

Air Freight Market Analysis, Size, and Forecast 2026-2030:
APAC (China, Japan, and India), North America (US, Canada, and Mexico), Europe (Germany, UK, and Spain), Middle East and Africa (UAE, Saudi Arabia, and Turkey), South America (Brazil and Argentina), and Rest of World (ROW)

Published: May 2026 290 Pages SKU: IRTNTR77725

Market Overview at a Glance

$100.9 B
Market Opportunity
7.4%
CAGR 2025 - 2030
31.6%
North America Growth
$159.9 B
Commercial segment 2024

Air Freight Market Size 2026-2030

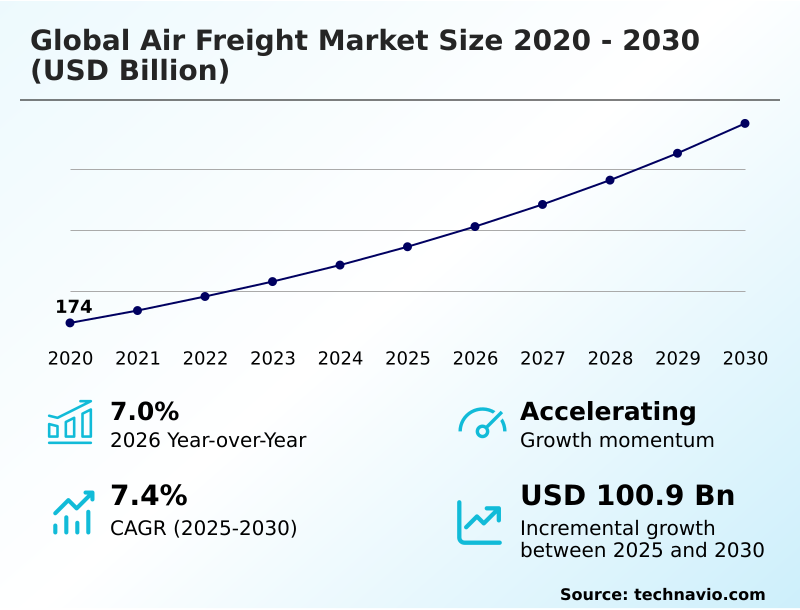
The air freight market size is valued to increase by USD 100.9 billion, at a CAGR of 7.4% from 2025 to 2030. Rapid expansion of cross-border e-commerce and digital retail platforms will drive the air freight market.

Major Market Trends & Insights

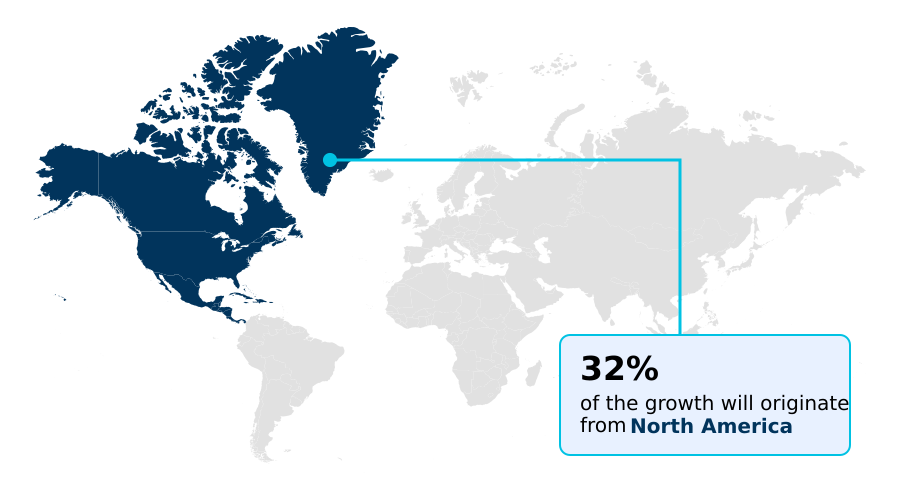
  • North America dominated the market and accounted for a 31.6% growth during the forecast period.
  • By End-user - Commercial segment was valued at USD 159.9 billion in 2024
  • By Type - International segment accounted for the largest market revenue share in 2024

Market Size & Forecast

  • Market Opportunities: USD 163.2 billion
  • Market Future Opportunities: USD 100.9 billion
  • CAGR from 2025 to 2030 : 7.4%

Market Summary

  • The air freight market is a vital artery for global commerce, defined by its capacity for rapid, long-distance transport of high-value and time-sensitive goods. Market dynamics are increasingly influenced by the structural shift towards e-commerce, which necessitates robust e-commerce fulfillment solutions and advanced inventory management solutions.
  • A primary trend is the digitalization of operations, where technologies like AI and blockchain enhance supply chain visibility and efficiency. For example, a pharmaceutical firm can leverage specialized cold chain services with real-time tracking to transport temperature-sensitive vaccines across continents, ensuring product integrity and regulatory compliance.
  • Simultaneously, the industry grapples with challenges such as fuel price volatility, stringent regulations, and the need for sustainable practices. Success hinges on balancing speed, cost, and reliability while adapting to geopolitical shifts and evolving customer demands for integrated logistics services and greater transparency.

What will be the Size of the Air Freight Market during the forecast period?

Get Key Insights on Market Forecast (PDF) Get Free Sample

How is the Air Freight Market Segmented?

The air freight industry research report provides comprehensive data (region-wise segment analysis), with forecasts and estimates in "USD billion" for the period 2026-2030, as well as historical data from 2020-2024 for the following segments.
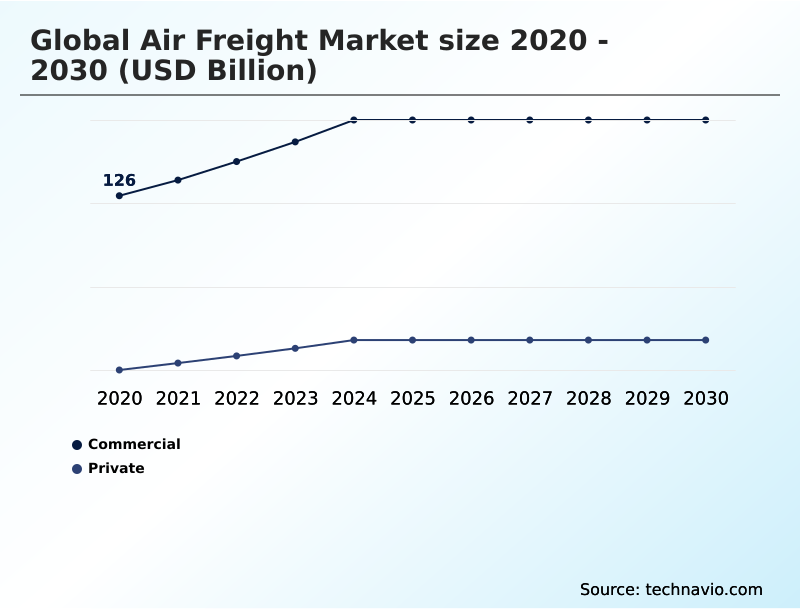
  • End-user
    • Commercial
    • Private
  • Type
    • International
    • Domestic
  • Application
    • Food and perishable goods
    • Industrial materials
    • Equipment and machinery
    • Others
  • Geography
    • APAC
      • China
      • Japan
      • India
    • North America
      • US
      • Canada
      • Mexico
    • Europe
      • Germany
      • UK
      • Spain
    • Middle East and Africa
      • UAE
      • Saudi Arabia
      • Turkey
    • South America
      • Brazil
      • Argentina
    • Rest of World (ROW)

By End-user Insights

The commercial segment is estimated to witness significant growth during the forecast period.

The commercial segment remains the cornerstone of the air freight market, driven by the needs of global trade for time-sensitive supply chains. This sector heavily utilizes dedicated freighter operations for high-tech goods transport and specialized services for perishable cargo handling.

Businesses depend on efficient freight consolidation services and sophisticated air freight revenue management to maintain competitive lead times. The rise of international e-commerce demands advanced cross-border e-commerce logistics, often supplemented by onboard courier services for critical shipments.

Effective logistics cost optimization and integrated logistics services are essential for operations, with transportation management systems improving on-time performance by over 15%. Adherence to global trade compliance frameworks is critical for maintaining market access and ensuring seamless cargo movement.

Get Free Sample

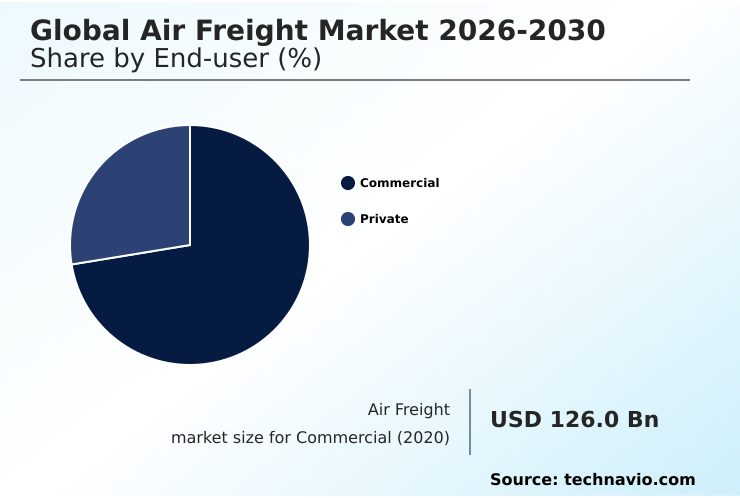
The Commercial segment was valued at USD 159.9 billion in 2024 and showed a gradual increase during the forecast period.

Get Free Sample

Regional Analysis

North America is estimated to contribute 31.6% to the growth of the global market during the forecast period.Technavio’s analysts have elaborately explained the regional trends and drivers that shape the market during the forecast period.

See How Air Freight Market Demand is Rising in North America Get Free Sample

The geographic landscape of the market is primarily shaped by North America and APAC, which together represent over 62% of the market opportunity.

APAC's strength is rooted in its role as a global manufacturing hub, driving demand for cold chain logistics and cargo handling automation. Major airport infrastructure investment continues to support this growth.

In contrast, North America's demand is heavily influenced by e-commerce consumption and the need for sophisticated supply chain network optimization.

The implementation of cargo community systems across these regions has enhanced multimodal transport integration and led to an 18% reduction in documentation errors.

Effective belly-hold capacity optimization and advanced route optimization algorithms are critical for carriers serving these high-volume trade lanes, with regional success dependent on efficient unit load device management and warehouse management systems.

Market Dynamics

Our researchers analyzed the data with 2025 as the base year, along with the key drivers, trends, and challenges. A holistic analysis of drivers will help companies refine their marketing strategies to gain a competitive advantage.

  • Strategic decision-making in the air freight sector is increasingly complex, influenced by a confluence of technological, economic, and regulatory factors. The impact of e-commerce on air cargo pricing has forced operators to adopt more dynamic models, moving away from static rate cards.
  • Concurrently, the role of AI in air freight route optimization is becoming standard practice, enabling carriers to respond to real-time variables. A significant focus is on sustainable aviation fuel adoption in cargo, driven by both regulatory pressure and corporate ESG mandates.
  • Stakeholders are investing heavily in improving efficiency in air cargo ground handling, as this has been identified as a key bottleneck. The use of blockchain applications for air freight documentation is gaining traction, promising to reduce fraud and administrative overhead. For specialized sectors, addressing the challenges in pharmaceutical cold chain logistics is paramount.
  • A critical operational goal is optimizing belly-hold capacity on passenger flights, which offers a cost-effective alternative to dedicated freighters. The future of drone delivery in air cargo is being explored for last-mile solutions. For high-value goods, real-time tracking solutions for high-value cargo provide essential security and transparency.
  • The industry is also focused on managing geopolitical risks in air freight networks and pursuing the digital transformation of freight forwarding services. Other key areas include adopting automation technologies in air cargo warehouses and using predictive analytics for air freight demand forecasting. These initiatives demonstrate how integrated strategies are essential for navigating market complexities.

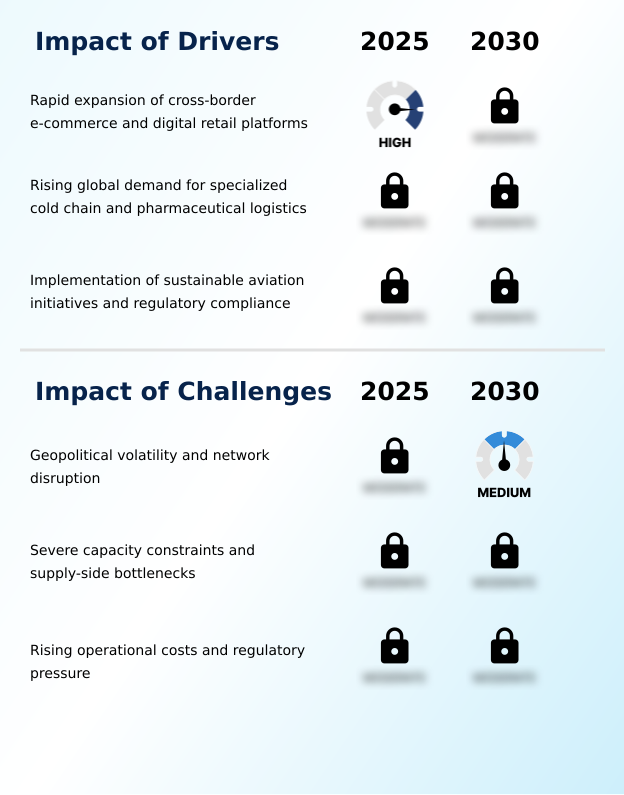
What are the key market drivers leading to the rise in the adoption of Air Freight Industry?

  • The rapid expansion of cross-border e-commerce and digital retail platforms is a key driver propelling growth in the market.

  • Growth in the market is significantly fueled by the expansion of specialized cargo segments and the increasing complexity of global supply chains.
  • The demand for pharmaceutical air freight, requiring stringent temperature-controlled shipping, has surged, with this segment growing 12% faster than general cargo. This necessitates strict adherence to dangerous goods regulations and advanced logistics network design.
  • Consequently, there is a greater reliance on third-party logistics partnerships to manage last-mile logistics integration and ensure compliance. Freight forwarder software is evolving to offer end-to-end solutions that incorporate freight payment and audit functions and monitor service level agreement monitoring.
  • This trend toward specialization and integrated services is creating new opportunities for providers that can offer comprehensive reverse logistics solutions and robust air cargo liability insurance.

What are the market trends shaping the Air Freight Industry?

  • The integration of artificial intelligence and machine learning in global logistics operations is a prominent market trend, reshaping route optimization, capacity forecasting, and inventory management.

  • The market is rapidly advancing through digitalization, with a primary focus on creating interconnected and transparent logistics networks. The adoption of e-air waybill adoption is accelerating, with platforms reporting a 40% reduction in paper-based processing delays. Digital freight marketplaces are centralizing transactions, enhancing price discovery and capacity utilization.
  • This is complemented by the deployment of smart cargo containers equipped with IoT sensors, which provide real-time shipment-level visibility into temperature and shock events. Furthermore, customs brokerage automation, powered by AI, is streamlining cross-border clearance, reducing manual errors by up to 25%.
  • These technological shifts, including the exploration of blockchain for supply chain and digital twin for logistics, are foundational to building more resilient and efficient air cargo ecosystems, enabling better supply chain data analytics and operational control.

What challenges does the Air Freight Industry face during its growth?

  • Geopolitical volatility and network disruption present a key challenge affecting industry growth and operational stability.

  • The market is confronting significant operational and economic headwinds that test supply chain resilience. Geopolitical risk management has become a primary concern, as airspace closures can increase operational costs on key routes by up to 25%. This is compounded by persistent volatility in fuel markets, making aviation fuel price hedging a critical but complex financial strategy.
  • On the operational front, optimizing air cargo capacity planning is a constant challenge, with carriers using dynamic pricing models to improve load factor improvement, often achieving a 5-7% gain. The push for sustainability adds another layer of complexity, requiring investments in sustainable aviation fuel and advanced carbon emissions tracking systems.
  • Ensuring regulatory compliance management across different jurisdictions while maintaining efficient air cargo ground handling and security screening protocols remains a fundamental challenge.

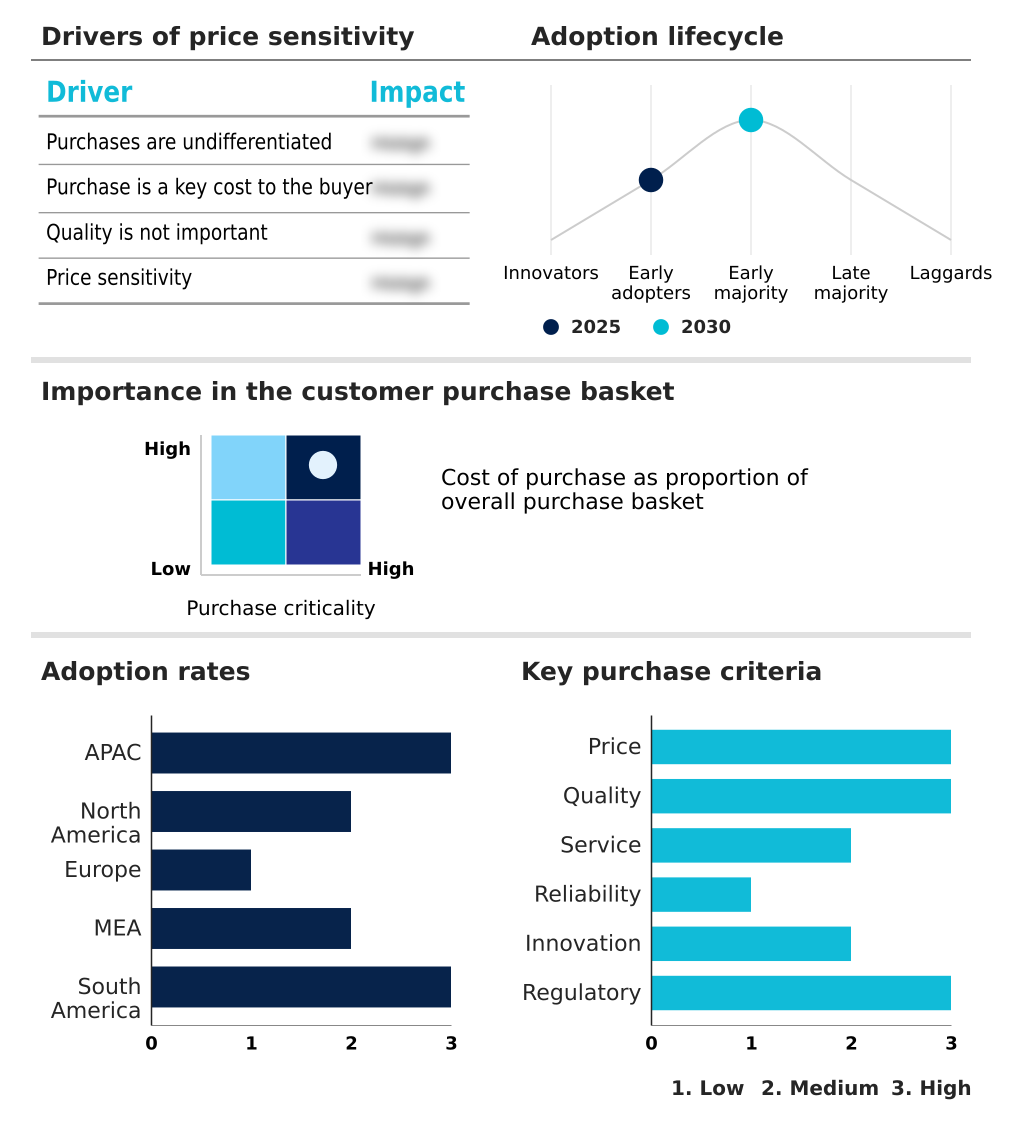
Exclusive Technavio Analysis on Customer Landscape

The air freight market forecasting report includes the adoption lifecycle of the market, covering from the innovator’s stage to the laggard’s stage. It focuses on adoption rates in different regions based on penetration. Furthermore, the air freight market report also includes key purchase criteria and drivers of price sensitivity to help companies evaluate and develop their market growth analysis strategies.

Customer Landscape of Air Freight Industry

Competitive Landscape

Companies are implementing various strategies, such as strategic alliances, air freight market forecast, partnerships, mergers and acquisitions, geographical expansion, and product/service launches, to enhance their presence in the industry.

Aramex PJSC - The company provides integrated express delivery, freight forwarding, and end-to-end supply chain management solutions for diverse commercial and retail clients.

The industry research and growth report includes detailed analyses of the competitive landscape of the market and information about key companies, including:

  • Aramex PJSC
  • CEVA Logistics SA
  • C H Robinson Worldwide Inc.
  • Dachser SE
  • DB Schenker
  • DHL International GmbH
  • DSV AS
  • Expeditors International Inc.
  • FedEx Corp.
  • GEODIS
  • KLN Logistics Group Ltd.
  • Kuehne Nagel Management AG
  • Kintetsu World Express Inc.
  • Logwin AG
  • AP Moller Maersk AS
  • Mainfreight Ltd.
  • Nippon Express Holdings Inc.
  • PSA BDP
  • Toll Holdings Ltd.
  • United Parcel Service Inc.

Qualitative and quantitative analysis of companies has been conducted to help clients understand the wider business environment as well as the strengths and weaknesses of key industry players. Data is qualitatively analyzed to categorize companies as pure play, category-focused, industry-focused, and diversified; it is quantitatively analyzed to categorize companies as dominant, leading, strong, tentative, and weak.

Recent Development and News in Air freight market

  • In September 2024, DHL Group forged a major partnership to procure sustainable aviation fuel, reinforcing its commitment to reducing carbon emissions across its express and forwarding divisions.
  • In December 2024, Amazon strengthened its logistics network by securing additional Boeing 777-200 freighter aircraft to support its global e-commerce delivery commitments.
  • In January 2025, Emirates SkyCargo announced a strategic plan to double its freight capacity, aiming to add twenty new freighter destinations and expand its fleet to meet rising commercial demand.
  • In March 2025, DHL International GmbH expanded its dedicated air freight capacity between Asia and Europe with new Boeing 777F rotations, specifically targeting the growing demand for perishable logistics.

Dive into Technavio’s robust research methodology, blending expert interviews, extensive data synthesis, and validated models for unparalleled Air Freight Market insights. See full methodology.

Market Scope
Page number 290
Base year 2025
Historic period 2020-2024
Forecast period 2026-2030
Growth momentum & CAGR Accelerate at a CAGR of 7.4%
Market growth 2026-2030 USD 100.9 billion
Market structure Fragmented
YoY growth 2025-2026(%) 7.0%
Key countries China, Japan, India, South Korea, Australia, Indonesia, US, Canada, Mexico, Germany, UK, Spain, France, Italy, The Netherlands, UAE, Saudi Arabia, Turkey, South Africa, Israel, Brazil, Argentina and Chile
Competitive landscape Leading Companies, Market Positioning of Companies, Competitive Strategies, and Industry Risks

Request Free Sample

Research Analyst Overview

  • The air freight market is undergoing a significant transformation, driven by the dual pressures of technological advancement and operational resilience. Boardroom decisions are increasingly centered on strategic investments in sustainable aviation fuel to meet both regulatory mandates and client demand for greener supply chains, even with the associated cost implications.
  • The competitive landscape requires robust air freight revenue management and dynamic pricing models to navigate volatility. Core operations are being redefined through the adoption of digital freight marketplaces, customs brokerage automation, and e-air waybill adoption, which have collectively reduced documentation processing times by over 30%.
  • The integration of smart cargo containers and supply chain visibility platforms offers unprecedented real-time cargo tracking. Efficiency is being pursued across the value chain, from predictive maintenance for aircraft to optimizing air cargo ground handling and cargo handling automation. Service providers are differentiating through specialized offerings like pharmaceutical air freight, temperature-controlled shipping, and handling of goods under dangerous goods regulations.
  • Success now depends on a holistic approach combining freight consolidation services, advanced freight forwarder software, and effective air cargo capacity planning to deliver reliable and efficient logistics.

What are the Key Data Covered in this Air Freight Market Research and Growth Report?

  • What is the expected growth of the Air Freight Market between 2026 and 2030?

    • USD 100.9 billion, at a CAGR of 7.4%

  • What segmentation does the market report cover?

    • The report is segmented by End-user (Commercial, and Private), Type (International, and Domestic), Application (Food and perishable goods, Industrial materials, Equipment and machinery, and Others) and Geography (APAC, North America, Europe, Middle East and Africa, South America)

  • Which regions are analyzed in the report?

    • APAC, North America, Europe, Middle East and Africa and South America

  • What are the key growth drivers and market challenges?

    • Rapid expansion of cross-border e-commerce and digital retail platforms , Geopolitical volatility and network disruption

  • Who are the major players in the Air Freight Market?

    • Aramex PJSC, CEVA Logistics SA, C H Robinson Worldwide Inc., Dachser SE, DB Schenker, DHL International GmbH, DSV AS, Expeditors International Inc., FedEx Corp., GEODIS, KLN Logistics Group Ltd., Kuehne Nagel Management AG, Kintetsu World Express Inc., Logwin AG, AP Moller Maersk AS, Mainfreight Ltd., Nippon Express Holdings Inc., PSA BDP, Toll Holdings Ltd. and United Parcel Service Inc.

Market Research Insights

  • Market dynamics are shaped by a strategic pivot towards data-driven operations and specialized service offerings. The adoption of advanced transportation management systems has improved on-time delivery rates by over 15%, while digital platforms for air cargo market intelligence enable more accurate demand forecasting. Shippers are increasingly using air freight rate benchmarking to optimize logistics cost optimization.
  • This focus on efficiency and visibility is crucial as the industry adapts to fluctuating demand patterns and complex global trade compliance requirements. As a result, firms that leverage integrated logistics services and robust supply chain data analytics are better positioned to manage inventory and meet service level agreements in a competitive environment.

We can help! Our analysts can customize this air freight market research report to meet your requirements.

Get in touch

1. Executive Summary

1.1 Market overview

Executive Summary - Chart on Market Overview
Executive Summary - Data Table on Market Overview
Executive Summary - Chart on Global Market Characteristics
Executive Summary - Chart on Market by Geography
Executive Summary - Chart on Market Segmentation by End-user
Executive Summary - Chart on Market Segmentation by Type
Executive Summary - Chart on Market Segmentation by Application
Executive Summary - Chart on Incremental Growth
Executive Summary - Data Table on Incremental Growth
Executive Summary - Chart on Company Market Positioning

2. Technavio Analysis

2.1 Analysis of price sensitivity, lifecycle, customer purchase basket, adoption rates, and purchase criteria

2.2 Criticality of inputs and Factors of differentiation

Chart on Overview on criticality of inputs and factors of differentiation

2.3 Factors of disruption

Chart on Overview on factors of disruption

2.4 Impact of drivers and challenges

Chart on Impact of drivers and challenges in 2025 and 2030

3. Market Landscape

3.1 Market ecosystem

Chart on Parent Market
Data Table on - Parent Market

3.2 Market characteristics

Chart on Market characteristics analysis

3.3 Value chain analysis

Chart on Value chain analysis

4. Market Sizing

4.1 Market definition

Data Table on Offerings of companies included in the market definition

4.2 Market segment analysis

Market segments

4.3 Market size 2025

4.4 Market outlook: Forecast for 2025-2030

Chart on Global - Market size and forecast 2025-2030 ($ billion)
Data Table on Global - Market size and forecast 2025-2030 ($ billion)
Chart on Global Market: Year-over-year growth 2025-2030 (%)
Data Table on Global Market: Year-over-year growth 2025-2030 (%)

5. Historic Market Size

5.1 Global Air Freight Market 2020 - 2024

Historic Market Size - Data Table on Global Air Freight Market 2020 - 2024 ($ billion)

5.2 End-user segment analysis 2020 - 2024

Historic Market Size - End-user Segment 2020 - 2024 ($ billion)

5.3 Type segment analysis 2020 - 2024

Historic Market Size - Type Segment 2020 - 2024 ($ billion)

5.4 Application segment analysis 2020 - 2024

Historic Market Size - Application Segment 2020 - 2024 ($ billion)

5.5 Geography segment analysis 2020 - 2024

Historic Market Size - Geography Segment 2020 - 2024 ($ billion)

5.6 Country segment analysis 2020 - 2024

Historic Market Size - Country Segment 2020 - 2024 ($ billion)

6. Qualitative Analysis

6.1 Impact of AI on global air freight market

6.2 Impact of geopolitical conflicts on global air freight market

7. Five Forces Analysis

7.1 Five forces summary

Five forces analysis - Comparison between 2025 and 2030

7.2 Bargaining power of buyers

Bargaining power of buyers - Impact of key factors 2025 and 2030

7.3 Bargaining power of suppliers

Bargaining power of suppliers - Impact of key factors in 2025 and 2030

7.4 Threat of new entrants

Threat of new entrants - Impact of key factors in 2025 and 2030

7.5 Threat of substitutes

Threat of substitutes - Impact of key factors in 2025 and 2030

7.6 Threat of rivalry

Threat of rivalry - Impact of key factors in 2025 and 2030

7.7 Market condition

Chart on Market condition - Five forces 2025 and 2030

8. Market Segmentation by End-user

8.1 Market segments

Chart on End-user - Market share 2025-2030 (%)
Data Table on End-user - Market share 2025-2030 (%)

8.2 Comparison by End-user

Chart on Comparison by End-user
Data Table on Comparison by End-user

8.3 Commercial - Market size and forecast 2025-2030

Chart on Commercial - Market size and forecast 2025-2030 ($ billion)
Data Table on Commercial - Market size and forecast 2025-2030 ($ billion)
Chart on Commercial - Year-over-year growth 2025-2030 (%)
Data Table on Commercial - Year-over-year growth 2025-2030 (%)

8.4 Private - Market size and forecast 2025-2030

Chart on Private - Market size and forecast 2025-2030 ($ billion)
Data Table on Private - Market size and forecast 2025-2030 ($ billion)
Chart on Private - Year-over-year growth 2025-2030 (%)
Data Table on Private - Year-over-year growth 2025-2030 (%)

8.5 Market opportunity by End-user

Market opportunity by End-user ($ billion)
Data Table on Market opportunity by End-user ($ billion)

9. Market Segmentation by Type

9.1 Market segments

Chart on Type - Market share 2025-2030 (%)
Data Table on Type - Market share 2025-2030 (%)

9.2 Comparison by Type

Chart on Comparison by Type
Data Table on Comparison by Type

9.3 International - Market size and forecast 2025-2030

Chart on International - Market size and forecast 2025-2030 ($ billion)
Data Table on International - Market size and forecast 2025-2030 ($ billion)
Chart on International - Year-over-year growth 2025-2030 (%)
Data Table on International - Year-over-year growth 2025-2030 (%)

9.4 Domestic - Market size and forecast 2025-2030

Chart on Domestic - Market size and forecast 2025-2030 ($ billion)
Data Table on Domestic - Market size and forecast 2025-2030 ($ billion)
Chart on Domestic - Year-over-year growth 2025-2030 (%)
Data Table on Domestic - Year-over-year growth 2025-2030 (%)

9.5 Market opportunity by Type

Market opportunity by Type ($ billion)
Data Table on Market opportunity by Type ($ billion)

10. Market Segmentation by Application

10.1 Market segments

Chart on Application - Market share 2025-2030 (%)
Data Table on Application - Market share 2025-2030 (%)

10.2 Comparison by Application

Chart on Comparison by Application
Data Table on Comparison by Application

10.3 Food and perishable goods - Market size and forecast 2025-2030

Chart on Food and perishable goods - Market size and forecast 2025-2030 ($ billion)
Data Table on Food and perishable goods - Market size and forecast 2025-2030 ($ billion)
Chart on Food and perishable goods - Year-over-year growth 2025-2030 (%)
Data Table on Food and perishable goods - Year-over-year growth 2025-2030 (%)

10.4 Industrial materials - Market size and forecast 2025-2030

Chart on Industrial materials - Market size and forecast 2025-2030 ($ billion)
Data Table on Industrial materials - Market size and forecast 2025-2030 ($ billion)
Chart on Industrial materials - Year-over-year growth 2025-2030 (%)
Data Table on Industrial materials - Year-over-year growth 2025-2030 (%)

10.5 Equipment and machinery - Market size and forecast 2025-2030

Chart on Equipment and machinery - Market size and forecast 2025-2030 ($ billion)
Data Table on Equipment and machinery - Market size and forecast 2025-2030 ($ billion)
Chart on Equipment and machinery - Year-over-year growth 2025-2030 (%)
Data Table on Equipment and machinery - Year-over-year growth 2025-2030 (%)

10.6 Others - Market size and forecast 2025-2030

Chart on Others - Market size and forecast 2025-2030 ($ billion)
Data Table on Others - Market size and forecast 2025-2030 ($ billion)
Chart on Others - Year-over-year growth 2025-2030 (%)
Data Table on Others - Year-over-year growth 2025-2030 (%)

10.7 Market opportunity by Application

Market opportunity by Application ($ billion)
Data Table on Market opportunity by Application ($ billion)

11. Customer Landscape

11.1 Customer landscape overview

Analysis of price sensitivity, lifecycle, customer purchase basket, adoption rates, and purchase criteria

12. Geographic Landscape

12.1 Geographic segmentation

Chart on Market share by geography 2025-2030 (%)
Data Table on Market share by geography 2025-2030 (%)

12.2 Geographic comparison

Chart on Geographic comparison
Data Table on Geographic comparison

12.3 APAC - Market size and forecast 2025-2030

Chart on APAC - Market size and forecast 2025-2030 ($ billion)
Data Table on APAC - Market size and forecast 2025-2030 ($ billion)
Chart on APAC - Year-over-year growth 2025-2030 (%)
Data Table on APAC - Year-over-year growth 2025-2030 (%)
Chart on Regional Comparison - APAC
Data Table on Regional Comparison - APAC

12.3.1 China - Market size and forecast 2025-2030

Chart on China - Market size and forecast 2025-2030 ($ billion)
Data Table on China - Market size and forecast 2025-2030 ($ billion)
Chart on China - Year-over-year growth 2025-2030 (%)
Data Table on China - Year-over-year growth 2025-2030 (%)

12.3.2 Japan - Market size and forecast 2025-2030

Chart on Japan - Market size and forecast 2025-2030 ($ billion)
Data Table on Japan - Market size and forecast 2025-2030 ($ billion)
Chart on Japan - Year-over-year growth 2025-2030 (%)
Data Table on Japan - Year-over-year growth 2025-2030 (%)

12.3.3 India - Market size and forecast 2025-2030

Chart on India - Market size and forecast 2025-2030 ($ billion)
Data Table on India - Market size and forecast 2025-2030 ($ billion)
Chart on India - Year-over-year growth 2025-2030 (%)
Data Table on India - Year-over-year growth 2025-2030 (%)

12.3.4 South Korea - Market size and forecast 2025-2030

Chart on South Korea - Market size and forecast 2025-2030 ($ billion)
Data Table on South Korea - Market size and forecast 2025-2030 ($ billion)
Chart on South Korea - Year-over-year growth 2025-2030 (%)
Data Table on South Korea - Year-over-year growth 2025-2030 (%)

12.3.5 Australia - Market size and forecast 2025-2030

Chart on Australia - Market size and forecast 2025-2030 ($ billion)
Data Table on Australia - Market size and forecast 2025-2030 ($ billion)
Chart on Australia - Year-over-year growth 2025-2030 (%)
Data Table on Australia - Year-over-year growth 2025-2030 (%)

12.3.6 Indonesia - Market size and forecast 2025-2030

Chart on Indonesia - Market size and forecast 2025-2030 ($ billion)
Data Table on Indonesia - Market size and forecast 2025-2030 ($ billion)
Chart on Indonesia - Year-over-year growth 2025-2030 (%)
Data Table on Indonesia - Year-over-year growth 2025-2030 (%)

12.4 North America - Market size and forecast 2025-2030

Chart on North America - Market size and forecast 2025-2030 ($ billion)
Data Table on North America - Market size and forecast 2025-2030 ($ billion)
Chart on North America - Year-over-year growth 2025-2030 (%)
Data Table on North America - Year-over-year growth 2025-2030 (%)
Chart on Regional Comparison - North America
Data Table on Regional Comparison - North America

12.4.1 US - Market size and forecast 2025-2030

Chart on US - Market size and forecast 2025-2030 ($ billion)
Data Table on US - Market size and forecast 2025-2030 ($ billion)
Chart on US - Year-over-year growth 2025-2030 (%)
Data Table on US - Year-over-year growth 2025-2030 (%)

12.4.2 Canada - Market size and forecast 2025-2030

Chart on Canada - Market size and forecast 2025-2030 ($ billion)
Data Table on Canada - Market size and forecast 2025-2030 ($ billion)
Chart on Canada - Year-over-year growth 2025-2030 (%)
Data Table on Canada - Year-over-year growth 2025-2030 (%)

12.4.3 Mexico - Market size and forecast 2025-2030

Chart on Mexico - Market size and forecast 2025-2030 ($ billion)
Data Table on Mexico - Market size and forecast 2025-2030 ($ billion)
Chart on Mexico - Year-over-year growth 2025-2030 (%)
Data Table on Mexico - Year-over-year growth 2025-2030 (%)

12.5 Europe - Market size and forecast 2025-2030

Chart on Europe - Market size and forecast 2025-2030 ($ billion)
Data Table on Europe - Market size and forecast 2025-2030 ($ billion)
Chart on Europe - Year-over-year growth 2025-2030 (%)
Data Table on Europe - Year-over-year growth 2025-2030 (%)
Chart on Regional Comparison - Europe
Data Table on Regional Comparison - Europe

12.5.1 Germany - Market size and forecast 2025-2030

Chart on Germany - Market size and forecast 2025-2030 ($ billion)
Data Table on Germany - Market size and forecast 2025-2030 ($ billion)
Chart on Germany - Year-over-year growth 2025-2030 (%)
Data Table on Germany - Year-over-year growth 2025-2030 (%)

12.5.2 UK - Market size and forecast 2025-2030

Chart on UK - Market size and forecast 2025-2030 ($ billion)
Data Table on UK - Market size and forecast 2025-2030 ($ billion)
Chart on UK - Year-over-year growth 2025-2030 (%)
Data Table on UK - Year-over-year growth 2025-2030 (%)

12.5.3 Spain - Market size and forecast 2025-2030

Chart on Spain - Market size and forecast 2025-2030 ($ billion)
Data Table on Spain - Market size and forecast 2025-2030 ($ billion)
Chart on Spain - Year-over-year growth 2025-2030 (%)
Data Table on Spain - Year-over-year growth 2025-2030 (%)

12.5.4 France - Market size and forecast 2025-2030

Chart on France - Market size and forecast 2025-2030 ($ billion)
Data Table on France - Market size and forecast 2025-2030 ($ billion)
Chart on France - Year-over-year growth 2025-2030 (%)
Data Table on France - Year-over-year growth 2025-2030 (%)

12.5.5 Italy - Market size and forecast 2025-2030

Chart on Italy - Market size and forecast 2025-2030 ($ billion)
Data Table on Italy - Market size and forecast 2025-2030 ($ billion)
Chart on Italy - Year-over-year growth 2025-2030 (%)
Data Table on Italy - Year-over-year growth 2025-2030 (%)

12.5.6 The Netherlands - Market size and forecast 2025-2030

Chart on The Netherlands - Market size and forecast 2025-2030 ($ billion)
Data Table on The Netherlands - Market size and forecast 2025-2030 ($ billion)
Chart on The Netherlands - Year-over-year growth 2025-2030 (%)
Data Table on The Netherlands - Year-over-year growth 2025-2030 (%)

12.6 Middle East and Africa - Market size and forecast 2025-2030

Chart on Middle East and Africa - Market size and forecast 2025-2030 ($ billion)
Data Table on Middle East and Africa - Market size and forecast 2025-2030 ($ billion)
Chart on Middle East and Africa - Year-over-year growth 2025-2030 (%)
Data Table on Middle East and Africa - Year-over-year growth 2025-2030 (%)
Chart on Regional Comparison - Middle East and Africa
Data Table on Regional Comparison - Middle East and Africa

12.6.1 UAE - Market size and forecast 2025-2030

Chart on UAE - Market size and forecast 2025-2030 ($ billion)
Data Table on UAE - Market size and forecast 2025-2030 ($ billion)
Chart on UAE - Year-over-year growth 2025-2030 (%)
Data Table on UAE - Year-over-year growth 2025-2030 (%)

12.6.2 Saudi Arabia - Market size and forecast 2025-2030

Chart on Saudi Arabia - Market size and forecast 2025-2030 ($ billion)
Data Table on Saudi Arabia - Market size and forecast 2025-2030 ($ billion)
Chart on Saudi Arabia - Year-over-year growth 2025-2030 (%)
Data Table on Saudi Arabia - Year-over-year growth 2025-2030 (%)

12.6.3 Turkey - Market size and forecast 2025-2030

Chart on Turkey - Market size and forecast 2025-2030 ($ billion)
Data Table on Turkey - Market size and forecast 2025-2030 ($ billion)
Chart on Turkey - Year-over-year growth 2025-2030 (%)
Data Table on Turkey - Year-over-year growth 2025-2030 (%)

12.6.4 South Africa - Market size and forecast 2025-2030

Chart on South Africa - Market size and forecast 2025-2030 ($ billion)
Data Table on South Africa - Market size and forecast 2025-2030 ($ billion)
Chart on South Africa - Year-over-year growth 2025-2030 (%)
Data Table on South Africa - Year-over-year growth 2025-2030 (%)

12.6.5 Israel - Market size and forecast 2025-2030

Chart on Israel - Market size and forecast 2025-2030 ($ billion)
Data Table on Israel - Market size and forecast 2025-2030 ($ billion)
Chart on Israel - Year-over-year growth 2025-2030 (%)
Data Table on Israel - Year-over-year growth 2025-2030 (%)

12.7 South America - Market size and forecast 2025-2030

Chart on South America - Market size and forecast 2025-2030 ($ billion)
Data Table on South America - Market size and forecast 2025-2030 ($ billion)
Chart on South America - Year-over-year growth 2025-2030 (%)
Data Table on South America - Year-over-year growth 2025-2030 (%)
Chart on Regional Comparison - South America
Data Table on Regional Comparison - South America

12.7.1 Brazil - Market size and forecast 2025-2030

Chart on Brazil - Market size and forecast 2025-2030 ($ billion)
Data Table on Brazil - Market size and forecast 2025-2030 ($ billion)
Chart on Brazil - Year-over-year growth 2025-2030 (%)
Data Table on Brazil - Year-over-year growth 2025-2030 (%)

12.7.2 Argentina - Market size and forecast 2025-2030

Chart on Argentina - Market size and forecast 2025-2030 ($ billion)
Data Table on Argentina - Market size and forecast 2025-2030 ($ billion)
Chart on Argentina - Year-over-year growth 2025-2030 (%)
Data Table on Argentina - Year-over-year growth 2025-2030 (%)

12.7.3 Chile - Market size and forecast 2025-2030

Chart on Chile - Market size and forecast 2025-2030 ($ billion)
Data Table on Chile - Market size and forecast 2025-2030 ($ billion)
Chart on Chile - Year-over-year growth 2025-2030 (%)
Data Table on Chile - Year-over-year growth 2025-2030 (%)

12.8 Market opportunity by geography

Market opportunity by geography ($ billion)
Data Tables on Market opportunity by geography ($ billion)

13. Drivers, Challenges, and Opportunity

13.1 Market drivers

Rapid expansion of cross-border e-commerce and digital retail platforms
Rising global demand for specialized cold chain and pharmaceutical logistics
Implementation of sustainable aviation initiatives and regulatory compliance

13.2 Market challenges

Geopolitical volatility and network disruption
Severe capacity constraints and supply-side bottlenecks
Rising operational costs and regulatory pressure

13.3 Impact of drivers and challenges

Impact of drivers and challenges in 2025 and 2030

13.4 Market opportunities

Integration of AI and ML in global logistics operations
Expansion of sustainable aviation initiatives and green logistics frameworks
Acceleration of cross-border e-commerce and specialized cargo handling

14. Competitive Landscape

14.1 Overview

14.2

Overview on criticality of inputs and factors of differentiation

14.3 Landscape disruption

Overview on factors of disruption

14.4 Industry risks

Impact of key risks on business

15. Competitive Analysis

15.1 Companies profiled

Companies covered

15.2 Company ranking index

15.3 Market positioning of companies

Matrix on companies position and classification

15.4 CEVA Logistics SA

CEVA Logistics SA - Overview
CEVA Logistics SA - Product / Service
CEVA Logistics SA - Key offerings
SWOT

15.5 C H Robinson Worldwide Inc.

C H Robinson Worldwide Inc. - Overview
C H Robinson Worldwide Inc. - Business segments
C H Robinson Worldwide Inc. - Key offerings
C H Robinson Worldwide Inc. - Segment focus
SWOT

15.6 Dachser SE

Dachser SE - Overview
Dachser SE - Product / Service
Dachser SE - Key offerings
SWOT

15.7 DB Schenker

DB Schenker - Overview
DB Schenker - Product / Service
DB Schenker - Key offerings
SWOT

15.8 DHL International GmbH

DHL International GmbH - Overview
DHL International GmbH - Business segments
DHL International GmbH - Key news
DHL International GmbH - Key offerings
DHL International GmbH - Segment focus
SWOT

15.9 DSV AS

DSV AS - Overview
DSV AS - Business segments
DSV AS - Key offerings
DSV AS - Segment focus
SWOT

15.10 Expeditors International Inc.

Expeditors International Inc. - Overview
Expeditors International Inc. - Business segments
Expeditors International Inc. - Key offerings
Expeditors International Inc. - Segment focus
SWOT

15.11 FedEx Corp.

FedEx Corp. - Overview
FedEx Corp. - Business segments
FedEx Corp. - Key offerings
FedEx Corp. - Segment focus
SWOT

15.12 GEODIS

GEODIS - Overview
GEODIS - Product / Service
GEODIS - Key offerings
SWOT

15.13 KLN Logistics Group Ltd.

KLN Logistics Group Ltd. - Overview
KLN Logistics Group Ltd. - Business segments
KLN Logistics Group Ltd. - Key offerings
KLN Logistics Group Ltd. - Segment focus
SWOT

15.14 Kuehne Nagel Management AG

Kuehne Nagel Management AG - Overview
Kuehne Nagel Management AG - Business segments
Kuehne Nagel Management AG - Key offerings
Kuehne Nagel Management AG - Segment focus
SWOT

15.15 AP Moller Maersk AS

AP Moller Maersk AS - Overview
AP Moller Maersk AS - Business segments
AP Moller Maersk AS - Key offerings
AP Moller Maersk AS - Segment focus
SWOT

15.16 Nippon Express Holdings Inc.

Nippon Express Holdings Inc. - Overview
Nippon Express Holdings Inc. - Business segments
Nippon Express Holdings Inc. - Key offerings
Nippon Express Holdings Inc. - Segment focus
SWOT

15.17 Toll Holdings Ltd.

Toll Holdings Ltd. - Overview
Toll Holdings Ltd. - Product / Service
Toll Holdings Ltd. - Key offerings
SWOT

15.18 United Parcel Service Inc.

United Parcel Service Inc. - Overview
United Parcel Service Inc. - Business segments
United Parcel Service Inc. - Key offerings
United Parcel Service Inc. - Segment focus
SWOT

16. Appendix

16.1 Scope of the report

Market definition
Objectives
Notes and caveats

16.2 Inclusions and exclusions checklist

Inclusions checklist
Exclusions checklist

16.3 Currency conversion rates for US$

16.4 Research methodology

16.5 Data procurement

Information sources

16.6 Data validation

16.7 Validation techniques employed for market sizing

16.8 Data synthesis

16.9 360 degree market analysis

16.10 List of abbreviations

Research Methodology

Technavio presents a detailed picture of the market by way of study, synthesis, and summation of data from multiple sources. The analysts have presented the various facets of the market with a particular focus on identifying the key industry influencers. The data thus presented is comprehensive, reliable, and the result of extensive research, both primary and secondary.

INFORMATION SOURCES

Primary sources

  • Manufacturers and suppliers
  • Channel partners
  • Industry experts
  • Strategic decision makers

Secondary sources

  • Industry journals and periodicals
  • Government data
  • Financial reports of key industry players
  • Historical data
  • Press releases

DATA ANALYSIS

Data Synthesis

  • Collation of data
  • Estimation of key figures
  • Analysis of derived insights

Data Validation

  • Triangulation with data models
  • Reference against proprietary databases
  • Corroboration with industry experts

REPORT WRITING

Qualitative

  • Market drivers
  • Market challenges
  • Market trends
  • Five forces analysis

Quantitative

  • Market size and forecast
  • Market segmentation
  • Geographical insights
  • Competitive landscape

Interested in this report?

Get your sample now to see our research methodology and insights!

Download Now

Frequently Asked Questions

Air Freight market growth will increase by USD 100.9 billion during 2026-2030.

The Air Freight market is expected to grow at a CAGR of 7.4% during 2026-2030.

Air Freight market is segmented by End-user (Commercial, Private) Type (International, Domestic) Application (Food and perishable goods, Industrial materials, Equipment and machinery, Others)

Aramex PJSC, CEVA Logistics SA, C H Robinson Worldwide Inc., Dachser SE, DB Schenker, DHL International GmbH, DSV AS, Expeditors International Inc., FedEx Corp., GEODIS, KLN Logistics Group Ltd., Kuehne Nagel Management AG, Kintetsu World Express Inc., Logwin AG, AP Moller Maersk AS, Mainfreight Ltd., Nippon Express Holdings Inc., PSA BDP, Toll Holdings Ltd., United Parcel Service Inc. are a few of the key vendors in the Air Freight market.

North America will register the highest growth rate of 31.6% among the other regions. Therefore, the Air Freight market in North America is expected to garner significant business opportunities for the vendors during the forecast period.

China, Japan, India, South Korea, Australia, Indonesia, US, Canada, Mexico, Germany, UK, Spain, France, Italy, The Netherlands, UAE, Saudi Arabia, Turkey, South Africa, Israel, Brazil, Argentina, Chile

  • Rapid expansion of cross-border e-commerce and digital retail platforms is the driving factor this market.

The Air Freight market vendors should focus on grabbing business opportunities from the End-user segment as it accounted for the largest market share in the base year.
RIA - Research AI Assistant
Ask RIA