Auto Parts Market Analysis, Size, and Forecast 2026-2030: North America (US, Canada, and Mexico), Europe (Germany, France, and UK), APAC (China, Japan, and India), South America (Brazil and Argentina), Middle East and Africa (South Africa, UAE, and Saudi Arabia), and Rest of World (ROW)

Auto Parts Market Analysis, Size, and Forecast 2026-2030:
North America (US, Canada, and Mexico), Europe (Germany, France, and UK), APAC (China, Japan, and India), South America (Brazil and Argentina), Middle East and Africa (South Africa, UAE, and Saudi Arabia), and Rest of World (ROW)

Published: May 2026 306 Pages SKU: IRTNTR70960

Market Overview at a Glance

$384.7 B
Market Opportunity
3.3%
CAGR 2025 - 2030
33.3%
APAC Growth
$1664.6 B
OEM segment 2024

Auto Parts Market Size 2026-2030

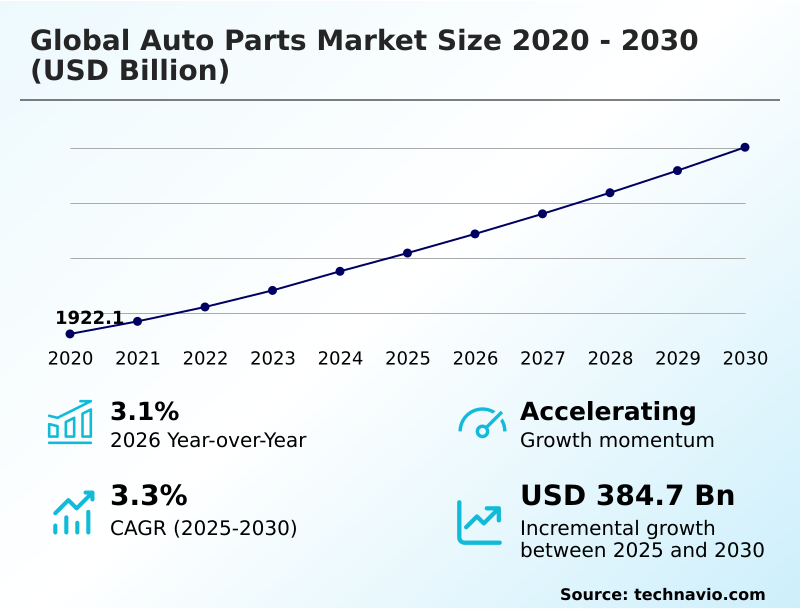
The auto parts market size is valued to increase by USD 384.7 billion, at a CAGR of 3.3% from 2025 to 2030. Electrification and propulsion innovation will drive the auto parts market.

Major Market Trends & Insights

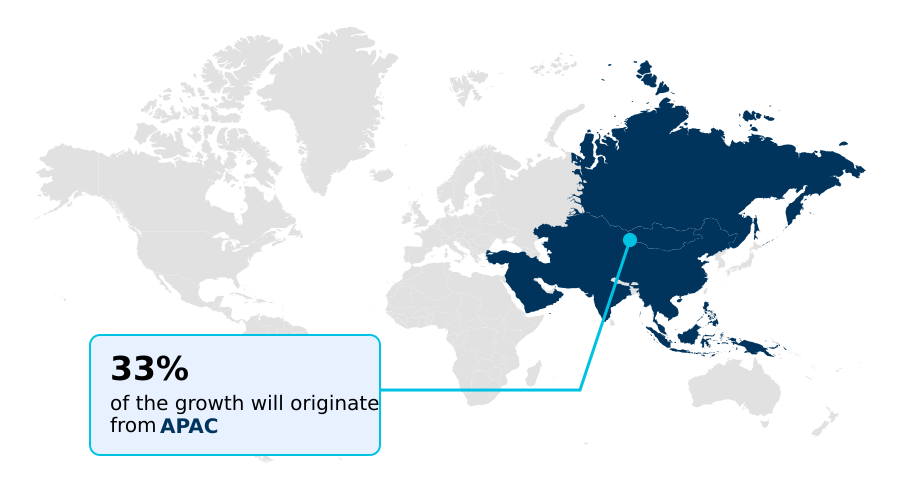
  • APAC dominated the market and accounted for a 33.3% growth during the forecast period.
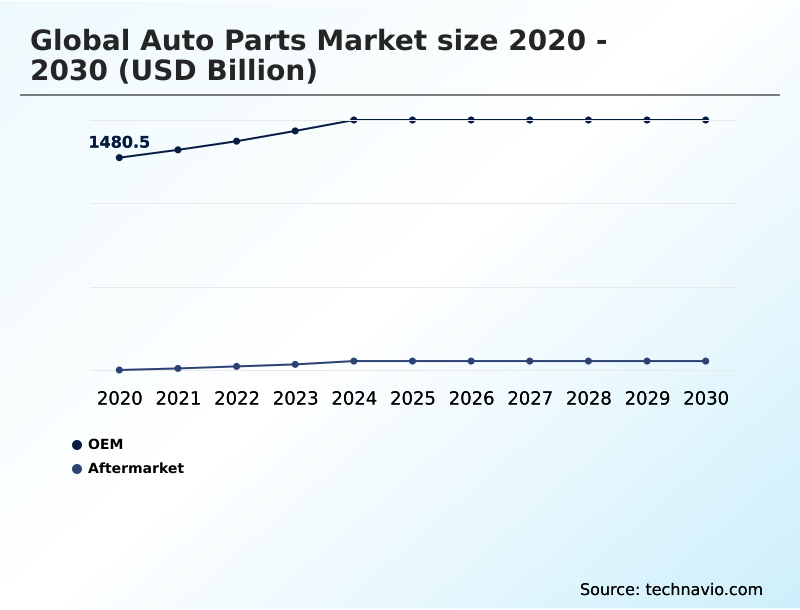
  • By End-user - OEM segment was valued at USD 1664.6 billion in 2024
  • By Distribution Channel - Offline segment accounted for the largest market revenue share in 2024

Market Size & Forecast

  • Market Opportunities: USD 678.8 billion
  • Market Future Opportunities: USD 384.7 billion
  • CAGR from 2025 to 2030 : 3.3%

Market Summary

  • The auto parts market is navigating a period of profound technological change, driven by the dual trends of electrification and digitalization. The shift away from traditional internal combustion engines toward electric propulsion systems is fundamentally altering product portfolios, necessitating expertise in high-voltage battery chemistry, power electronics, and thermal management solutions.
  • Simultaneously, the rise of software-defined vehicle architectures places a new emphasis on high-performance semiconductors, centralized electronic control units, and sophisticated sensor arrays, including high-resolution cameras and radar modules. This transition challenges legacy suppliers to adapt while creating opportunities for innovation in areas like modular vehicle electronics and over-the-air updates.
  • A core business scenario involves manufacturers re-architecting supply chains to balance the production of legacy drivetrain systems with new investments in electric motor and battery management system manufacturing, a complex operational pivot essential for long-term market relevance and competitiveness in an evolving automotive landscape.

What will be the Size of the Auto Parts Market during the forecast period?

Get Key Insights on Market Forecast (PDF) Get Free Sample

How is the Auto Parts Market Segmented?

The auto parts industry research report provides comprehensive data (region-wise segment analysis), with forecasts and estimates in "USD billion" for the period 2026-2030, as well as historical data from 2020-2024 for the following segments.

  • End-user
    • OEM
    • Aftermarket
  • Distribution channel
    • Offline
    • Online
  • Type
    • Electrical and electronics
    • Driveline and powertrain
    • Interior and exterior
    • Body and chassis
    • Others
  • Geography
    • North America
      • US
      • Canada
      • Mexico
    • Europe
      • Germany
      • France
      • UK
    • APAC
      • China
      • Japan
      • India
    • South America
      • Brazil
      • Argentina
    • Middle East and Africa
      • South Africa
      • UAE
      • Saudi Arabia
    • Rest of World (ROW)

By End-user Insights

The oem segment is estimated to witness significant growth during the forecast period.

The OEM segment is undergoing a fundamental transformation, moving from legacy mechanical components to integrated digital systems.

This evolution is driven by the industry's pivot toward software-defined vehicle architectures, where components like drivetrain systems, advanced wiring systems, and braking systems are managed by centralized electronic control units.

Manufacturers are now prioritizing the development of modular vehicle electronics and high-speed data networks to support autonomous driving technologies and connected services. The integration of smart manufacturing, leveraging Industry 4.0 technologies, is critical for producing these complex parts.

For instance, the use of AI-driven digital twin simulations in production has led to a 15% reduction in micro-defects for certain structural components, enhancing both quality and efficiency.

Get Free Sample

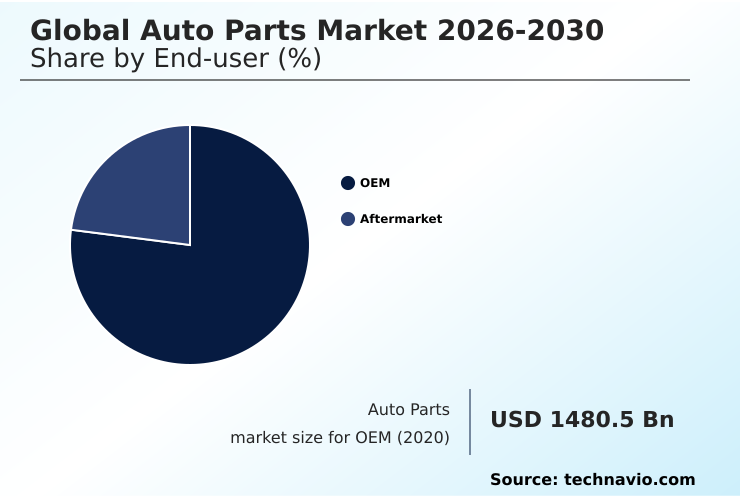
The OEM segment was valued at USD 1664.6 billion in 2024 and showed a gradual increase during the forecast period.

Get Free Sample

Regional Analysis

APAC is estimated to contribute 33.3% to the growth of the global market during the forecast period.Technavio’s analysts have elaborately explained the regional trends and drivers that shape the market during the forecast period.

See How Auto Parts Market Demand is Rising in APAC Get Free Sample

The geographic landscape of the market is diversifying, with distinct regional specializations influencing global supply chains. APAC leads in incremental growth, contributing over 33% of the market's expansion, largely driven by its dominance in lithium-ion battery and semiconductor component manufacturing.

In this region, the development of e-axle systems is a key focus.

Europe, which accounts for nearly 32% of growth opportunities, is concentrating on regulatory-driven innovation, including the production of silicon carbide chips to support its ambitious transition to electric mobility.

North America's strategy centers on reinforcing domestic supply chains and near-shoring, with significant investments in lightweight structural components and zonal architecture to support the production of next-generation electric trucks and SUVs.

This regionalization strategy aims to build resilience against geopolitical and logistical disruptions across the industry.

Market Dynamics

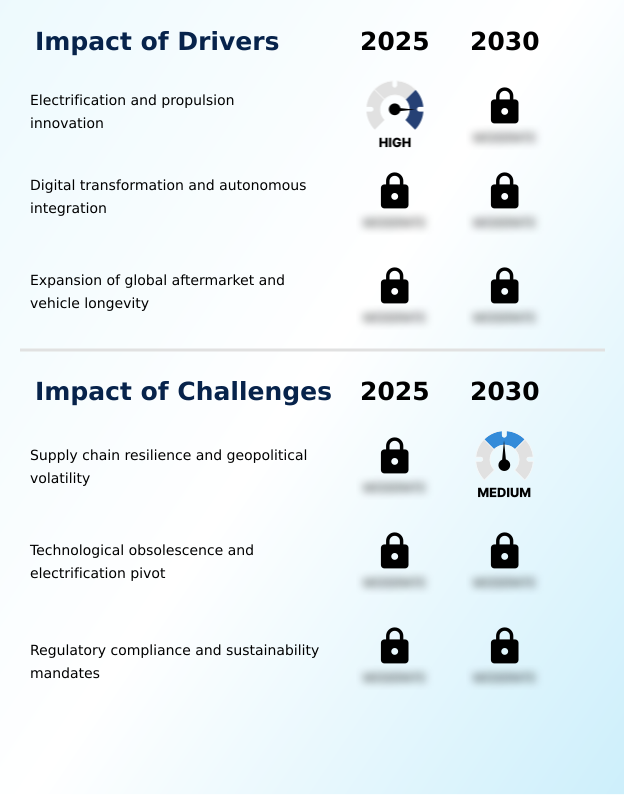
Our researchers analyzed the data with 2025 as the base year, along with the key drivers, trends, and challenges. A holistic analysis of drivers will help companies refine their marketing strategies to gain a competitive advantage.

  • Strategic decision-making in the auto parts sector is increasingly influenced by long-term technological trajectories. The impact of electrification on powertrain components is forcing a complete re-evaluation of legacy manufacturing assets, with a clear pivot toward components for electric and hybrid systems. Simultaneously, the role of ADAS in automotive electronics growth is accelerating demand for high-performance computing and sensor fusion technologies.
  • As this complexity grows, advancements in electric vehicle battery thermal management are becoming critical for ensuring safety and performance, creating a new sub-market for specialized cooling and monitoring systems. Businesses are also exploring the benefits of lightweight materials in chassis design to offset battery weight and improve vehicle efficiency.
  • This is compounded by challenges in automotive semiconductor supply chains, which are pushing companies toward nearshoring strategies for automotive supply chain resilience to ensure production continuity.
  • In the aftermarket, which has seen its share of the market grow by over 5% in some segments, the focus is on digital twin applications in auto parts production and the deployment of advanced diagnostics to service these technologically dense vehicles. Furthermore, the push for sustainability is driving innovation in sustainable materials for automotive interior manufacturing.

What are the key market drivers leading to the rise in the adoption of Auto Parts Industry?

  • The primary market driver is the continuous innovation in vehicle electrification and advanced propulsion systems.

  • Market growth is primarily propelled by the widespread adoption of electrification and advanced driver assistance systems (ADAS). The transition to electric propulsion systems fuels demand for innovative battery management systems, power inverters, and thermal management solutions.
  • Concurrently, the integration of ADAS is becoming standard, requiring a complex array of high-resolution cameras, radar modules, and ultrasonic sensors.
  • This shift has dramatically increased the electronic content in vehicles, with the number of electronic control units rising from fewer than 20 to over 100 in high-end models.
  • The increasing average age of the global vehicle fleet also provides a steady tailwind for the aftermarket, where predictive maintenance analytics and digital diagnostic platforms are becoming essential tools for service.

What are the market trends shaping the Auto Parts Industry?

  • The market is increasingly influenced by the proliferation of software-defined vehicle architectures. This trend is compelling a shift toward centralized computing and modular hardware components.

  • Key trends are reshaping the auto parts market, emphasizing digitalization and sustainability. The proliferation of software-defined vehicle architectures is driving demand for high-speed data networks and modular vehicle electronics, enabling features like over-the-air (OTA) updates.
  • This shift is turning vehicles into upgradable platforms, with one report indicating that 84% of vehicles in a major region are now out of warranty, creating a vast market for advanced aftermarket solutions. Concurrently, smart manufacturing and Industry 4.0 technologies are optimizing production lines.
  • The adoption of circular economy principles is also gaining traction, with some companies successfully commercializing tires made from 65% sustainable materials, highlighting a significant move toward eco-friendly product lifecycles and recycled plastics.

What challenges does the Auto Parts Industry face during its growth?

  • A key challenge facing the market is ensuring supply chain resilience amid persistent geopolitical volatility.

  • The market faces significant challenges related to supply chain stability and rapid technological obsolescence. Geopolitical volatility has exposed the fragility of just-in-time logistics, forcing a strategic shift toward near-shoring supply chains and friend-shoring strategies to secure the availability of critical semiconductor components. This restructuring requires substantial capital investment.
  • Simultaneously, the pivot to electrification is rendering decades of investment in internal combustion engine technology obsolete, requiring a massive re-allocation of resources toward mastering high-voltage battery chemistry and power electronics.
  • The regulatory landscape adds another layer of complexity, as mandates for carbon capture technology and sustainable material sourcing increase compliance costs, often with a cost-to-benefit ratio that varies significantly across jurisdictions.

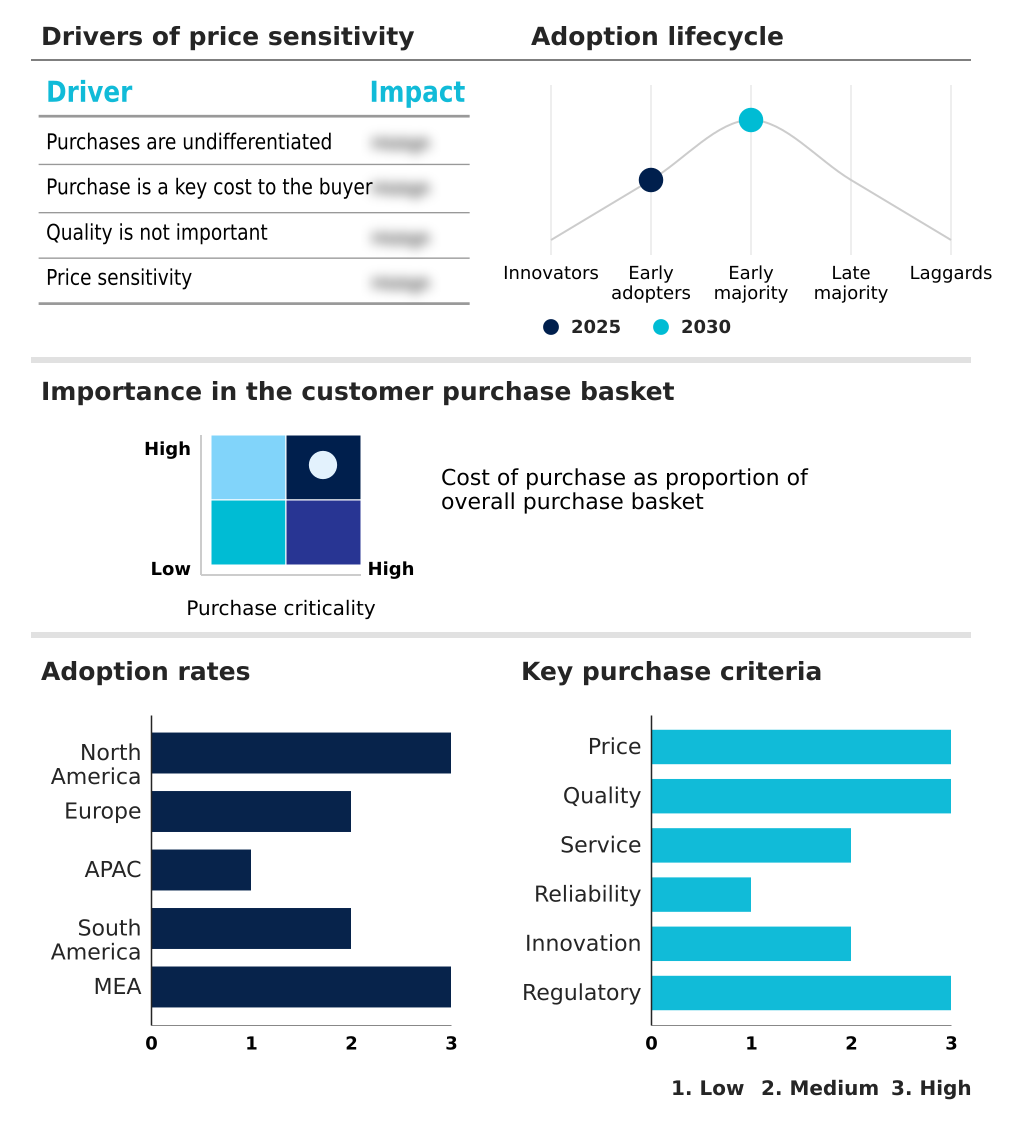
Exclusive Technavio Analysis on Customer Landscape

The auto parts market forecasting report includes the adoption lifecycle of the market, covering from the innovator’s stage to the laggard’s stage. It focuses on adoption rates in different regions based on penetration. Furthermore, the auto parts market report also includes key purchase criteria and drivers of price sensitivity to help companies evaluate and develop their market growth analysis strategies.

Customer Landscape of Auto Parts Industry

Competitive Landscape

Companies are implementing various strategies, such as strategic alliances, auto parts market forecast, partnerships, mergers and acquisitions, geographical expansion, and product/service launches, to enhance their presence in the industry.

AISIN Corp. - Analysis indicates a portfolio centered on advanced drivetrain systems and core automotive components, targeting vehicle performance and efficiency through integrated engineering solutions.

The industry research and growth report includes detailed analyses of the competitive landscape of the market and information about key companies, including:

  • AISIN Corp.
  • Aptiv PLC
  • Autoliv Inc.
  • BorgWarner Inc.
  • Continental AG
  • Dana Inc.
  • DENSO Corp.
  • Forvia SE
  • Gestamp Automocion SA
  • Lear Corp.
  • Magna International Inc.
  • MAHLE GmbH
  • Marelli Holdings Co. Ltd.
  • Robert Bosch GmbH
  • Schaeffler AG
  • Sumitomo Electric Industries
  • Tenneco Inc.
  • Valeo SA
  • Yazaki Corp.
  • ZF Friedrichshafen AG

Qualitative and quantitative analysis of companies has been conducted to help clients understand the wider business environment as well as the strengths and weaknesses of key industry players. Data is qualitatively analyzed to categorize companies as pure play, category-focused, industry-focused, and diversified; it is quantitatively analyzed to categorize companies as dominant, leading, strong, tentative, and weak.

Recent Development and News in Auto parts market

  • In August 2025, Bridgestone Corporation announced the commercialization of a new tire line incorporating 65% sustainable materials, including natural rubber from guayule shrubs and silica derived from rice husk waste.
  • In May 2025, Siemens AG implemented an advanced AI-powered digital twin solution for a tier-one supplier, using real-time sensor data to adjust casting processes and reduce structural micro-defects by 15%.
  • In April 2025, Toyota Motor Corporation initiated a decentralized micro-hub strategy in Southeast Asia to localize the sourcing of semiconductor components and mitigate the impact of global logistics disruptions.
  • In February 2025, Robert Bosch GmbH launched a comprehensive reskilling program in Germany to transition thousands of mechanical engineers into roles focused on electric motor production and software-defined vehicle architecture.

Dive into Technavio’s robust research methodology, blending expert interviews, extensive data synthesis, and validated models for unparalleled Auto Parts Market insights. See full methodology.

Market Scope
Page number 306
Base year 2025
Historic period 2020-2024
Forecast period 2026-2030
Growth momentum & CAGR Accelerate at a CAGR of 3.3%
Market growth 2026-2030 USD 384.7 billion
Market structure Fragmented
YoY growth 2025-2026(%) 3.1%
Key countries US, Canada, Mexico, Germany, France, UK, Italy, The Netherlands, Spain, China, Japan, India, South Korea, Australia, Indonesia, Brazil, Argentina, Chile, South Africa, UAE, Saudi Arabia, Israel and Egypt
Competitive landscape Leading Companies, Market Positioning of Companies, Competitive Strategies, and Industry Risks

Request Free Sample

Research Analyst Overview

  • The auto parts market is in a state of strategic realignment, where portfolio simplification and technological investment are paramount. The industry is moving beyond traditional mechanical components toward integrated systems defined by software and advanced electronics. This pivot requires substantial capital expenditure in new technologies, particularly in electric propulsion systems and autonomous driving technologies, areas where R&D spending is intensifying.
  • Established players are focusing on core competencies like drivetrain systems, advanced wiring systems, braking systems, and automotive tires, while simultaneously building capabilities in next-generation fields such as high-performance semiconductors and battery management systems. The integration of high-resolution cameras, ultrasonic sensors, and radar modules is now standard, reflecting a market where vehicle intelligence is a primary differentiator.
  • For instance, the adoption of advanced digital tools has enabled some manufacturers to improve defect detection by 15%, showcasing how operational efficiency is becoming a key competitive lever in this evolving landscape.

What are the Key Data Covered in this Auto Parts Market Research and Growth Report?

  • What is the expected growth of the Auto Parts Market between 2026 and 2030?

    • USD 384.7 billion, at a CAGR of 3.3%

  • What segmentation does the market report cover?

    • The report is segmented by End-user (OEM, and Aftermarket), Distribution Channel (Offline, and Online), Type (Electrical and electronics, Driveline and powertrain, Interior and exterior, Body and chassis, and Others) and Geography (North America, Europe, APAC, South America, Middle East and Africa)

  • Which regions are analyzed in the report?

    • North America, Europe, APAC, South America and Middle East and Africa

  • What are the key growth drivers and market challenges?

    • Electrification and propulsion innovation, Supply chain resilience and geopolitical volatility

  • Who are the major players in the Auto Parts Market?

    • AISIN Corp., Aptiv PLC, Autoliv Inc., BorgWarner Inc., Continental AG, Dana Inc., DENSO Corp., Forvia SE, Gestamp Automocion SA, Lear Corp., Magna International Inc., MAHLE GmbH, Marelli Holdings Co. Ltd., Robert Bosch GmbH, Schaeffler AG, Sumitomo Electric Industries, Tenneco Inc., Valeo SA, Yazaki Corp. and ZF Friedrichshafen AG

Market Research Insights

  • Market dynamics are increasingly shaped by the convergence of sustainability and technology. The adoption of circular economy principles is evident, with some manufacturers now producing tires from over 65% sustainable materials, a significant shift from previous benchmarks.
  • Concurrently, the aftermarket is supported by a large volume of out-of-warranty vehicles, with one major region reporting that such vehicles constitute 84% of the total fleet. This longevity drives consistent demand for remanufacturing processes and advanced diagnostic platforms.
  • The move toward software-defined vehicle architectures is creating demand for new business models centered on over-the-air (OTA) updates and feature subscriptions, compelling suppliers to integrate advanced driver assistance systems (ADAS) and vehicle-to-everything (V2X) communication capabilities into their core offerings. This strategic pivot ensures relevance in an industry where digital features are becoming as critical as mechanical performance.

We can help! Our analysts can customize this auto parts market research report to meet your requirements.

Get in touch

1. Executive Summary

1.1 Market overview

Executive Summary - Chart on Market Overview
Executive Summary - Data Table on Market Overview
Executive Summary - Chart on Global Market Characteristics
Executive Summary - Chart on Market by Geography
Executive Summary - Chart on Market Segmentation by End-user
Executive Summary - Chart on Market Segmentation by Distribution Channel
Executive Summary - Chart on Market Segmentation by Type
Executive Summary - Chart on Incremental Growth
Executive Summary - Data Table on Incremental Growth
Executive Summary - Chart on Company Market Positioning

2. Technavio Analysis

2.1 Analysis of price sensitivity, lifecycle, customer purchase basket, adoption rates, and purchase criteria

2.2 Criticality of inputs and Factors of differentiation

Chart on Overview on criticality of inputs and factors of differentiation

2.3 Factors of disruption

Chart on Overview on factors of disruption

2.4 Impact of drivers and challenges

Chart on Impact of drivers and challenges in 2025 and 2030

3. Market Landscape

3.1 Market ecosystem

Chart on Parent Market
Data Table on - Parent Market

3.2 Market characteristics

Chart on Market characteristics analysis

3.3 Value chain analysis

Chart on Value chain analysis

4. Market Sizing

4.1 Market definition

Data Table on Offerings of companies included in the market definition

4.2 Market segment analysis

Market segments

4.3 Market size 2025

4.4 Market outlook: Forecast for 2025-2030

Chart on Global - Market size and forecast 2025-2030 ($ billion)
Data Table on Global - Market size and forecast 2025-2030 ($ billion)
Chart on Global Market: Year-over-year growth 2025-2030 (%)
Data Table on Global Market: Year-over-year growth 2025-2030 (%)

5. Historic Market Size

5.1 Global Auto Parts Market 2020 - 2024

Historic Market Size - Data Table on Global Auto Parts Market 2020 - 2024 ($ billion)

5.2 End-user segment analysis 2020 - 2024

Historic Market Size - End-user Segment 2020 - 2024 ($ billion)

5.3 Distribution Channel segment analysis 2020 - 2024

Historic Market Size - Distribution Channel Segment 2020 - 2024 ($ billion)

5.4 Type segment analysis 2020 - 2024

Historic Market Size - Type Segment 2020 - 2024 ($ billion)

5.5 Geography segment analysis 2020 - 2024

Historic Market Size - Geography Segment 2020 - 2024 ($ billion)

5.6 Country segment analysis 2020 - 2024

Historic Market Size - Country Segment 2020 - 2024 ($ billion)

6. Qualitative Analysis

6.1 Impact of AI on Global Auto Parts Market

6.2 Impact of Geopolitical Conflicts on Global Auto Parts Market

7. Five Forces Analysis

7.1 Five forces summary

Five forces analysis - Comparison between 2025 and 2030

7.2 Bargaining power of buyers

Bargaining power of buyers - Impact of key factors 2025 and 2030

7.3 Bargaining power of suppliers

Bargaining power of suppliers - Impact of key factors in 2025 and 2030

7.4 Threat of new entrants

Threat of new entrants - Impact of key factors in 2025 and 2030

7.5 Threat of substitutes

Threat of substitutes - Impact of key factors in 2025 and 2030

7.6 Threat of rivalry

Threat of rivalry - Impact of key factors in 2025 and 2030

7.7 Market condition

Chart on Market condition - Five forces 2025 and 2030

8. Market Segmentation by End-user

8.1 Market segments

Chart on End-user - Market share 2025-2030 (%)
Data Table on End-user - Market share 2025-2030 (%)

8.2 Comparison by End-user

Chart on Comparison by End-user
Data Table on Comparison by End-user

8.3 OEM - Market size and forecast 2025-2030

Chart on OEM - Market size and forecast 2025-2030 ($ billion)
Data Table on OEM - Market size and forecast 2025-2030 ($ billion)
Chart on OEM - Year-over-year growth 2025-2030 (%)
Data Table on OEM - Year-over-year growth 2025-2030 (%)

8.4 Aftermarket - Market size and forecast 2025-2030

Chart on Aftermarket - Market size and forecast 2025-2030 ($ billion)
Data Table on Aftermarket - Market size and forecast 2025-2030 ($ billion)
Chart on Aftermarket - Year-over-year growth 2025-2030 (%)
Data Table on Aftermarket - Year-over-year growth 2025-2030 (%)

8.5 Market opportunity by End-user

Market opportunity by End-user ($ billion)
Data Table on Market opportunity by End-user ($ billion)

9. Market Segmentation by Distribution Channel

9.1 Market segments

Chart on Distribution Channel - Market share 2025-2030 (%)
Data Table on Distribution Channel - Market share 2025-2030 (%)

9.2 Comparison by Distribution Channel

Chart on Comparison by Distribution Channel
Data Table on Comparison by Distribution Channel

9.3 Offline - Market size and forecast 2025-2030

Chart on Offline - Market size and forecast 2025-2030 ($ billion)
Data Table on Offline - Market size and forecast 2025-2030 ($ billion)
Chart on Offline - Year-over-year growth 2025-2030 (%)
Data Table on Offline - Year-over-year growth 2025-2030 (%)

9.4 Online - Market size and forecast 2025-2030

Chart on Online - Market size and forecast 2025-2030 ($ billion)
Data Table on Online - Market size and forecast 2025-2030 ($ billion)
Chart on Online - Year-over-year growth 2025-2030 (%)
Data Table on Online - Year-over-year growth 2025-2030 (%)

9.5 Market opportunity by Distribution Channel

Market opportunity by Distribution Channel ($ billion)
Data Table on Market opportunity by Distribution Channel ($ billion)

10. Market Segmentation by Type

10.1 Market segments

Chart on Type - Market share 2025-2030 (%)
Data Table on Type - Market share 2025-2030 (%)

10.2 Comparison by Type

Chart on Comparison by Type
Data Table on Comparison by Type

10.3 Electrical and electronics - Market size and forecast 2025-2030

Chart on Electrical and electronics - Market size and forecast 2025-2030 ($ billion)
Data Table on Electrical and electronics - Market size and forecast 2025-2030 ($ billion)
Chart on Electrical and electronics - Year-over-year growth 2025-2030 (%)
Data Table on Electrical and electronics - Year-over-year growth 2025-2030 (%)

10.4 Driveline and powertrain - Market size and forecast 2025-2030

Chart on Driveline and powertrain - Market size and forecast 2025-2030 ($ billion)
Data Table on Driveline and powertrain - Market size and forecast 2025-2030 ($ billion)
Chart on Driveline and powertrain - Year-over-year growth 2025-2030 (%)
Data Table on Driveline and powertrain - Year-over-year growth 2025-2030 (%)

10.5 Interior and exterior - Market size and forecast 2025-2030

Chart on Interior and exterior - Market size and forecast 2025-2030 ($ billion)
Data Table on Interior and exterior - Market size and forecast 2025-2030 ($ billion)
Chart on Interior and exterior - Year-over-year growth 2025-2030 (%)
Data Table on Interior and exterior - Year-over-year growth 2025-2030 (%)

10.6 Body and chassis - Market size and forecast 2025-2030

Chart on Body and chassis - Market size and forecast 2025-2030 ($ billion)
Data Table on Body and chassis - Market size and forecast 2025-2030 ($ billion)
Chart on Body and chassis - Year-over-year growth 2025-2030 (%)
Data Table on Body and chassis - Year-over-year growth 2025-2030 (%)

10.7 Others - Market size and forecast 2025-2030

Chart on Others - Market size and forecast 2025-2030 ($ billion)
Data Table on Others - Market size and forecast 2025-2030 ($ billion)
Chart on Others - Year-over-year growth 2025-2030 (%)
Data Table on Others - Year-over-year growth 2025-2030 (%)

10.8 Market opportunity by Type

Market opportunity by Type ($ billion)
Data Table on Market opportunity by Type ($ billion)

11. Customer Landscape

11.1 Customer landscape overview

Analysis of price sensitivity, lifecycle, customer purchase basket, adoption rates, and purchase criteria

12. Geographic Landscape

12.1 Geographic segmentation

Chart on Market share by geography 2025-2030 (%)
Data Table on Market share by geography 2025-2030 (%)

12.2 Geographic comparison

Chart on Geographic comparison
Data Table on Geographic comparison

12.3 North America - Market size and forecast 2025-2030

Chart on North America - Market size and forecast 2025-2030 ($ billion)
Data Table on North America - Market size and forecast 2025-2030 ($ billion)
Chart on North America - Year-over-year growth 2025-2030 (%)
Data Table on North America - Year-over-year growth 2025-2030 (%)
Chart on Regional Comparison - North America
Data Table on Regional Comparison - North America

12.3.1 US - Market size and forecast 2025-2030

Chart on US - Market size and forecast 2025-2030 ($ billion)
Data Table on US - Market size and forecast 2025-2030 ($ billion)
Chart on US - Year-over-year growth 2025-2030 (%)
Data Table on US - Year-over-year growth 2025-2030 (%)

12.3.2 Canada - Market size and forecast 2025-2030

Chart on Canada - Market size and forecast 2025-2030 ($ billion)
Data Table on Canada - Market size and forecast 2025-2030 ($ billion)
Chart on Canada - Year-over-year growth 2025-2030 (%)
Data Table on Canada - Year-over-year growth 2025-2030 (%)

12.3.3 Mexico - Market size and forecast 2025-2030

Chart on Mexico - Market size and forecast 2025-2030 ($ billion)
Data Table on Mexico - Market size and forecast 2025-2030 ($ billion)
Chart on Mexico - Year-over-year growth 2025-2030 (%)
Data Table on Mexico - Year-over-year growth 2025-2030 (%)

12.4 Europe - Market size and forecast 2025-2030

Chart on Europe - Market size and forecast 2025-2030 ($ billion)
Data Table on Europe - Market size and forecast 2025-2030 ($ billion)
Chart on Europe - Year-over-year growth 2025-2030 (%)
Data Table on Europe - Year-over-year growth 2025-2030 (%)
Chart on Regional Comparison - Europe
Data Table on Regional Comparison - Europe

12.4.1 Germany - Market size and forecast 2025-2030

Chart on Germany - Market size and forecast 2025-2030 ($ billion)
Data Table on Germany - Market size and forecast 2025-2030 ($ billion)
Chart on Germany - Year-over-year growth 2025-2030 (%)
Data Table on Germany - Year-over-year growth 2025-2030 (%)

12.4.2 France - Market size and forecast 2025-2030

Chart on France - Market size and forecast 2025-2030 ($ billion)
Data Table on France - Market size and forecast 2025-2030 ($ billion)
Chart on France - Year-over-year growth 2025-2030 (%)
Data Table on France - Year-over-year growth 2025-2030 (%)

12.4.3 UK - Market size and forecast 2025-2030

Chart on UK - Market size and forecast 2025-2030 ($ billion)
Data Table on UK - Market size and forecast 2025-2030 ($ billion)
Chart on UK - Year-over-year growth 2025-2030 (%)
Data Table on UK - Year-over-year growth 2025-2030 (%)

12.4.4 Italy - Market size and forecast 2025-2030

Chart on Italy - Market size and forecast 2025-2030 ($ billion)
Data Table on Italy - Market size and forecast 2025-2030 ($ billion)
Chart on Italy - Year-over-year growth 2025-2030 (%)
Data Table on Italy - Year-over-year growth 2025-2030 (%)

12.4.5 The Netherlands - Market size and forecast 2025-2030

Chart on The Netherlands - Market size and forecast 2025-2030 ($ billion)
Data Table on The Netherlands - Market size and forecast 2025-2030 ($ billion)
Chart on The Netherlands - Year-over-year growth 2025-2030 (%)
Data Table on The Netherlands - Year-over-year growth 2025-2030 (%)

12.4.6 Spain - Market size and forecast 2025-2030

Chart on Spain - Market size and forecast 2025-2030 ($ billion)
Data Table on Spain - Market size and forecast 2025-2030 ($ billion)
Chart on Spain - Year-over-year growth 2025-2030 (%)
Data Table on Spain - Year-over-year growth 2025-2030 (%)

12.5 APAC - Market size and forecast 2025-2030

Chart on APAC - Market size and forecast 2025-2030 ($ billion)
Data Table on APAC - Market size and forecast 2025-2030 ($ billion)
Chart on APAC - Year-over-year growth 2025-2030 (%)
Data Table on APAC - Year-over-year growth 2025-2030 (%)
Chart on Regional Comparison - APAC
Data Table on Regional Comparison - APAC

12.5.1 China - Market size and forecast 2025-2030

Chart on China - Market size and forecast 2025-2030 ($ billion)
Data Table on China - Market size and forecast 2025-2030 ($ billion)
Chart on China - Year-over-year growth 2025-2030 (%)
Data Table on China - Year-over-year growth 2025-2030 (%)

12.5.2 Japan - Market size and forecast 2025-2030

Chart on Japan - Market size and forecast 2025-2030 ($ billion)
Data Table on Japan - Market size and forecast 2025-2030 ($ billion)
Chart on Japan - Year-over-year growth 2025-2030 (%)
Data Table on Japan - Year-over-year growth 2025-2030 (%)

12.5.3 India - Market size and forecast 2025-2030

Chart on India - Market size and forecast 2025-2030 ($ billion)
Data Table on India - Market size and forecast 2025-2030 ($ billion)
Chart on India - Year-over-year growth 2025-2030 (%)
Data Table on India - Year-over-year growth 2025-2030 (%)

12.5.4 South Korea - Market size and forecast 2025-2030

Chart on South Korea - Market size and forecast 2025-2030 ($ billion)
Data Table on South Korea - Market size and forecast 2025-2030 ($ billion)
Chart on South Korea - Year-over-year growth 2025-2030 (%)
Data Table on South Korea - Year-over-year growth 2025-2030 (%)

12.5.5 Australia - Market size and forecast 2025-2030

Chart on Australia - Market size and forecast 2025-2030 ($ billion)
Data Table on Australia - Market size and forecast 2025-2030 ($ billion)
Chart on Australia - Year-over-year growth 2025-2030 (%)
Data Table on Australia - Year-over-year growth 2025-2030 (%)

12.5.6 Indonesia - Market size and forecast 2025-2030

Chart on Indonesia - Market size and forecast 2025-2030 ($ billion)
Data Table on Indonesia - Market size and forecast 2025-2030 ($ billion)
Chart on Indonesia - Year-over-year growth 2025-2030 (%)
Data Table on Indonesia - Year-over-year growth 2025-2030 (%)

12.6 South America - Market size and forecast 2025-2030

Chart on South America - Market size and forecast 2025-2030 ($ billion)
Data Table on South America - Market size and forecast 2025-2030 ($ billion)
Chart on South America - Year-over-year growth 2025-2030 (%)
Data Table on South America - Year-over-year growth 2025-2030 (%)
Chart on Regional Comparison - South America
Data Table on Regional Comparison - South America

12.6.1 Brazil - Market size and forecast 2025-2030

Chart on Brazil - Market size and forecast 2025-2030 ($ billion)
Data Table on Brazil - Market size and forecast 2025-2030 ($ billion)
Chart on Brazil - Year-over-year growth 2025-2030 (%)
Data Table on Brazil - Year-over-year growth 2025-2030 (%)

12.6.2 Argentina - Market size and forecast 2025-2030

Chart on Argentina - Market size and forecast 2025-2030 ($ billion)
Data Table on Argentina - Market size and forecast 2025-2030 ($ billion)
Chart on Argentina - Year-over-year growth 2025-2030 (%)
Data Table on Argentina - Year-over-year growth 2025-2030 (%)

12.6.3 Chile - Market size and forecast 2025-2030

Chart on Chile - Market size and forecast 2025-2030 ($ billion)
Data Table on Chile - Market size and forecast 2025-2030 ($ billion)
Chart on Chile - Year-over-year growth 2025-2030 (%)
Data Table on Chile - Year-over-year growth 2025-2030 (%)

12.7 Middle East and Africa - Market size and forecast 2025-2030

Chart on Middle East and Africa - Market size and forecast 2025-2030 ($ billion)
Data Table on Middle East and Africa - Market size and forecast 2025-2030 ($ billion)
Chart on Middle East and Africa - Year-over-year growth 2025-2030 (%)
Data Table on Middle East and Africa - Year-over-year growth 2025-2030 (%)
Chart on Regional Comparison - Middle East and Africa
Data Table on Regional Comparison - Middle East and Africa

12.7.1 South Africa - Market size and forecast 2025-2030

Chart on South Africa - Market size and forecast 2025-2030 ($ billion)
Data Table on South Africa - Market size and forecast 2025-2030 ($ billion)
Chart on South Africa - Year-over-year growth 2025-2030 (%)
Data Table on South Africa - Year-over-year growth 2025-2030 (%)

12.7.2 UAE - Market size and forecast 2025-2030

Chart on UAE - Market size and forecast 2025-2030 ($ billion)
Data Table on UAE - Market size and forecast 2025-2030 ($ billion)
Chart on UAE - Year-over-year growth 2025-2030 (%)
Data Table on UAE - Year-over-year growth 2025-2030 (%)

12.7.3 Saudi Arabia - Market size and forecast 2025-2030

Chart on Saudi Arabia - Market size and forecast 2025-2030 ($ billion)
Data Table on Saudi Arabia - Market size and forecast 2025-2030 ($ billion)
Chart on Saudi Arabia - Year-over-year growth 2025-2030 (%)
Data Table on Saudi Arabia - Year-over-year growth 2025-2030 (%)

12.7.4 Israel - Market size and forecast 2025-2030

Chart on Israel - Market size and forecast 2025-2030 ($ billion)
Data Table on Israel - Market size and forecast 2025-2030 ($ billion)
Chart on Israel - Year-over-year growth 2025-2030 (%)
Data Table on Israel - Year-over-year growth 2025-2030 (%)

12.7.5 Egypt - Market size and forecast 2025-2030

Chart on Egypt - Market size and forecast 2025-2030 ($ billion)
Data Table on Egypt - Market size and forecast 2025-2030 ($ billion)
Chart on Egypt - Year-over-year growth 2025-2030 (%)
Data Table on Egypt - Year-over-year growth 2025-2030 (%)

12.8 Market opportunity by geography

Market opportunity by geography ($ billion)
Data Tables on Market opportunity by geography ($ billion)

13. Drivers, Challenges, and Opportunity

13.1 Market drivers

Electrification and propulsion innovation
Digital transformation and autonomous integration
Expansion of global aftermarket and vehicle longevity

13.2 Market challenges

Supply chain resilience and geopolitical volatility
Technological obsolescence and electrification pivot
Regulatory compliance and sustainability mandates

13.3 Impact of drivers and challenges

Impact of drivers and challenges in 2025 and 2030

13.4 Market opportunities

Proliferation of software-defined vehicle architectures
Integration of sustainable and circular material solutions
Smart manufacturing and AI in parts production

14. Competitive Landscape

14.1 Overview

14.2

Overview on criticality of inputs and factors of differentiation

14.3 Landscape disruption

Overview on factors of disruption

14.4 Industry risks

Impact of key risks on business

15. Competitive Analysis

15.1 Companies profiled

Companies covered

15.2 Company ranking index

15.3 Market positioning of companies

Matrix on companies position and classification

15.4 AISIN Corp.

AISIN Corp. - Overview
AISIN Corp. - Business segments
AISIN Corp. - Key offerings
AISIN Corp. - Segment focus
SWOT

15.5 Aptiv PLC

Aptiv PLC - Overview
Aptiv PLC - Business segments
Aptiv PLC - Key news
Aptiv PLC - Key offerings
Aptiv PLC - Segment focus
SWOT

15.6 Autoliv Inc.

Autoliv Inc. - Overview
Autoliv Inc. - Product / Service
Autoliv Inc. - Key offerings
SWOT

15.7 BorgWarner Inc.

BorgWarner Inc. - Overview
BorgWarner Inc. - Business segments
BorgWarner Inc. - Key offerings
BorgWarner Inc. - Segment focus
SWOT

15.8 Continental AG

Continental AG - Overview
Continental AG - Business segments
Continental AG - Key offerings
Continental AG - Segment focus
SWOT

15.9 Dana Inc.

Dana Inc. - Overview
Dana Inc. - Business segments
Dana Inc. - Key news
Dana Inc. - Key offerings
Dana Inc. - Segment focus
SWOT

15.10 DENSO Corp.

DENSO Corp. - Overview
DENSO Corp. - Business segments
DENSO Corp. - Key offerings
DENSO Corp. - Segment focus
SWOT

15.11 Forvia SE

Forvia SE - Overview
Forvia SE - Business segments
Forvia SE - Key offerings
Forvia SE - Segment focus
SWOT

15.12 Lear Corp.

Lear Corp. - Overview
Lear Corp. - Business segments
Lear Corp. - Key offerings
Lear Corp. - Segment focus
SWOT

15.13 Magna International Inc.

Magna International Inc. - Overview
Magna International Inc. - Business segments
Magna International Inc. - Key news
Magna International Inc. - Key offerings
Magna International Inc. - Segment focus
SWOT

15.14 MAHLE GmbH

MAHLE GmbH - Overview
MAHLE GmbH - Product / Service
MAHLE GmbH - Key offerings
SWOT

15.15 Robert Bosch GmbH

Robert Bosch GmbH - Overview
Robert Bosch GmbH - Product / Service
Robert Bosch GmbH - Key offerings
SWOT

15.16 Schaeffler AG

Schaeffler AG - Overview
Schaeffler AG - Business segments
Schaeffler AG - Key offerings
Schaeffler AG - Segment focus
SWOT

15.17 Valeo SA

Valeo SA - Overview
Valeo SA - Business segments
Valeo SA - Key offerings
Valeo SA - Segment focus
SWOT

15.18 ZF Friedrichshafen AG

ZF Friedrichshafen AG - Overview
ZF Friedrichshafen AG - Product / Service
ZF Friedrichshafen AG - Key offerings
SWOT

16. Appendix

16.1 Scope of the report

Market definition
Objectives
Notes and caveats

16.2 Inclusions and exclusions checklist

Inclusions checklist
Exclusions checklist

16.3 Currency conversion rates for US$

16.4 Research methodology

16.5 Data procurement

Information sources

16.6 Data validation

16.7 Validation techniques employed for market sizing

16.8 Data synthesis

16.9 360 degree market analysis

16.10 List of abbreviations

Research Methodology

Technavio presents a detailed picture of the market by way of study, synthesis, and summation of data from multiple sources. The analysts have presented the various facets of the market with a particular focus on identifying the key industry influencers. The data thus presented is comprehensive, reliable, and the result of extensive research, both primary and secondary.

INFORMATION SOURCES

Primary sources

  • Manufacturers and suppliers
  • Channel partners
  • Industry experts
  • Strategic decision makers

Secondary sources

  • Industry journals and periodicals
  • Government data
  • Financial reports of key industry players
  • Historical data
  • Press releases

DATA ANALYSIS

Data Synthesis

  • Collation of data
  • Estimation of key figures
  • Analysis of derived insights

Data Validation

  • Triangulation with data models
  • Reference against proprietary databases
  • Corroboration with industry experts

REPORT WRITING

Qualitative

  • Market drivers
  • Market challenges
  • Market trends
  • Five forces analysis

Quantitative

  • Market size and forecast
  • Market segmentation
  • Geographical insights
  • Competitive landscape

Interested in this report?

Get your sample now to see our research methodology and insights!

Download Now

Frequently Asked Questions

Auto Parts market growth will increase by USD 384.7 billion during 2026-2030.

The Auto Parts market is expected to grow at a CAGR of 3.3% during 2026-2030.

Auto Parts market is segmented by End-user (OEM, Aftermarket) Distribution channel (Offline, Online) Type (Electrical and electronics, Driveline and powertrain, Interior and exterior, Body and chassis, Others)

AISIN Corp., Aptiv PLC, Autoliv Inc., BorgWarner Inc., Continental AG, Dana Inc., DENSO Corp., Forvia SE, Gestamp Automocion SA, Lear Corp., Magna International Inc., MAHLE GmbH, Marelli Holdings Co. Ltd., Robert Bosch GmbH, Schaeffler AG, Sumitomo Electric Industries, Tenneco Inc., Valeo SA, Yazaki Corp., ZF Friedrichshafen AG are a few of the key vendors in the Auto Parts market.

APAC will register the highest growth rate of 33.3% among the other regions. Therefore, the Auto Parts market in APAC is expected to garner significant business opportunities for the vendors during the forecast period.

US, Canada, Mexico, Germany, France, UK, Italy, The Netherlands, Spain, China, Japan, India, South Korea, Australia, Indonesia, Brazil, Argentina, Chile, South Africa, UAE, Saudi Arabia, Israel, Egypt

  • Electrification and propulsion innovation is the driving factor this market.

The Auto Parts market vendors should focus on grabbing business opportunities from the End-user segment as it accounted for the largest market share in the base year.
RIA - Research AI Assistant
Ask RIA