Airport IT Spending Market Analysis, Size, and Forecast 2026-2030: APAC (China, Japan, and India), North America (US, Canada, and Mexico), Europe (Germany, UK, and France), Middle East and Africa (Saudi Arabia, UAE, and South Africa), South America (Brazil, Argentina, and Colombia), and Rest of World (ROW)

Airport IT Spending Market Analysis, Size, and Forecast 2026-2030:
APAC (China, Japan, and India), North America (US, Canada, and Mexico), Europe (Germany, UK, and France), Middle East and Africa (Saudi Arabia, UAE, and South Africa), South America (Brazil, Argentina, and Colombia), and Rest of World (ROW)

Published: Mar 2026 308 Pages SKU: IRTNTR73044

Market Overview at a Glance

$2.22 B
Market Opportunity
5.9%
CAGR 2025 - 2030
36.5%
APAC Growth
$3.01 B
Operational system segment 2024

Airport IT Spending Market Size 2026-2030
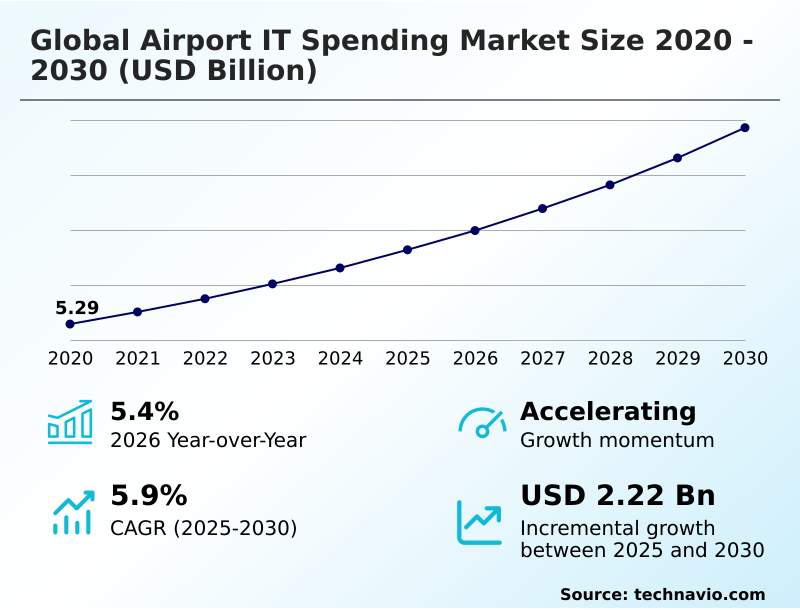
The airport it spending market size is valued to increase by USD 2.22 billion, at a CAGR of 5.9% from 2025 to 2030. Efforts by airports to enhance customer experience will drive the airport it spending market.

Major Market Trends & Insights

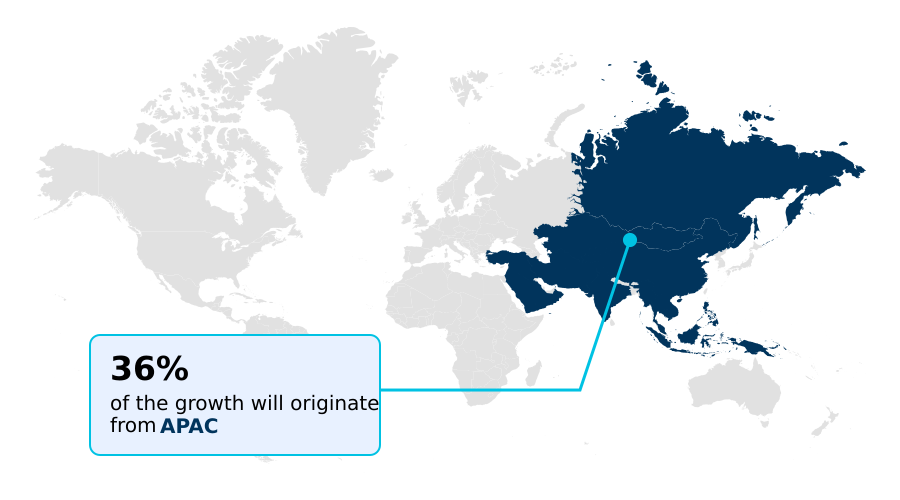
  • APAC dominated the market and accounted for a 36.5% growth during the forecast period.
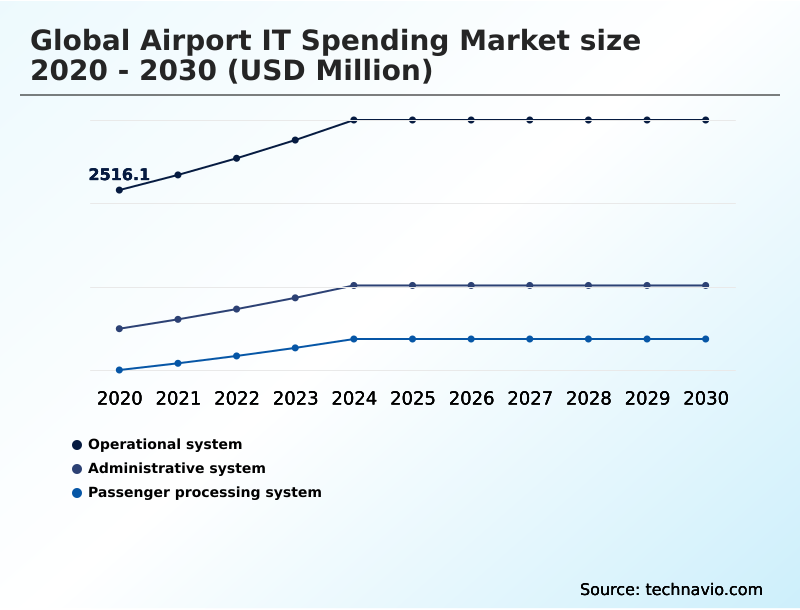
  • By End-user - Operational system segment was valued at USD 3.01 billion in 2024
  • By Component - Hardware segment accounted for the largest market revenue share in 2024

Market Size & Forecast

  • Market Opportunities: USD 3.57 billion
  • Market Future Opportunities: USD 2.22 billion
  • CAGR from 2025 to 2030 : 5.9%

Market Summary

  • The airport IT spending market is defined by a strategic shift from basic operational support to a digitally-driven ecosystem focused on efficiency, security, and passenger experience. Investments are increasingly directed toward technologies that create a seamless and personalized journey.
  • This includes the deployment of biometric passenger processing at every touchpoint, from check-in to boarding, supported by robust airport operational databases that provide a single source of truth. A key business scenario involves using digital twin technologies to simulate passenger flow, allowing operators to preemptively address bottlenecks and optimize resource allocation without disrupting live operations.
  • The integration of real-time wayfinding applications and augmented reality navigation system further enhances passenger autonomy. Concurrently, the rising threat landscape mandates a focus on advanced airport cybersecurity frameworks and AI-driven threat detection, moving beyond traditional defenses to protect interconnected systems like air traffic management and baggage handling systems.
  • This transformation turns IT from a cost center into a strategic enabler of revenue and resilience.

What will be the Size of the Airport IT Spending Market during the forecast period?

Get Key Insights on Market Forecast (PDF) Request Free Sample

How is the Airport IT Spending Market Segmented?

The airport it spending industry research report provides comprehensive data (region-wise segment analysis), with forecasts and estimates in "USD million" for the period 2026-2030, as well as historical data from 2020-2024 for the following segments.

  • End-user
    • Operational system
    • Administrative system
    • Passenger processing system
  • Component
    • Hardware
    • Software
    • Services
  • Application
    • Security
    • Finance and operations
    • Maintenance
    • Others
  • Geography
    • APAC
      • China
      • Japan
      • India
    • North America
      • US
      • Canada
      • Mexico
    • Europe
      • Germany
      • UK
      • France
    • Middle East and Africa
      • Saudi Arabia
      • UAE
      • South Africa
    • South America
      • Brazil
      • Argentina
      • Colombia
    • Rest of World (ROW)

By End-user Insights

The operational system segment is estimated to witness significant growth during the forecast period.

The operational system segment is the technical backbone of airport activities, encompassing essential technologies that ensure airfield safety and efficiency. Investment in this area is driven by the need for scalable software to manage high air traffic volumes.

Core solutions include air traffic management platforms, airport operational databases for real-time data integration, and systems supporting autonomous ground support equipment. To secure these interconnected systems, airports are adopting zero-trust network models and airport cybersecurity frameworks.

Modernization efforts focus on leveraging quantum-computing algorithms for digital air traffic management, which has demonstrated the potential to reduce aircraft fuel consumption by up to 12%.

The integration of facial recognition security and quantum-resistant encryption is also becoming critical to protecting these mission-critical operational assets.

Request Free Sample

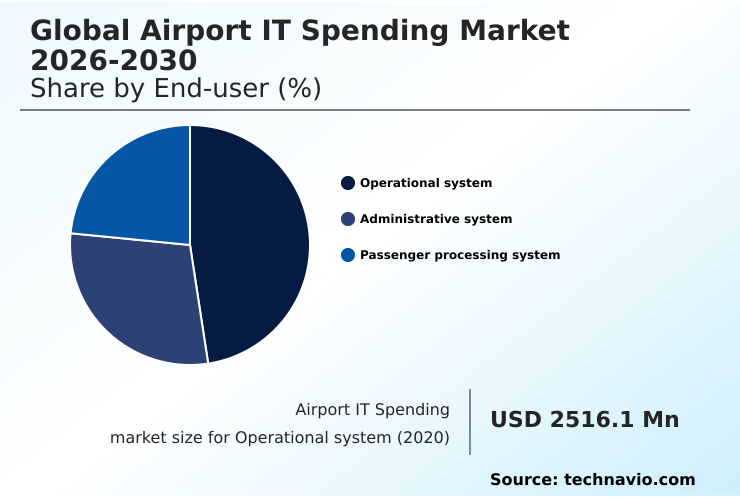
The Operational system segment was valued at USD 3.01 billion in 2024 and showed a gradual increase during the forecast period.

Request Free Sample

Regional Analysis

APAC is estimated to contribute 36.5% to the growth of the global market during the forecast period.Technavio’s analysts have elaborately explained the regional trends and drivers that shape the market during the forecast period.

See How Airport IT Spending Market Demand is Rising in APAC Request Free Sample

Regional dynamics significantly influence IT spending, with APAC leading due to greenfield projects and North America focusing on modernizing aging infrastructure.

In APAC, the focus is on scalable cloud-native software suite and mobile check-in solutions to manage massive passenger growth, with some hubs achieving a 30% reduction in processing times through touchless processing technologies.

In contrast, North American airports prioritize upgrading core systems with predictive maintenance systems and advanced screening equipment to enhance security and operational resilience.

The global trend toward smart airport infrastructure sees varied implementations, from automated immigration gates in the Middle East to advanced intermodal connectivity systems in Europe.

This regional differentiation highlights how airside operations optimization and real-time data monitoring are adapted to local priorities.

Market Dynamics

Our researchers analyzed the data with 2025 as the base year, along with the key drivers, trends, and challenges. A holistic analysis of drivers will help companies refine their marketing strategies to gain a competitive advantage.

  • Strategic decisions in the global airport IT spending market are increasingly focused on tangible outcomes, moving beyond simple technology adoption to measuring performance and ROI. For instance, improving airport non-aeronautical revenue is a key goal, addressed through systems that offer real-time analytics on passenger behavior.
  • The cybersecurity for air traffic control systems remains a non-negotiable priority, with airports evaluating the benefits of integrated airport IT systems to create a unified defense posture and reduce operational technology risks.
  • When comparing airport passenger processing systems, decision-makers now weigh efficiency gains against the total cost of airport IT infrastructure upgrades and the complexities of integrating legacy systems in airports. The benefits of cloud-based airport CRM are evident in enhanced passenger engagement, but this is balanced against the need for robust best practices for airport data governance.
  • The impact of biometrics on airport security is significant, enabling implementing contactless passenger journeys. Meanwhile, the use of AI for predictive airport maintenance and airport resource allocation software benefits are becoming central to business cases, with smart airport technology return on investment measured in both cost savings and operational resilience.
  • The security of airport mobile applications and the ability to optimize ground handling with software are also critical considerations. These detailed evaluations highlight the challenges in airport IT system integration while pursuing airport IT for sustainable aviation practices, where investments in new platforms often yield more than double the efficiency of legacy setups.
  • The ultimate objective is a secure, efficient, and profitable airport ecosystem, where technology choices like airport digital twin implementation costs are justified by long-term value.

What are the key market drivers leading to the rise in the adoption of Airport IT Spending Industry?

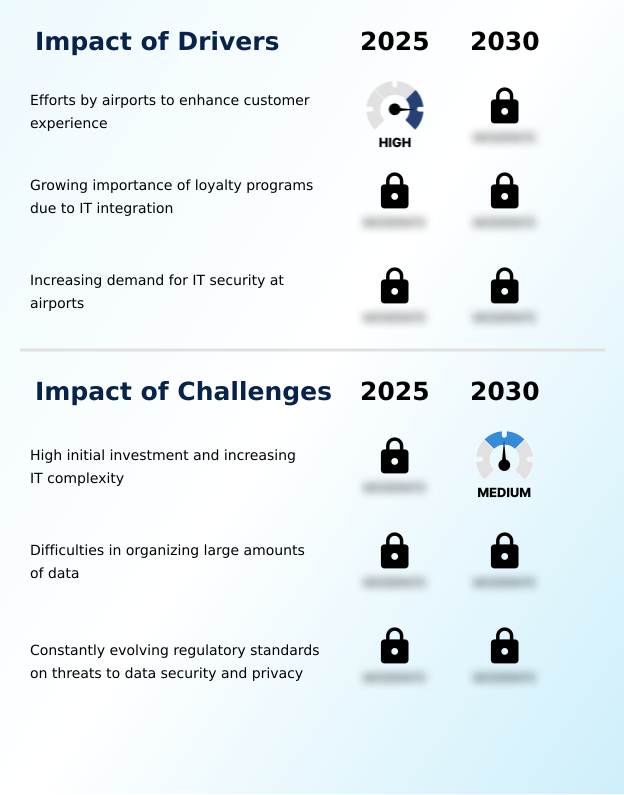
  • Efforts by airports to enhance the customer experience by delivering convenience, comfort, and efficiency are a fundamental driver for the market.

  • Efforts to elevate the customer experience are a primary driver, compelling investment in real-time wayfinding applications and innovative tools like augmented reality navigation system.
  • A seamless journey is supported by an efficient passenger processing system, integrated flight information display systems, and robust backend platforms. Airports are also leveraging IT system integration services for airport collaborative decision-making, which enhances operational synchronicity.
  • The push for direct passenger engagement fuels the adoption of loyalty programs built on high-performance data platforms and even blockchain-based ledger system for secure transactions.
  • These initiatives rely on sophisticated passenger flow analytics and secure biometric authentication systems to create personalized, frictionless travel environments, directly linking IT spend to improved service and revenue.

What are the market trends shaping the Airport IT Spending Industry?

  • The focus on establishing high-end cybersecurity at airports is an emergent trend. This is driven by the need to protect interconnected digital ecosystems from sophisticated threats.

  • A key trend is the elevation of cybersecurity, which drives spending on AI-driven threat detection and advanced platforms to protect expanding digital perimeters. Airports are adopting software-as-a-service models for scalability, moving away from rigid legacy systems. This shift supports the integration of sophisticated biometric passenger processing and automated security scanners, enhancing both security and efficiency.
  • The growing demand for cloud-based CRM and passenger journey personalization is also shaping investment, with airports using tools like airport retail analytics to boost non-aeronautical revenue. Infrastructure upgrades, including the deployment of private 5G networks and LiDAR deployment for spatial intelligence, enable digital identity management and support the creation of smart building technologies, reflecting a holistic approach to airport modernization.

What challenges does the Airport IT Spending Industry face during its growth?

  • The high initial investment required for deployment, combined with increasing IT system complexity, presents a key challenge to market growth.

  • A significant challenge is the high upfront cost and complexity of modernizing legacy systems, including core enterprise resource planning software and backend server architecture. Integrating new solutions with existing infrastructure, such as older baggage handling systems, creates significant hurdles. The push for baggage handling automation and common-use passenger processing standards requires intricate system overhauls.
  • Organizing vast data streams from sources like IoT-enabled infrastructure sensors for use in resource optimization software is a persistent difficulty. Furthermore, the implementation of advanced technologies like digital tower solutions and automated customs processing across diverse environments with fragmented data governance frameworks limits the pace of adoption, especially for smaller airports with limited capital and specialized expertise.

Exclusive Technavio Analysis on Customer Landscape

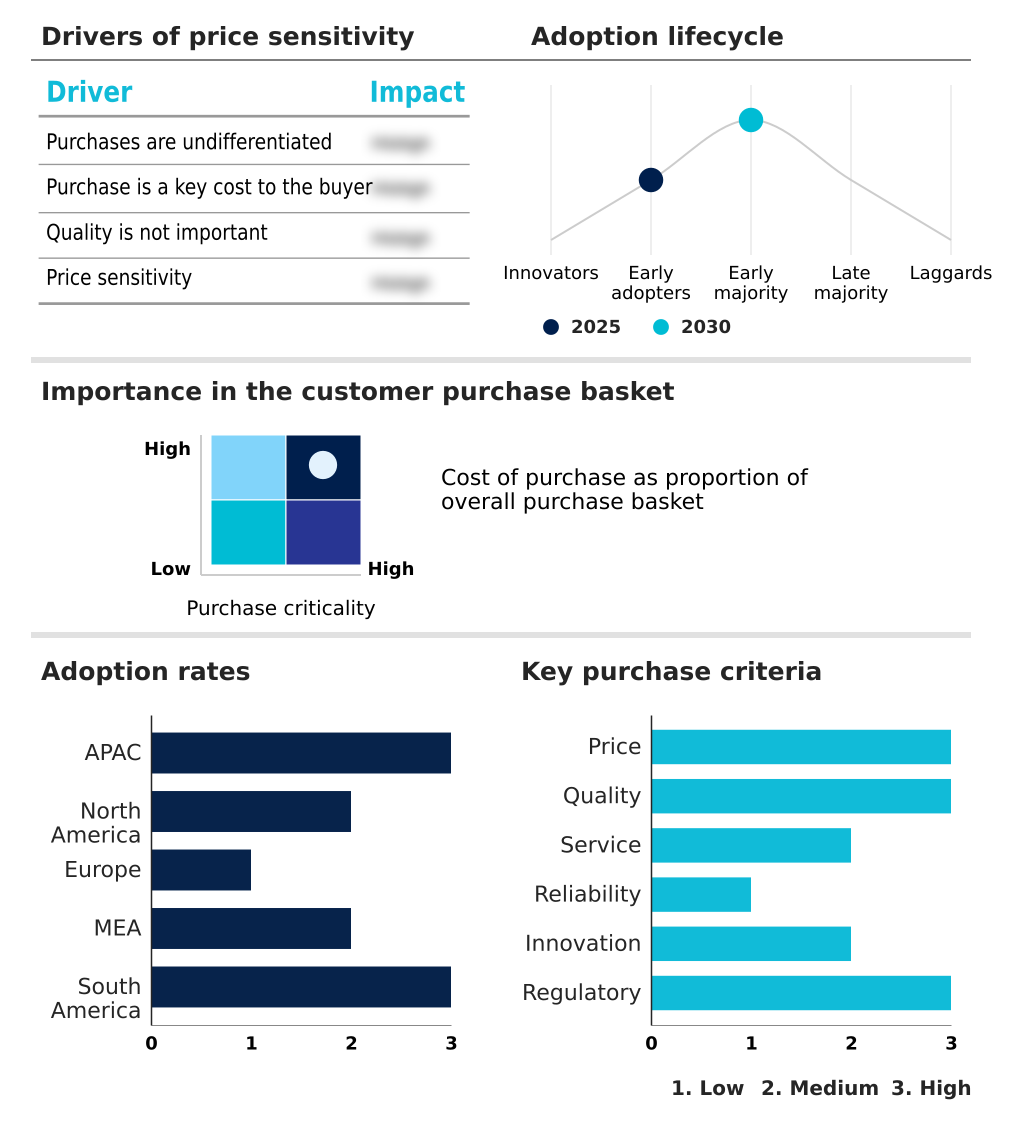
The airport it spending market forecasting report includes the adoption lifecycle of the market, covering from the innovator’s stage to the laggard’s stage. It focuses on adoption rates in different regions based on penetration. Furthermore, the airport it spending market report also includes key purchase criteria and drivers of price sensitivity to help companies evaluate and develop their market growth analysis strategies.

Customer Landscape of Airport IT Spending Industry

Competitive Landscape

Companies are implementing various strategies, such as strategic alliances, airport it spending market forecast, partnerships, mergers and acquisitions, geographical expansion, and product/service launches, to enhance their presence in the industry.

Amadeus IT Group SA - Key offerings include integrated passenger service systems, airport operational databases, and biometric processing solutions, enabling comprehensive airport management and an enhanced traveler journey.

The industry research and growth report includes detailed analyses of the competitive landscape of the market and information about key companies, including:

  • Amadeus IT Group SA
  • Atos SE
  • Capgemini SE
  • China TravelSky Holding Co Ltd
  • Cobham Ltd.
  • Damarel Systems International
  • IBM Corp.
  • INFORM GmbH
  • InterSystems Corp.
  • Lockheed Martin Corp.
  • NEC Corp.
  • Northrop Grumman Corp.
  • RESA SAS
  • RTX Corp.
  • Saab AB
  • Siemens AG
  • SITA
  • Thales Group
  • VELATIA S.L

Qualitative and quantitative analysis of companies has been conducted to help clients understand the wider business environment as well as the strengths and weaknesses of key industry players. Data is qualitatively analyzed to categorize companies as pure play, category-focused, industry-focused, and diversified; it is quantitatively analyzed to categorize companies as dominant, leading, strong, tentative, and weak.

Recent Development and News in Airport it spending market

  • In July 2024, Abu Dhabi Airports partnered with ICP and Next 50 to launch a biometric Smart Travel project at Zayed International Airport, enabling seamless passenger authentication without prior registration.
  • In April 2025, the Digital Twin Consortium released a white paper outlining the potential of digital twin technologies to transform aerospace and defense operations, proposing a roadmap to improve interoperability and security.
  • In April 2025, SITA and NEC Corp. implemented a cross-border biometric authentication framework allowing passengers to navigate security checkpoints using only facial recognition.
  • In November 2025, IBM Corp. and Amadeus IT Group SA collaborated to launch a generative artificial intelligence tool to optimize real-time gate assignments and ground crew scheduling.

Dive into Technavio’s robust research methodology, blending expert interviews, extensive data synthesis, and validated models for unparalleled Airport IT Spending Market insights. See full methodology.

Market Scope
Page number 308
Base year 2025
Historic period 2020-2024
Forecast period 2026-2030
Growth momentum & CAGR Accelerate at a CAGR of 5.9%
Market growth 2026-2030 USD 2219.1 million
Market structure Fragmented
YoY growth 2025-2026(%) 5.4%
Key countries China, Japan, India, South Korea, Australia, Indonesia, US, Canada, Mexico, Germany, UK, France, Italy, Spain, The Netherlands, Saudi Arabia, UAE, South Africa, Israel, Turkey, Brazil, Argentina and Colombia
Competitive landscape Leading Companies, Market Positioning of Companies, Competitive Strategies, and Industry Risks

Request Free Sample

Research Analyst Overview

  • The airport IT spending market is evolving into a highly interconnected ecosystem where data-driven decisions are paramount. The deployment of biometric passenger processing and automated security scanners is becoming standard, supported by backend server architecture designed for real-time analytics.
  • Airports are utilizing digital twin technologies and augmented reality navigation system not just for efficiency but as strategic tools for long-term planning, with some achieving a 15% improvement in resource allocation accuracy. A key trend influencing boardroom strategy is the shift toward software-as-a-service models and cloud-native software suite, which demands a reassessment of capital expenditure versus operational expenditure budgets.
  • This transition is enabled by technologies like flight information display systems and real-time wayfinding applications. Core operational platforms, including air traffic management and baggage handling systems, are being fortified with zero-trust network models and quantum-resistant encryption.
  • The integration of enterprise resource planning software, advanced screening equipment, and LiDAR deployment into a unified framework supported by mobile check-in solutions and automated immigration gates through digital tower solutions underscores the complexity and strategic importance of IT investment in modern aviation.

What are the Key Data Covered in this Airport IT Spending Market Research and Growth Report?

  • What is the expected growth of the Airport IT Spending Market between 2026 and 2030?

    • USD 2.22 billion, at a CAGR of 5.9%

  • What segmentation does the market report cover?

    • The report is segmented by End-user (Operational system, Administrative system, and Passenger processing system), Component (Hardware, Software, and Services), Application (Security, Finance and operations, Maintenance, and Others) and Geography (APAC, North America, Europe, Middle East and Africa, South America)

  • Which regions are analyzed in the report?

    • APAC, North America, Europe, Middle East and Africa and South America

  • What are the key growth drivers and market challenges?

    • Efforts by airports to enhance customer experience, High initial investment and increasing IT complexity

  • Who are the major players in the Airport IT Spending Market?

    • Amadeus IT Group SA, Atos SE, Capgemini SE, China TravelSky Holding Co Ltd, Cobham Ltd., Damarel Systems International, IBM Corp., INFORM GmbH, InterSystems Corp., Lockheed Martin Corp., NEC Corp., Northrop Grumman Corp., RESA SAS, RTX Corp., Saab AB, Siemens AG, SITA, Thales Group and VELATIA S.L

Market Research Insights

  • The market's dynamics are shaped by a push for hyper-efficiency and personalized passenger engagement. The adoption of passenger flow analytics allows airports to optimize terminal layouts and staffing, with some hubs reporting a reduction in security queue times by over 20%.
  • The implementation of smart airport infrastructure, including IoT-enabled infrastructure sensors, supports predictive maintenance, cutting equipment downtime by up to 15%. Investments in IT system integration services are crucial for unifying fragmented systems into a cohesive operational picture. This enables airport collaborative decision-making between airlines, ground handlers, and air traffic control.
  • Furthermore, the deployment of autonomous ground support equipment and sophisticated resource optimization software is streamlining airside operations, directly improving on-time performance and reducing operational costs.

We can help! Our analysts can customize this airport it spending market research report to meet your requirements.

Get in touch

1. Executive Summary

1.1 Market overview

Executive Summary - Chart on Market Overview
Executive Summary - Data Table on Market Overview
Executive Summary - Chart on Global Market Characteristics
Executive Summary - Chart on Market by Geography
Executive Summary - Chart on Market Segmentation by End-user
Executive Summary - Chart on Market Segmentation by Component
Executive Summary - Chart on Market Segmentation by Application
Executive Summary - Chart on Incremental Growth
Executive Summary - Data Table on Incremental Growth
Executive Summary - Chart on Company Market Positioning

2. Technavio Analysis

2.1 Analysis of price sensitivity, lifecycle, customer purchase basket, adoption rates, and purchase criteria

2.2 Criticality of inputs and Factors of differentiation

Chart on Overview on criticality of inputs and factors of differentiation

2.3 Factors of disruption

Chart on Overview on factors of disruption

2.4 Impact of drivers and challenges

Chart on Impact of drivers and challenges in 2025 and 2030

3. Market Landscape

3.1 Market ecosystem

Chart on Parent Market
Data Table on - Parent Market

3.2 Market characteristics

Chart on Market characteristics analysis

3.3 Value chain analysis

Chart on Value chain analysis

4. Market Sizing

4.1 Market definition

Data Table on Offerings of companies included in the market definition

4.2 Market segment analysis

Market segments

4.3 Market size 2025

4.4 Market outlook: Forecast for 2025-2030

Chart on Global - Market size and forecast 2025-2030 ($ million)
Data Table on Global - Market size and forecast 2025-2030 ($ million)
Chart on Global Market: Year-over-year growth 2025-2030 (%)
Data Table on Global Market: Year-over-year growth 2025-2030 (%)

5. Historic Market Size

5.1 Global Airport IT Spending Market 2020 - 2024

Historic Market Size - Data Table on Global Airport IT Spending Market 2020 - 2024 ($ million)

5.2 End-user segment analysis 2020 - 2024

Historic Market Size - End-user Segment 2020 - 2024 ($ million)

5.3 Component segment analysis 2020 - 2024

Historic Market Size - Component Segment 2020 - 2024 ($ million)

5.4 Application segment analysis 2020 - 2024

Historic Market Size - Application Segment 2020 - 2024 ($ million)

5.5 Geography segment analysis 2020 - 2024

Historic Market Size - Geography Segment 2020 - 2024 ($ million)

5.6 Country segment analysis 2020 - 2024

Historic Market Size - Country Segment 2020 - 2024 ($ million)

6. Qualitative Analysis

6.1 The Impact of AI on Global Airport IT Spending Market

7. Five Forces Analysis

7.1 Five forces summary

Five forces analysis - Comparison between 2025 and 2030

7.2 Bargaining power of buyers

Bargaining power of buyers - Impact of key factors 2025 and 2030

7.3 Bargaining power of suppliers

Bargaining power of suppliers - Impact of key factors in 2025 and 2030

7.4 Threat of new entrants

Threat of new entrants - Impact of key factors in 2025 and 2030

7.5 Threat of substitutes

Threat of substitutes - Impact of key factors in 2025 and 2030

7.6 Threat of rivalry

Threat of rivalry - Impact of key factors in 2025 and 2030

7.7 Market condition

Chart on Market condition - Five forces 2025 and 2030

8. Market Segmentation by End-user

8.1 Market segments

Chart on End-user - Market share 2025-2030 (%)
Data Table on End-user - Market share 2025-2030 (%)

8.2 Comparison by End-user

Chart on Comparison by End-user
Data Table on Comparison by End-user

8.3 Operational system - Market size and forecast 2025-2030

Chart on Operational system - Market size and forecast 2025-2030 ($ million)
Data Table on Operational system - Market size and forecast 2025-2030 ($ million)
Chart on Operational system - Year-over-year growth 2025-2030 (%)
Data Table on Operational system - Year-over-year growth 2025-2030 (%)

8.4 Administrative system - Market size and forecast 2025-2030

Chart on Administrative system - Market size and forecast 2025-2030 ($ million)
Data Table on Administrative system - Market size and forecast 2025-2030 ($ million)
Chart on Administrative system - Year-over-year growth 2025-2030 (%)
Data Table on Administrative system - Year-over-year growth 2025-2030 (%)

8.5 Passenger processing system - Market size and forecast 2025-2030

Chart on Passenger processing system - Market size and forecast 2025-2030 ($ million)
Data Table on Passenger processing system - Market size and forecast 2025-2030 ($ million)
Chart on Passenger processing system - Year-over-year growth 2025-2030 (%)
Data Table on Passenger processing system - Year-over-year growth 2025-2030 (%)

8.6 Market opportunity by End-user

Market opportunity by End-user ($ million)
Data Table on Market opportunity by End-user ($ million)

9. Market Segmentation by Component

9.1 Market segments

Chart on Component - Market share 2025-2030 (%)
Data Table on Component - Market share 2025-2030 (%)

9.2 Comparison by Component

Chart on Comparison by Component
Data Table on Comparison by Component

9.3 Hardware - Market size and forecast 2025-2030

Chart on Hardware - Market size and forecast 2025-2030 ($ million)
Data Table on Hardware - Market size and forecast 2025-2030 ($ million)
Chart on Hardware - Year-over-year growth 2025-2030 (%)
Data Table on Hardware - Year-over-year growth 2025-2030 (%)

9.4 Software - Market size and forecast 2025-2030

Chart on Software - Market size and forecast 2025-2030 ($ million)
Data Table on Software - Market size and forecast 2025-2030 ($ million)
Chart on Software - Year-over-year growth 2025-2030 (%)
Data Table on Software - Year-over-year growth 2025-2030 (%)

9.5 Services - Market size and forecast 2025-2030

Chart on Services - Market size and forecast 2025-2030 ($ million)
Data Table on Services - Market size and forecast 2025-2030 ($ million)
Chart on Services - Year-over-year growth 2025-2030 (%)
Data Table on Services - Year-over-year growth 2025-2030 (%)

9.6 Market opportunity by Component

Market opportunity by Component ($ million)
Data Table on Market opportunity by Component ($ million)

10. Market Segmentation by Application

10.1 Market segments

Chart on Application - Market share 2025-2030 (%)
Data Table on Application - Market share 2025-2030 (%)

10.2 Comparison by Application

Chart on Comparison by Application
Data Table on Comparison by Application

10.3 Security - Market size and forecast 2025-2030

Chart on Security - Market size and forecast 2025-2030 ($ million)
Data Table on Security - Market size and forecast 2025-2030 ($ million)
Chart on Security - Year-over-year growth 2025-2030 (%)
Data Table on Security - Year-over-year growth 2025-2030 (%)

10.4 Finance and operations - Market size and forecast 2025-2030

Chart on Finance and operations - Market size and forecast 2025-2030 ($ million)
Data Table on Finance and operations - Market size and forecast 2025-2030 ($ million)
Chart on Finance and operations - Year-over-year growth 2025-2030 (%)
Data Table on Finance and operations - Year-over-year growth 2025-2030 (%)

10.5 Maintenance - Market size and forecast 2025-2030

Chart on Maintenance - Market size and forecast 2025-2030 ($ million)
Data Table on Maintenance - Market size and forecast 2025-2030 ($ million)
Chart on Maintenance - Year-over-year growth 2025-2030 (%)
Data Table on Maintenance - Year-over-year growth 2025-2030 (%)

10.6 Others - Market size and forecast 2025-2030

Chart on Others - Market size and forecast 2025-2030 ($ million)
Data Table on Others - Market size and forecast 2025-2030 ($ million)
Chart on Others - Year-over-year growth 2025-2030 (%)
Data Table on Others - Year-over-year growth 2025-2030 (%)

10.7 Market opportunity by Application

Market opportunity by Application ($ million)
Data Table on Market opportunity by Application ($ million)

11. Customer Landscape

11.1 Customer landscape overview

Analysis of price sensitivity, lifecycle, customer purchase basket, adoption rates, and purchase criteria

12. Geographic Landscape

12.1 Geographic segmentation

Chart on Market share by geography 2025-2030 (%)
Data Table on Market share by geography 2025-2030 (%)

12.2 Geographic comparison

Chart on Geographic comparison
Data Table on Geographic comparison

12.3 APAC - Market size and forecast 2025-2030

Chart on APAC - Market size and forecast 2025-2030 ($ million)
Data Table on APAC - Market size and forecast 2025-2030 ($ million)
Chart on APAC - Year-over-year growth 2025-2030 (%)
Data Table on APAC - Year-over-year growth 2025-2030 (%)
Chart on Regional Comparison - APAC
Data Table on Regional Comparison - APAC

12.3.1 China - Market size and forecast 2025-2030

Chart on China - Market size and forecast 2025-2030 ($ million)
Data Table on China - Market size and forecast 2025-2030 ($ million)
Chart on China - Year-over-year growth 2025-2030 (%)
Data Table on China - Year-over-year growth 2025-2030 (%)

12.3.2 Japan - Market size and forecast 2025-2030

Chart on Japan - Market size and forecast 2025-2030 ($ million)
Data Table on Japan - Market size and forecast 2025-2030 ($ million)
Chart on Japan - Year-over-year growth 2025-2030 (%)
Data Table on Japan - Year-over-year growth 2025-2030 (%)

12.3.3 India - Market size and forecast 2025-2030

Chart on India - Market size and forecast 2025-2030 ($ million)
Data Table on India - Market size and forecast 2025-2030 ($ million)
Chart on India - Year-over-year growth 2025-2030 (%)
Data Table on India - Year-over-year growth 2025-2030 (%)

12.3.4 South Korea - Market size and forecast 2025-2030

Chart on South Korea - Market size and forecast 2025-2030 ($ million)
Data Table on South Korea - Market size and forecast 2025-2030 ($ million)
Chart on South Korea - Year-over-year growth 2025-2030 (%)
Data Table on South Korea - Year-over-year growth 2025-2030 (%)

12.3.5 Australia - Market size and forecast 2025-2030

Chart on Australia - Market size and forecast 2025-2030 ($ million)
Data Table on Australia - Market size and forecast 2025-2030 ($ million)
Chart on Australia - Year-over-year growth 2025-2030 (%)
Data Table on Australia - Year-over-year growth 2025-2030 (%)

12.3.6 Indonesia - Market size and forecast 2025-2030

Chart on Indonesia - Market size and forecast 2025-2030 ($ million)
Data Table on Indonesia - Market size and forecast 2025-2030 ($ million)
Chart on Indonesia - Year-over-year growth 2025-2030 (%)
Data Table on Indonesia - Year-over-year growth 2025-2030 (%)

12.4 North America - Market size and forecast 2025-2030

Chart on North America - Market size and forecast 2025-2030 ($ million)
Data Table on North America - Market size and forecast 2025-2030 ($ million)
Chart on North America - Year-over-year growth 2025-2030 (%)
Data Table on North America - Year-over-year growth 2025-2030 (%)
Chart on Regional Comparison - North America
Data Table on Regional Comparison - North America

12.4.1 US - Market size and forecast 2025-2030

Chart on US - Market size and forecast 2025-2030 ($ million)
Data Table on US - Market size and forecast 2025-2030 ($ million)
Chart on US - Year-over-year growth 2025-2030 (%)
Data Table on US - Year-over-year growth 2025-2030 (%)

12.4.2 Canada - Market size and forecast 2025-2030

Chart on Canada - Market size and forecast 2025-2030 ($ million)
Data Table on Canada - Market size and forecast 2025-2030 ($ million)
Chart on Canada - Year-over-year growth 2025-2030 (%)
Data Table on Canada - Year-over-year growth 2025-2030 (%)

12.4.3 Mexico - Market size and forecast 2025-2030

Chart on Mexico - Market size and forecast 2025-2030 ($ million)
Data Table on Mexico - Market size and forecast 2025-2030 ($ million)
Chart on Mexico - Year-over-year growth 2025-2030 (%)
Data Table on Mexico - Year-over-year growth 2025-2030 (%)

12.5 Europe - Market size and forecast 2025-2030

Chart on Europe - Market size and forecast 2025-2030 ($ million)
Data Table on Europe - Market size and forecast 2025-2030 ($ million)
Chart on Europe - Year-over-year growth 2025-2030 (%)
Data Table on Europe - Year-over-year growth 2025-2030 (%)
Chart on Regional Comparison - Europe
Data Table on Regional Comparison - Europe

12.5.1 Germany - Market size and forecast 2025-2030

Chart on Germany - Market size and forecast 2025-2030 ($ million)
Data Table on Germany - Market size and forecast 2025-2030 ($ million)
Chart on Germany - Year-over-year growth 2025-2030 (%)
Data Table on Germany - Year-over-year growth 2025-2030 (%)

12.5.2 UK - Market size and forecast 2025-2030

Chart on UK - Market size and forecast 2025-2030 ($ million)
Data Table on UK - Market size and forecast 2025-2030 ($ million)
Chart on UK - Year-over-year growth 2025-2030 (%)
Data Table on UK - Year-over-year growth 2025-2030 (%)

12.5.3 France - Market size and forecast 2025-2030

Chart on France - Market size and forecast 2025-2030 ($ million)
Data Table on France - Market size and forecast 2025-2030 ($ million)
Chart on France - Year-over-year growth 2025-2030 (%)
Data Table on France - Year-over-year growth 2025-2030 (%)

12.5.4 Italy - Market size and forecast 2025-2030

Chart on Italy - Market size and forecast 2025-2030 ($ million)
Data Table on Italy - Market size and forecast 2025-2030 ($ million)
Chart on Italy - Year-over-year growth 2025-2030 (%)
Data Table on Italy - Year-over-year growth 2025-2030 (%)

12.5.5 Spain - Market size and forecast 2025-2030

Chart on Spain - Market size and forecast 2025-2030 ($ million)
Data Table on Spain - Market size and forecast 2025-2030 ($ million)
Chart on Spain - Year-over-year growth 2025-2030 (%)
Data Table on Spain - Year-over-year growth 2025-2030 (%)

12.5.6 The Netherlands - Market size and forecast 2025-2030

Chart on The Netherlands - Market size and forecast 2025-2030 ($ million)
Data Table on The Netherlands - Market size and forecast 2025-2030 ($ million)
Chart on The Netherlands - Year-over-year growth 2025-2030 (%)
Data Table on The Netherlands - Year-over-year growth 2025-2030 (%)

12.6 Middle East and Africa - Market size and forecast 2025-2030

Chart on Middle East and Africa - Market size and forecast 2025-2030 ($ million)
Data Table on Middle East and Africa - Market size and forecast 2025-2030 ($ million)
Chart on Middle East and Africa - Year-over-year growth 2025-2030 (%)
Data Table on Middle East and Africa - Year-over-year growth 2025-2030 (%)
Chart on Regional Comparison - Middle East and Africa
Data Table on Regional Comparison - Middle East and Africa

12.6.1 Saudi Arabia - Market size and forecast 2025-2030

Chart on Saudi Arabia - Market size and forecast 2025-2030 ($ million)
Data Table on Saudi Arabia - Market size and forecast 2025-2030 ($ million)
Chart on Saudi Arabia - Year-over-year growth 2025-2030 (%)
Data Table on Saudi Arabia - Year-over-year growth 2025-2030 (%)

12.6.2 UAE - Market size and forecast 2025-2030

Chart on UAE - Market size and forecast 2025-2030 ($ million)
Data Table on UAE - Market size and forecast 2025-2030 ($ million)
Chart on UAE - Year-over-year growth 2025-2030 (%)
Data Table on UAE - Year-over-year growth 2025-2030 (%)

12.6.3 South Africa - Market size and forecast 2025-2030

Chart on South Africa - Market size and forecast 2025-2030 ($ million)
Data Table on South Africa - Market size and forecast 2025-2030 ($ million)
Chart on South Africa - Year-over-year growth 2025-2030 (%)
Data Table on South Africa - Year-over-year growth 2025-2030 (%)

12.6.4 Israel - Market size and forecast 2025-2030

Chart on Israel - Market size and forecast 2025-2030 ($ million)
Data Table on Israel - Market size and forecast 2025-2030 ($ million)
Chart on Israel - Year-over-year growth 2025-2030 (%)
Data Table on Israel - Year-over-year growth 2025-2030 (%)

12.6.5 Turkey - Market size and forecast 2025-2030

Chart on Turkey - Market size and forecast 2025-2030 ($ million)
Data Table on Turkey - Market size and forecast 2025-2030 ($ million)
Chart on Turkey - Year-over-year growth 2025-2030 (%)
Data Table on Turkey - Year-over-year growth 2025-2030 (%)

12.7 South America - Market size and forecast 2025-2030

Chart on South America - Market size and forecast 2025-2030 ($ million)
Data Table on South America - Market size and forecast 2025-2030 ($ million)
Chart on South America - Year-over-year growth 2025-2030 (%)
Data Table on South America - Year-over-year growth 2025-2030 (%)
Chart on Regional Comparison - South America
Data Table on Regional Comparison - South America

12.7.1 Brazil - Market size and forecast 2025-2030

Chart on Brazil - Market size and forecast 2025-2030 ($ million)
Data Table on Brazil - Market size and forecast 2025-2030 ($ million)
Chart on Brazil - Year-over-year growth 2025-2030 (%)
Data Table on Brazil - Year-over-year growth 2025-2030 (%)

12.7.2 Argentina - Market size and forecast 2025-2030

Chart on Argentina - Market size and forecast 2025-2030 ($ million)
Data Table on Argentina - Market size and forecast 2025-2030 ($ million)
Chart on Argentina - Year-over-year growth 2025-2030 (%)
Data Table on Argentina - Year-over-year growth 2025-2030 (%)

12.7.3 Colombia - Market size and forecast 2025-2030

Chart on Colombia - Market size and forecast 2025-2030 ($ million)
Data Table on Colombia - Market size and forecast 2025-2030 ($ million)
Chart on Colombia - Year-over-year growth 2025-2030 (%)
Data Table on Colombia - Year-over-year growth 2025-2030 (%)

12.8 Market opportunity by geography

Market opportunity by geography ($ million)
Data Tables on Market opportunity by geography ($ million)

13. Drivers, Challenges, and Opportunity

13.1 Market drivers

Efforts by airports to enhance customer experience
Growing importance of loyalty programs due to IT integration
Increasing demand for IT security at airports

13.2 Market challenges

High initial investment and increasing IT complexity
Difficulties in organizing large amounts of data
Constantly evolving regulatory standards on threats to data security and privacy

13.3 Impact of drivers and challenges

Impact of drivers and challenges in 2025 and 2030

13.4 Market opportunities

Focus on establishing high-end cybersecurity at airports
Rise in demand for cloud-based CRM
Need for real-time wait time monitoring systems

14. Competitive Landscape

14.1 Overview

14.2

Overview on criticality of inputs and factors of differentiation

14.3 Landscape disruption

Overview on factors of disruption

14.4 Industry risks

Impact of key risks on business

15. Competitive Analysis

15.1 Companies profiled

Companies covered

15.2 Company ranking index

15.3 Market positioning of companies

Matrix on companies position and classification

15.4 Amadeus IT Group SA

Amadeus IT Group SA - Overview
Amadeus IT Group SA - Business segments
Amadeus IT Group SA - Key news
Amadeus IT Group SA - Key offerings
Amadeus IT Group SA - Segment focus
SWOT

15.5 Atos SE

Atos SE - Overview
Atos SE - Business segments
Atos SE - Key news
Atos SE - Key offerings
Atos SE - Segment focus
SWOT

15.6 Capgemini SE

Capgemini SE - Overview
Capgemini SE - Business segments
Capgemini SE - Key news
Capgemini SE - Key offerings
Capgemini SE - Segment focus
SWOT

15.7 Cobham Ltd.

Cobham Ltd. - Overview
Cobham Ltd. - Product / Service
Cobham Ltd. - Key offerings
SWOT

15.8 Damarel Systems International

Damarel Systems International - Overview
Damarel Systems International - Product / Service
Damarel Systems International - Key offerings
SWOT

15.9 IBM Corp.

IBM Corp. - Overview
IBM Corp. - Business segments
IBM Corp. - Key news
IBM Corp. - Key offerings
IBM Corp. - Segment focus
SWOT

15.10 INFORM GmbH

INFORM GmbH - Overview
INFORM GmbH - Product / Service
INFORM GmbH - Key offerings
SWOT

15.11 InterSystems Corp.

InterSystems Corp. - Overview
InterSystems Corp. - Product / Service
InterSystems Corp. - Key offerings
SWOT

15.12 Lockheed Martin Corp.

Lockheed Martin Corp. - Overview
Lockheed Martin Corp. - Business segments
Lockheed Martin Corp. - Key news
Lockheed Martin Corp. - Key offerings
Lockheed Martin Corp. - Segment focus
SWOT

15.13 NEC Corp.

NEC Corp. - Overview
NEC Corp. - Business segments
NEC Corp. - Key news
NEC Corp. - Key offerings
NEC Corp. - Segment focus
SWOT

15.14 Northrop Grumman Corp.

Northrop Grumman Corp. - Overview
Northrop Grumman Corp. - Business segments
Northrop Grumman Corp. - Key news
Northrop Grumman Corp. - Key offerings
Northrop Grumman Corp. - Segment focus
SWOT

15.15 RTX Corp.

RTX Corp. - Overview
RTX Corp. - Business segments
RTX Corp. - Key news
RTX Corp. - Key offerings
RTX Corp. - Segment focus
SWOT

15.16 Saab AB

Saab AB - Overview
Saab AB - Business segments
Saab AB - Key news
Saab AB - Key offerings
Saab AB - Segment focus
SWOT

15.17 Siemens AG

Siemens AG - Overview
Siemens AG - Business segments
Siemens AG - Key news
Siemens AG - Key offerings
Siemens AG - Segment focus
SWOT

15.18 Thales Group

Thales Group - Overview
Thales Group - Business segments
Thales Group - Key news
Thales Group - Key offerings
Thales Group - Segment focus
SWOT

16. Appendix

16.1 Scope of the report

Market definition
Objectives
Notes and caveats

16.2 Inclusions and exclusions checklist

Inclusions checklist
Exclusions checklist

16.3 Currency conversion rates for US$

16.4 Research methodology

16.5 Data procurement

Information sources

16.6 Data validation

16.7 Validation techniques employed for market sizing

16.8 Data synthesis

16.9 360 degree market analysis

16.10 List of abbreviations

Research Methodology

Technavio presents a detailed picture of the market by way of study, synthesis, and summation of data from multiple sources. The analysts have presented the various facets of the market with a particular focus on identifying the key industry influencers. The data thus presented is comprehensive, reliable, and the result of extensive research, both primary and secondary.

INFORMATION SOURCES

Primary sources

  • Manufacturers and suppliers
  • Channel partners
  • Industry experts
  • Strategic decision makers

Secondary sources

  • Industry journals and periodicals
  • Government data
  • Financial reports of key industry players
  • Historical data
  • Press releases

DATA ANALYSIS

Data Synthesis

  • Collation of data
  • Estimation of key figures
  • Analysis of derived insights

Data Validation

  • Triangulation with data models
  • Reference against proprietary databases
  • Corroboration with industry experts

REPORT WRITING

Qualitative

  • Market drivers
  • Market challenges
  • Market trends
  • Five forces analysis

Quantitative

  • Market size and forecast
  • Market segmentation
  • Geographical insights
  • Competitive landscape

Interested in this report?

Get your sample now to see our research methodology and insights!

Download Now

Frequently Asked Questions

Airport IT Spending market growth will increase by USD 2219.1 million during 2026-2030.

The Airport IT Spending market is expected to grow at a CAGR of 5.9% during 2026-2030.

Airport IT Spending market is segmented by End-user (Operational system, Administrative system, Passenger processing system) Component (Hardware, Software, Services) Application (Security, Finance and operations, Maintenance, Others)

Amadeus IT Group SA, Atos SE, Capgemini SE, China TravelSky Holding Co Ltd, Cobham Ltd., Damarel Systems International, IBM Corp., INFORM GmbH, InterSystems Corp., Lockheed Martin Corp., NEC Corp., Northrop Grumman Corp., RESA SAS, RTX Corp., Saab AB, Siemens AG, SITA, Thales Group, VELATIA S.L are a few of the key vendors in the Airport IT Spending market.

APAC will register the highest growth rate of 36.5% among the other regions. Therefore, the Airport IT Spending market in APAC is expected to garner significant business opportunities for the vendors during the forecast period.

China, Japan, India, South Korea, Australia, Indonesia, US, Canada, Mexico, Germany, UK, France, Italy, Spain, The Netherlands, Saudi Arabia, UAE, South Africa, Israel, Turkey, Brazil, Argentina, Colombia

  • Efforts by airports to enhance customer experience is the driving factor this market.

The Airport IT Spending market vendors should focus on grabbing business opportunities from the End-user segment as it accounted for the largest market share in the base year.
RIA - Research AI Assistant
Ask RIA