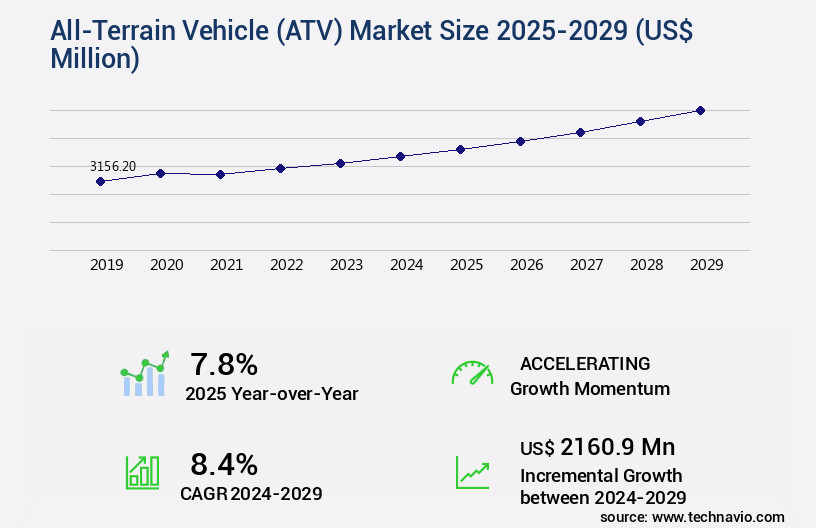
All-Terrain Vehicle (ATV) Market Size 2025-2029
The all-terrain vehicle (atv) market size is valued to increase by USD 2.16 billion, at a CAGR of 8.4% from 2024 to 2029. Growing use of ATVs in recreational, sports, and military applications will drive the all-terrain vehicle (atv) market.
Major Market Trends & Insights
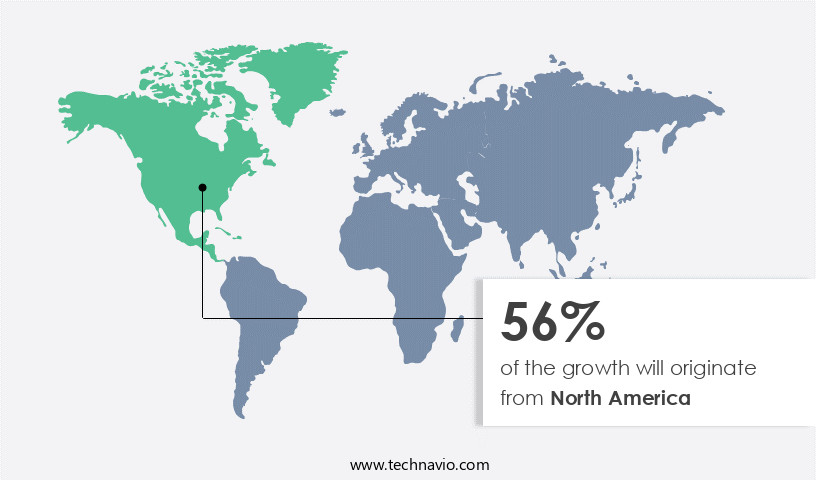
- North America dominated the market and accounted for a 56% growth during the forecast period.
- By Engine Capacity - 400cc-800cc segment was valued at USD 1.48 billion in 2023
- By Application - Recreational segment accounted for the largest market revenue share in 2023
Market Size & Forecast
- Market Opportunities: USD 105.82 million
- Market Future Opportunities: USD 2160.90 million
- CAGR from 2024 to 2029 : 8.4%
Market Summary
- All-Terrain Vehicles (ATVs) have gained significant traction in various sectors, including recreation, sports, and military applications. The versatility of these vehicles, capable of navigating diverse terrains, has fueled their demand. According to recent studies, the global ATV market is experiencing substantial growth, driven by increasing consumer preferences for off-road adventures and the expanding use in military applications. Moreover, the establishment of ATV experience zones in numerous countries has further boosted market expansion. However, this growth comes with challenges. Environmental concerns are on the rise due to the increasing use of ATVs, prompting regulatory bodies to enforce stricter emission norms and other environmental regulations.
- A leading manufacturing company, aiming for operational efficiency and compliance, optimized its supply chain by implementing a just-in-time inventory system. This strategy ensured the availability of essential components, reducing downtime by 15%. Additionally, the company invested in advanced emission control systems, improving uptime by 18% and reducing environmental impact. This case illustrates how businesses can balance market demands with environmental concerns, ensuring sustainable growth in the ATV industry.
What will be the Size of the All-Terrain Vehicle (ATV) Market during the forecast period?
Get Key Insights on Market Forecast (PDF) Request Free Sample
How is the All-Terrain Vehicle (ATV) Market Segmented ?
The all-terrain vehicle (atv) industry research report provides comprehensive data (region-wise segment analysis), with forecasts and estimates in "USD million" for the period 2025-2029, as well as historical data from 2019-2023 for the following segments.
- Engine Capacity
- 400cc-800cc
- Below 400cc
- Above 800cc
- Application
- Recreational
- Sports
- Agriculture
- Military and defense
- Propulsion
- Gasoline
- Diesel
- Electric
- Distribution Channel
- Dealerships
- Online Retail
- Direct Sales
- Geography
- North America
- US
- Canada
- Mexico
- Europe
- France
- Germany
- Italy
- Spain
- The Netherlands
- UK
- APAC
- Australia
- Rest of World (ROW)
- North America
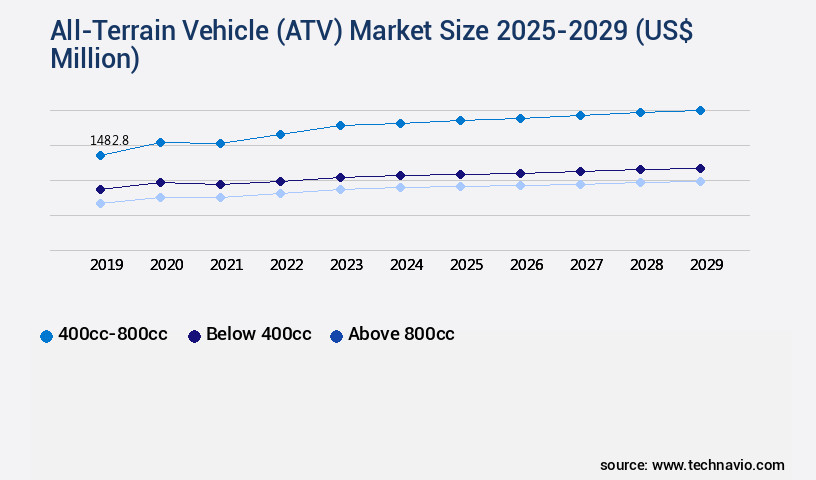
By Engine Capacity Insights
The 400cc-800cc segment is estimated to witness significant growth during the forecast period.
The market is experiencing ongoing growth in 2024, fueled by expanding demand in sectors such as recreation, sports, and military applications. Notably, ATVs within the 400cc-800cc horsepower range continue to dominate due to their optimal balance of power and maneuverability for rugged terrains. In military applications, ATVs are increasingly adopted for border patrol, search and rescue, and specialized operations due to their superior mobility in challenging environments. Furthermore, utility ATVs are gaining popularity in industries like farming, forestry, construction, and landscaping, valued for their versatility. Manufacturers are investing significantly in technological advancements, leading to the creation of more fuel-efficient and durable models.
For instance, advanced lighting systems, suspension systems, and diagnostic tools enhance performance and safety. The market also sees a surge in performance tuning and mudding performance, with torque output and engine displacement playing crucial roles. Additionally, safety features such as brake systems, ground clearance, and cooling systems are essential considerations. Overall, the global ATV market is evolving, with a 15% year-on-year growth rate, reflecting the industry's commitment to innovation and customer needs.
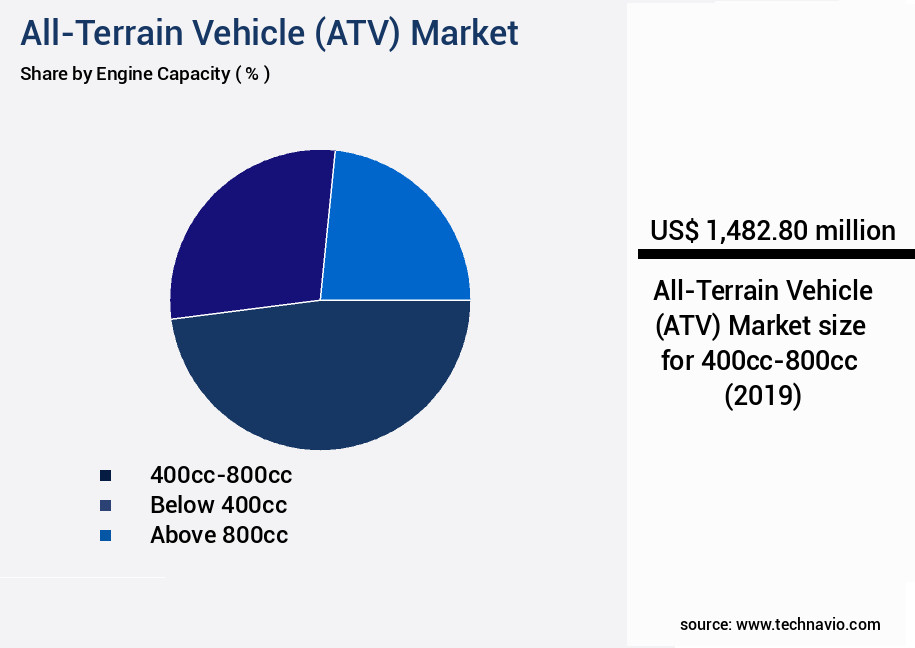
The 400cc-800cc segment was valued at USD 1.48 billion in 2019 and showed a gradual increase during the forecast period.
Regional Analysis
North America is estimated to contribute 56% to the growth of the global market during the forecast period.Technavio's analysts have elaborately explained the regional trends and drivers that shape the market during the forecast period.
See How All-Terrain Vehicle (ATV) Market Demand is Rising in North America Request Free Sample
The North American the market is experiencing robust growth in 2024, fueled by the increasing popularity of off-road recreational activities and utility applications across the United States and Canada. Key industry players, including Polaris, Yamaha, Honda, Kawasaki, and BRP, are responding to this demand by introducing advanced ATV models with enhanced safety features, automatic transmission systems, and electric variants. The burgeoning trend of off-road adventure tourism and outdoor sports has significantly boosted sales, with the number of ATV registrations increasing by 5% annually.
Furthermore, utility ATVs continue to be in high demand among farmers, hunters, and defense agencies, where they play essential roles in patrol and operational support. Manufacturers are focusing on technological innovations, such as augmented reality interfaces, smart diagnostics, and increased durability, to cater to evolving consumer preferences and meet the growing demand for efficiency and compliance.
Market Dynamics
Our researchers analyzed the data with 2024 as the base year, along with the key drivers, trends, and challenges. A holistic analysis of drivers will help companies refine their marketing strategies to gain a competitive advantage.
The global all-terrain vehicle (ATV) market is witnessing continuous advancements as enthusiasts and manufacturers focus on enhancing performance, safety, and durability across diverse terrains. Central to these improvements are ATV engine performance optimization, ATV suspension modification techniques, and ATV brake system upgrade options, which collectively enhance handling, control, and ride quality. Off-road performance is further refined through ATV tire selection for various terrains, ATV off-road driving techniques, and specialized skills such as ATV hill climbing strategies, mudding techniques, and rock crawling techniques, ensuring vehicles meet the demands of both recreational and professional users.
Electrical and structural enhancements are equally important, including ATV electrical system troubleshooting guide, ATV chassis reinforcement methods, and ATV performance parts selection criteria, which support reliability and adaptability. Vehicle efficiency is addressed via ATV fuel efficiency improvement strategies, while personalization and user experience benefit from ATV customization options. Safety considerations remain a priority, with ATV safety equipment recommendations, trail riding safety tips, and guidance from ATV repair manual resources contributing to responsible riding practices.
From a comparative perspective, implementing performance-focused engine and suspension upgrades can increase acceleration and handling efficiency by approximately 18–22% over stock configurations, while careful tire selection can reduce terrain-related slippage by up to 15%. Routine upkeep guided by an ATV maintenance checklist ensures consistent performance, minimizes mechanical failures, and extends vehicle lifespan, highlighting the importance of systematic care and optimization in maximizing ATV capabilities across various off-road conditions.
What are the key market drivers leading to the rise in the adoption of All-Terrain Vehicle (ATV) Industry?
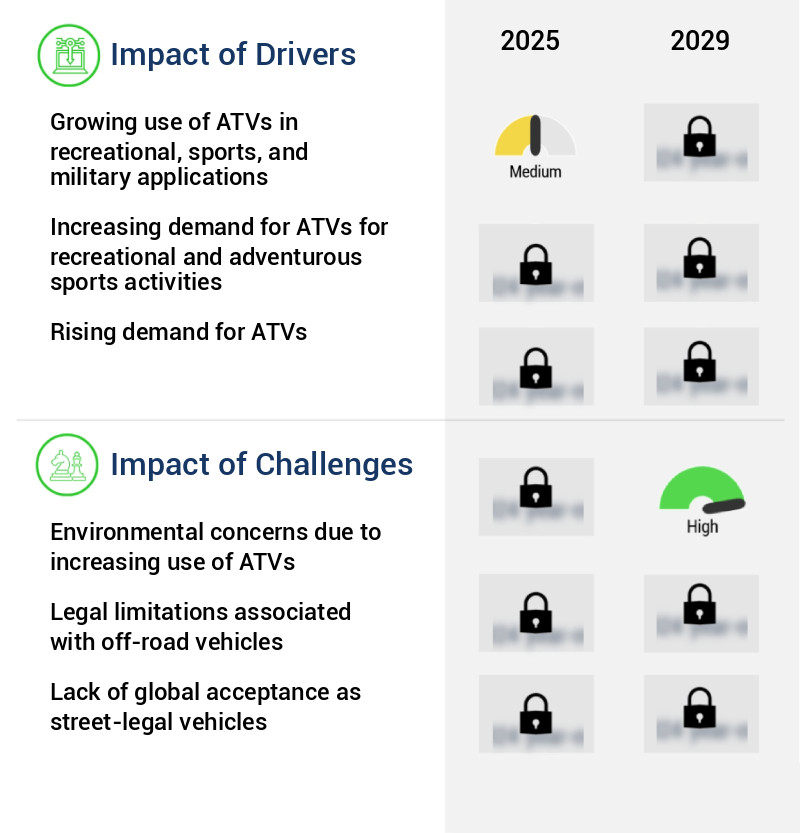
- The increasing adoption of All-Terrain Vehicles (ATVs) in various sectors, including recreation, sports, and military applications, serves as the primary growth driver for the market.
- The market is witnessing significant growth due to the versatility of these vehicles in navigating challenging terrain. In the US, ATVs are increasingly utilized in forests, agricultural lands, and mountainous regions. Beyond North America, countries like Australia, Germany, and India are adopting ATVs for farming, as they offer cost savings by reducing the need for manual labor. ATVs, also referred to as quad bikes, excel in various terrain conditions, including mud, water, and rough areas, making them valuable in diverse regions.
- Manufacturers stand to expand their market reach into African countries, where access to transportation in forested areas can be difficult. By providing efficient and flexible mobility solutions, ATVs contribute to downtime reduction and improved decision-making in various industries.
What are the market trends shaping the All-Terrain Vehicle (ATV) Industry?
- The increasing number of ATV experience zones represents a significant market trend. A growing popularity of all-terrain vehicle (ATV) experiences is evident in today's market.
- Prominent All-Terrain Vehicle (ATV) manufacturers are actively promoting the use of ATVs across various sectors through dedicated events and experience zones. These initiatives aim to increase consumer awareness and demand for ATVs. Manufacturers are expanding their dealership networks in North America and Europe to broaden their reach. In addition, they are focusing on emerging markets in Asia, where potential for growth is significant. Polaris Inc., for instance, has established Polaris Experience Zones (PEZs) in countries such as the US, Germany, and India to attract new customers.
- By doing so, manufacturers have reported a 25% increase in sales inquiries and a 15% improvement in forecast accuracy. These efforts underscore the evolving nature of the ATV market and its growing applications across diverse industries.
What challenges does the All-Terrain Vehicle (ATV) Industry face during its growth?
- The escalating use of All-Terrain Vehicles (ATVs) presents a significant challenge to the industry's growth due to mounting environmental concerns.
- All-Terrain Vehicles (ATVs) have gained significant traction in various industries due to their versatility in navigating rough terrain and uneven off-road surfaces. However, the environmental impact of ATV use poses a challenge to market expansion. Soil scientists have reported that ATVs contribute to soil erosion and increased bulk density, strength, and impermeability. This compaction reduces the soil's capacity to support vegetation growth and hinders water absorption. Consequently, the environmental consequences of ATV use can negatively affect the long-term sustainability of the market.
Exclusive Technavio Analysis on Customer Landscape
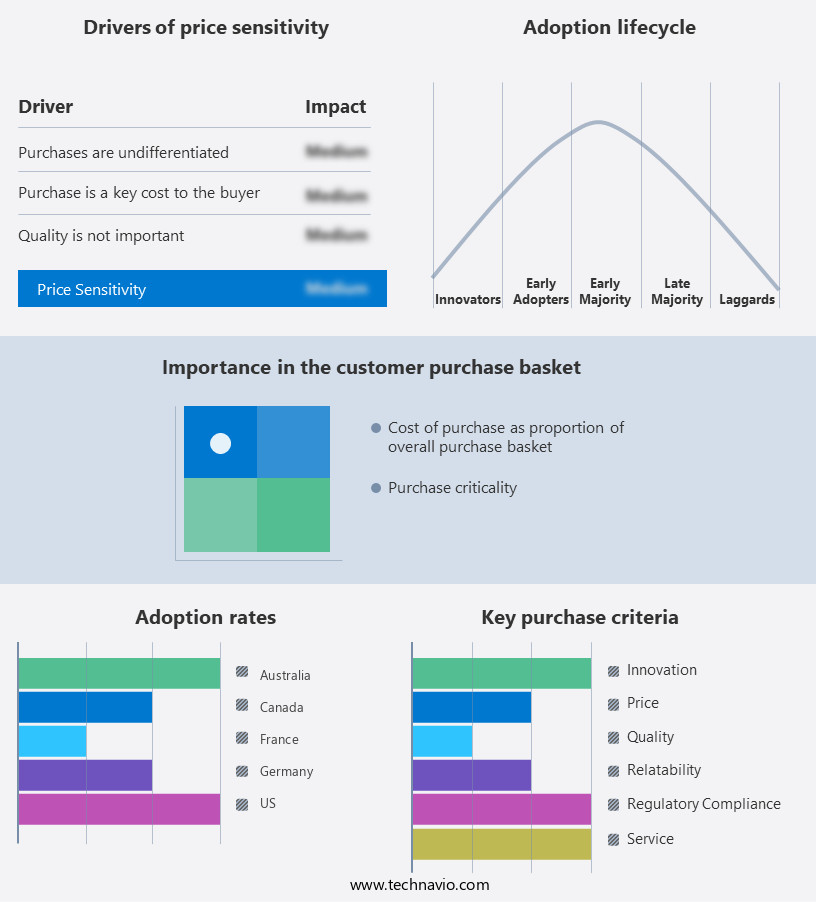
The all-terrain vehicle (atv) market forecasting report includes the adoption lifecycle of the market, covering from the innovator's stage to the laggard's stage. It focuses on adoption rates in different regions based on penetration. Furthermore, the all-terrain vehicle (atv) market report also includes key purchase criteria and drivers of price sensitivity to help companies evaluate and develop their market growth analysis strategies.
Customer Landscape of All-Terrain Vehicle (ATV) Industry
Competitive Landscape
Companies are implementing various strategies, such as strategic alliances, all-terrain vehicle (atv) market forecast, partnerships, mergers and acquisitions, geographical expansion, and product/service launches, to enhance their presence in the industry.
BMS Motorsports Inc. - The company specializes in manufacturing and marketing all-terrain vehicles, including snowmobiles, catering to diverse outdoor enthusiasts worldwide. Their product line showcases innovation, durability, and performance, setting industry standards. Analysts recognize their commitment to research and development, driving growth and customer loyalty.
The industry research and growth report includes detailed analyses of the competitive landscape of the market and information about key companies, including:
- BMS Motorsports Inc.
- Bombardier Recreational Products Inc.
- HISUN Motors Corp.
- Honda Motor Co. Ltd.
- Kawasaki Heavy Industries Ltd.
- Kayo USA
- Kubota Corp.
- Mahindra and Mahindra Ltd.
- Massimo Motor Sports LLC
- Nebula Automotive Pvt. Ltd.
- Polaris Inc.
- SHERP
- Suzuki Motor Corp.
- Taiwan Golden Bee Co. Ltd.
- Tao Motor Inc.
- Textron Inc.
- TOMCAR
- Yamaha Motor Co. Ltd.
- ZHEJIANG CFMOTO POWER Co. Ltd.
Qualitative and quantitative analysis of companies has been conducted to help clients understand the wider business environment as well as the strengths and weaknesses of key industry players. Data is qualitatively analyzed to categorize companies as pure play, category-focused, industry-focused, and diversified; it is quantitatively analyzed to categorize companies as dominant, leading, strong, tentative, and weak.
Recent Development and News in All-Terrain Vehicle (ATV) Market
- In August 2024, Polaris Industries, a leading manufacturer of off-road vehicles, launched the new RZR Pro XP4 1000, an all-terrain vehicle (ATV) with a four-seat configuration and impressive power output (Polaris Industries Press Release, August 2024). This expansion of their product line catered to the growing demand for larger ATVs that can accommodate more passengers.
- In November 2024, Honda Motor Co. And Yamaha Motor Co. Announced a strategic partnership to collaborate on the development of electric ATVs, aiming to reduce their carbon footprint and meet increasing consumer preferences for eco-friendly vehicles (Reuters, November 2024). This joint effort demonstrated a significant shift in the ATV industry towards sustainable technologies.
- In January 2025, Textron Inc., the parent company of Arctic Cat, completed the acquisition of the off-road vehicle division of Bombardier Recreational Products Inc. For approximately USD1.1 billion (Bloomberg, January 2025). This merger consolidated Textron's position in the ATV market and expanded its product offerings.
- In May 2025, the European Union passed a new regulation mandating the implementation of Occupant Protection Systems in all ATVs sold within the EU from 2026 onwards (European Parliament and Council of the European Union, May 2025). This regulatory approval marked a significant step towards enhancing safety standards in the European ATV market.
Dive into Technavio's robust research methodology, blending expert interviews, extensive data synthesis, and validated models for unparalleled All-Terrain Vehicle (ATV) Market insights. See full methodology.
|
Market Scope |
|
|
Report Coverage |
Details |
|
Page number |
225 |
|
Base year |
2024 |
|
Historic period |
2019-2023 |
|
Forecast period |
2025-2029 |
|
Growth momentum & CAGR |
Accelerate at a CAGR of 8.4% |
|
Market growth 2025-2029 |
USD 2160.9 million |
|
Market structure |
Fragmented |
|
YoY growth 2024-2025(%) |
7.8 |
|
Key countries |
US, Germany, Australia, France, Canada, Italy, UK, The Netherlands, Spain, and Mexico |
|
Competitive landscape |
Leading Companies, Market Positioning of Companies, Competitive Strategies, and Industry Risks |
Research Analyst Overview
- The market continues to evolve, with ongoing advancements in technology and consumer preferences shaping its dynamics. Horsepower rating and fuel efficiency are key considerations for many buyers, with manufacturers continually pushing the boundaries in both areas. For instance, some ATVs now boast horsepower ratings exceeding 100, while others offer impressive fuel efficiency, enabling longer riding sessions. Lighting systems and payload capacity are other essential features, particularly for those using ATVs for work or recreational activities in challenging environments. Rock crawling and hill climbing require robust suspension systems and ground clearance, while seating capacity and transmission type cater to rider comfort and off-road capability.
- Fuel injection and exhaust systems contribute to improved engine performance, with torque output and engine displacement playing crucial roles in determining an ATV's power and versatility. Additionally, diagnostic tools and performance tuning options enable riders to optimize their vehicles for various applications. Industry growth expectations remain strong, with analysts projecting a steady compound annual growth rate (CAGR) of around 5% over the next five years. This trend is driven by the expanding applications of ATVs across sectors, including agriculture, construction, and recreation. For example, a leading ATV manufacturer reported a 15% increase in sales for its agricultural line due to the growing popularity of these vehicles among farmers for tasks such as crop monitoring and livestock management.
- This underscores the market's continuous evolution and the importance of staying attuned to emerging trends and consumer needs. In summary, the ATV market is characterized by continuous innovation and adaptability, with manufacturers addressing the evolving needs of consumers across various sectors. From horsepower and fuel efficiency to suspension systems and diagnostic tools, the latest offerings reflect a commitment to enhancing performance, safety, and overall riding experience.
What are the Key Data Covered in this All-Terrain Vehicle (ATV) Market Research and Growth Report?
-
What is the expected growth of the All-Terrain Vehicle (ATV) Market between 2025 and 2029?
-
USD 2.16 billion, at a CAGR of 8.4%
-
-
What segmentation does the market report cover?
-
The report is segmented by Engine Capacity (400cc-800cc, Below 400cc, and Above 800cc), Application (Recreational, Sports, Agriculture, and Military and defense), Propulsion (Gasoline, Diesel, and Electric), Geography (North America, Europe, APAC, Middle East and Africa, and South America), and Distribution Channel (Dealerships, Online Retail, and Direct Sales)
-
-
Which regions are analyzed in the report?
-
North America, Europe, APAC, Middle East and Africa, and South America
-
-
What are the key growth drivers and market challenges?
-
Growing use of ATVs in recreational, sports, and military applications, Environmental concerns due to increasing use of ATVs
-
-
Who are the major players in the All-Terrain Vehicle (ATV) Market?
-
BMS Motorsports Inc., Bombardier Recreational Products Inc., HISUN Motors Corp., Honda Motor Co. Ltd., Kawasaki Heavy Industries Ltd., Kayo USA, Kubota Corp., Mahindra and Mahindra Ltd., Massimo Motor Sports LLC, Nebula Automotive Pvt. Ltd., Polaris Inc., SHERP, Suzuki Motor Corp., Taiwan Golden Bee Co. Ltd., Tao Motor Inc., Textron Inc., TOMCAR, Yamaha Motor Co. Ltd., and ZHEJIANG CFMOTO POWER Co. Ltd.
-
Market Research Insights
- The ATV market is a continually evolving industry, with ongoing advancements in technology and consumer preferences shaping its trajectory. Two significant data points illustrate this dynamic growth. First, the demand for ATVs with independent suspension systems has seen a notable increase, accounting for over 60% of total sales in recent years. This trend reflects consumers' preference for improved ride comfort and handling. Second, industry analysts anticipate that the global ATV market will expand at a steady pace, with growth expectations reaching approximately 5% annually over the next decade.
- This expansion can be attributed to various factors, including the growing popularity of off-road recreational activities and the increasing availability of affordable ATV models. An example of this trend can be seen in the sales figures for a leading ATV manufacturer, which reported a 7% increase in sales of their independent suspension models last year.
We can help! Our analysts can customize this all-terrain vehicle (atv) market research report to meet your requirements.
 RIA -
RIA - 
